4253
Normative T1 and T2 relaxation times and measurement repeatability of abdomen organs at 3T using 2D MR FingerprintingSanjay Sridaran1, Ananya Panda2, Yong Chen3, Jesse Hamilton4, Shivani Pahwa2, Katherine Wright2, Yun Jiang2, Joshua Batesole2, Mark Griswold2,4, Nicole Seiberlich2,4, and Vikas Gulani2,4
1School of Medicine, Case Western Reserve University, Cleveland, OH, United States, 2Radiology, Case Western Reserve University, Cleveland, OH, United States, 3Radiology, University of North Carolina at Chapel Hill, Chapel Hill, NC, United States, 4Biomedical Engineering, Case Western Reserve University, Cleveland, OH, United States
Synopsis
T1 and T2 mapping of abdominal organs provides valuable information for characterization of abdominal pathologies, but is limited by technical difficulties. Previous work has demonstrated the utility of MR Fingerprinting (MRF) for abdominal relaxometry. However, there are still limited normative data for different abdominal organs. In this study, 2D MRF was applied to 22 subjects to establish normative values for abdominal organs at 3T and assess repeatability. Our results demonstrated a good agreement with the literature and repeatability of the measurement. The values obtained in this study can also serve as a reference for future clinical studies.
Introduction
T1 and T2 mapping of abdominal organs and using tissue relaxation times to characterize abdominal pathologies holds considerable promise, but is limited by technical difficulties. Current relaxometry methods involve long scan times and are not repeatable or reproducible.1 Respiratory motion and B1 (transmit field) inhomogeneity are additional challenges in the abdomen. MRF has the ability to simultaneously measure multiple tissue properties in a time-efficient manner.2 Our previous work demonstrated an accurate T1 and T2 quantification method in the abdomen in a single breath-hold, which is an improvement on existing abdominal mapping techniques.3 However, there are limited data available on normative T1 and T2 relaxation times of abdominal organs. The purposes of this study were to optimize the abdominal MRF method and establish normative values of abdominal organs at 3T using 2D MRF. A secondary objective was to assess the repeatability of 2D MRF in the abdomen.Methods
The 2D MRF technique in the abdomen has been described previously.4 It is based on fast imaging with steady state free precession technique (MRF-FISP) with a spiral readout.4 A total of 2304 time points were acquired for MRF acquisition and the acquisition time for each slice was ~22 sec with breath-hold. Compared to previous abdominal MRF implementation, a higher spatial resolution was achieved (1.25 mm vs. 1.9 mm) with a longer spiral readout (5.5 ms vs. 2.9 ms) and fat suppression module was applied to reduce the effect of fat on spiral blurring. In this IRB-approved study, 22 asymptomatic volunteers (6M/16F) with mean age 29 y.o. (range 20-58 y.o), height 166 cm (range 155-188 cm), and weight 66.2 kg (range 52.2-88.5 kg) were scanned on a 3T MR scanner (Siemens Skyra®) using 16 channel body coil after obtaining written informed consent. Three axial slices were prescribed on breath-hold coronal scouts of upper abdomen. The center slice was positioned at mid-pancreas and top and bottom slices were positioned 5 cm cranial and caudal to the center slice to cover liver, spleen and kidneys, respectively. Each slice was 5 mm thick. Raw data were processed in MATLAB and regions of interest were drawn by a trained radiologist (7 years of radiology experience) for right and left lobes of liver on all three slices, spleen and body of pancreas in center slice and cortex and medulla of the better visualized kidney in the bottom slice. T1 and T2 values for each ROI were obtained through a pattern-matching process and were compared to existing literature values for T1 and T2 relaxation times in abdominal organs at 3T.3,5-7 For the repeatability analysis, 4 of the volunteers were scanned a second time between 20 and 50 days after their original scan with identical methodology, followed by a comparison of relaxation times for each organ between the first and second scans.Results
Figure 1 shows representative T1, T2 and M0 maps from one volunteer. The T1 and T2 (mean ± SD) values for liver, spleen, pancreas, kidney cortex, and kidney medulla for 22 healthy volunteers are shown alongside literature values in Table 1. Table 2 shows T1 and T2 values measured in the three axial slices in liver for left and right lobes. Results from the repeatability analysis are shown in Figures 2a and 2b.Discussion
Establishing normative values for abdomen organs represents the first step for further studies in abdomen relaxometry. This work represents the largest number of healthy volunteers scanned to date employing a technique that allows simultaneous mapping of T1 and T2 in a time-efficient manner. Most of the T1 and T2 values derived from this study are in good agreement with T1 and T2 values derived from different volunteers in previous studies.3,5-7 Compared to the results obtained in the previous 2D abdominal MRF study3, higher T1 values were noticed in liver, spleen and kidney medulla in the current study. The reason for longer observed T1 is not clear at this time; further exploration of this phenomenon is underway. The T1 and T2 for values for right and left lobes of liver for three axial sections are similar, suggesting intra-organ consistency. Repeat measurements for four volunteers scanned on two separate occasions also demonstrate agreement across the different organs scanned, suggesting that the method is repeatable. Further expansion of this dataset is ongoing.Conclusion
MRF provides an opportunity to perform abdomen relaxometry and provide a reference for comparison and evaluation of various abdominal pathologies.Acknowledgements
Research Support: NIH grants 1R01EB016728, 1R01BB017219, 1R01DK098503, T35DK111373, and Siemens Healthineers.References
- Shah B, et al. Quantitative MR Imaging: Physical Principles and Sequence Design in Abdominal Imaging. Radiographics, 2011; 31:867-875.
- Dan M, et al. Magnetic resonance fingerprinting. Nature, 2013; 187–192.
- Chen Y, et al. MR Fingerprinting for Rapid Quantitative Abdominal Imaging. Radiol, 2016; 279:278-286.
- Hamilton JI, et al. MR fingerprinting for rapid quantification of myocardial T1, T2, and proton spin density. Magn. Reson. Med. 2016:77:1446-1458.
- Chen Y, et al. Rapid Volumetric T1 Mapping of the Abdomen Using 3D Through-Time Spiral GRAPPA. Magn. Reson. Med. 2015; 75:1457-1465.
- De Bazelaire CMJ, et al. MR Imaging Relaxation Times of Abdominal and Pelvic Tissues Measured in Vivo at 3.0 T: Preliminary ResultsRadiol, 2004; 230:652-659.
- Hoad CL, et al. Quantification of T(2) in the abdomen at 3.0 T using a T(2)-prepared balanced turbo field echo sequence. Magn. Reson. Med 2010; 63:356-364.
Figures
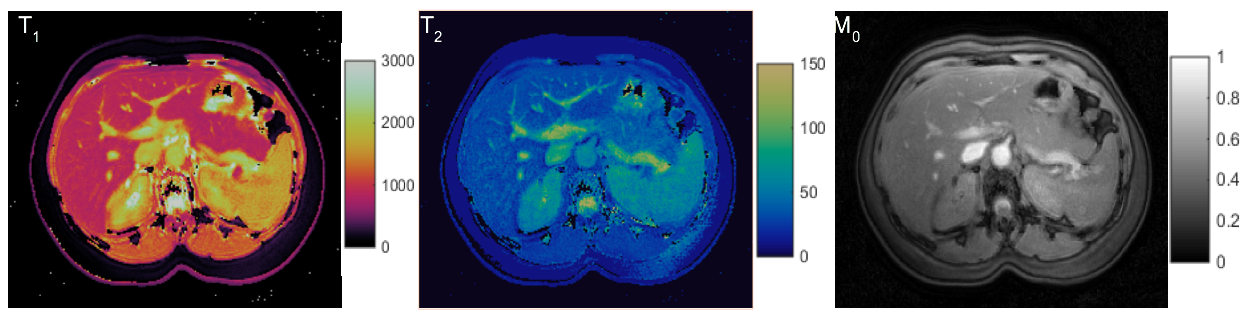
Figure 1: Representative T1, T2
and M0 maps from center slice of one volunteer showing all
organs.
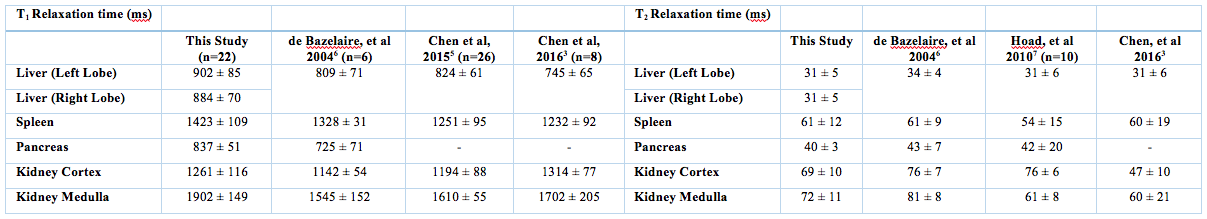
Table
1. T1 and T2 values (mean ± SD) for
liver, spleen, pancreas, kidney cortex, and kidney medulla in 22 healthy
volunteers.
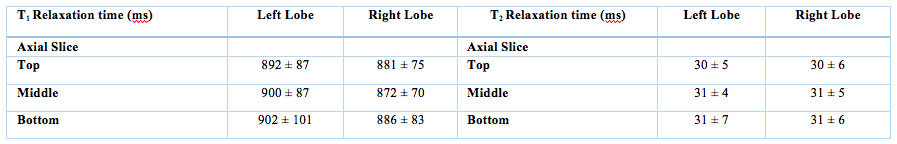
Table
2. T1 and T2 values (mean ± SD) for
three axial slices in left and right lobes of liver in 22 healthy volunteers.
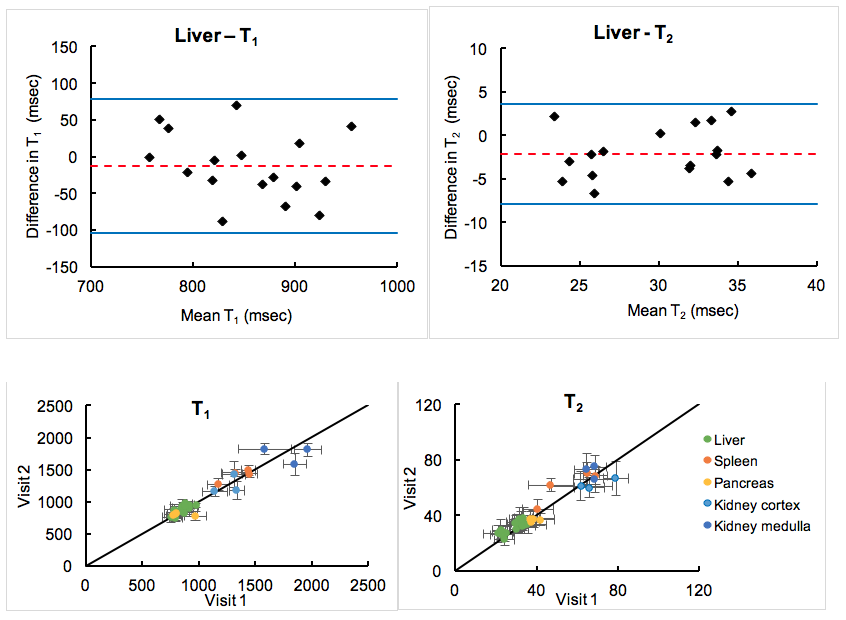
Figure 2: 2a (above). Bland-Altman
analysis for T1 and T2 relaxation times for measurements
within the liver for the volunteers scanned on two separate occasions (n=4). 2b
(below). Visual comparison of relaxation times between the two visits for each
organ studied.