4251
Doped Polyvinylpyrrolidone Solutions for Tunable T1, T2, and ADC in Multiparametric Phantoms1University of Colorado Boulder, Boulder, CO, United States, 2NIST, Boulder, CO, United States, 3Case Western Reserve University, Cleveland, OH, United States
Synopsis
A multiparametric phantom for quantitative MRI and magnetic resonance fingerprinting was developed. Solutions of PVP were used to tune the apparent diffusion coefficient (ADC), and then doped with Mn to control T1 and T2. The addition of Mn did not affect the ADC, but did significantly shorten T1 and T2, demonstrating the potential of independently tuning relaxation times and ADC.
Introduction
Magnetic Resonance Fingerprinting (MRF) shows great promise in providing parametric maps of physical quantities such as relaxation times, proton density1, and apparent diffusion coefficient (ADC)2. MRF implementations can be validated by comparing MRF maps to those generated by gold standard quantitative MRI (qMRI) techniques, such as inversion recovery (IR) for T1 measurements, when using reference objects with physiologically-relevant values. Previous phantom MRF experiments employed materials that are tuned for a single quantitative parameter3. In this study, we endeavored to create multiparametric materials that allow independent tuning of T1, T2, and ADC, to better represent the parameter values seen in vivo.Methods
The NIST/NCI/QIBA diffusion phantom uses aqueous solutions of polyvinylpyrrolidone (PVP) to tune ADC values in a range from 120 to 1100 x 10-6 mm2/s at 0 °C, with a larger range seen at ambient temperatures (up to ~2200 x 10-6 mm2/s)4, 5. In order to not affect the diffusion properties of the PVP solutions, small amounts of highly concentrated Mn solutions were added to change the relaxation times. Mn was chosen for its high r2/r1 ratio (16.5) in aqueous solutions at ambient temperatures, facilitating matching of tissue values, which tend to have large R2/R1 ratios. A set of target ADCs, T1, and T2 values were used to calculate the amount of Mn needed for each solution, using the relationship:
$$R_i=R_{i,0}+r_{i, Mn} C_{Mn}$$
where $$$i=1,2$$$ for longitudinal and transverse relaxation, $$$R_i=1/T_i$$$ is the net relaxation rate, $$$R_{i,0}$$$ is the undoped rate, $$$r_i$$$ is the relaxivity (rate per unit concentration of Mn) and $$$C_{Mn}$$$ is the Mn concentration.
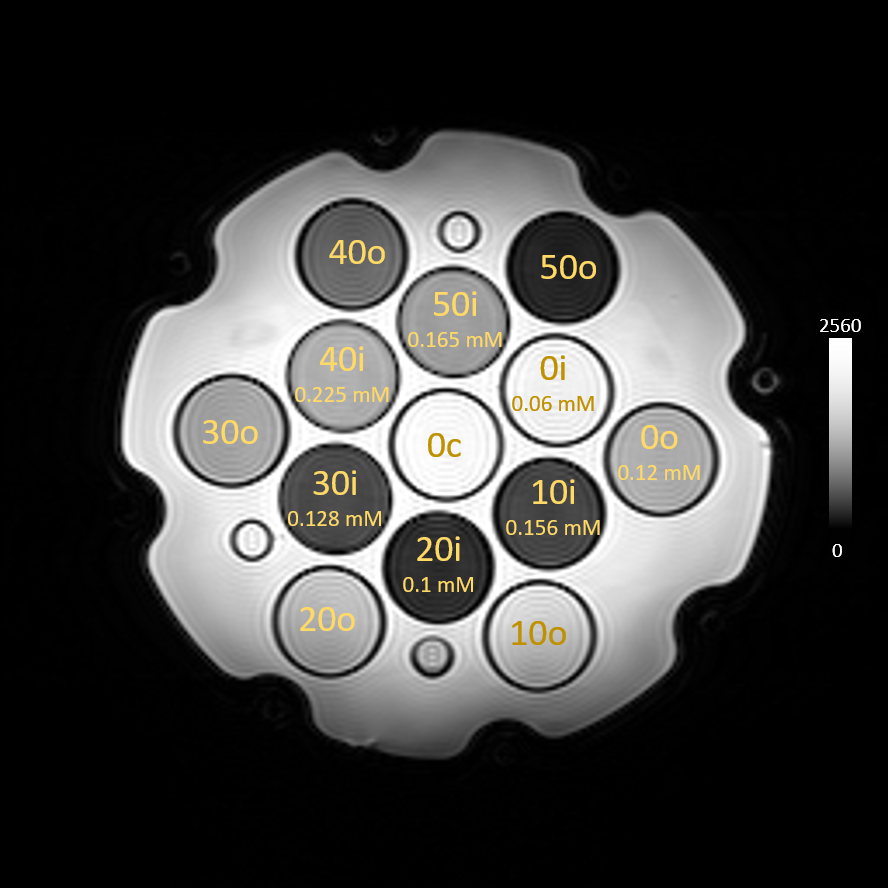
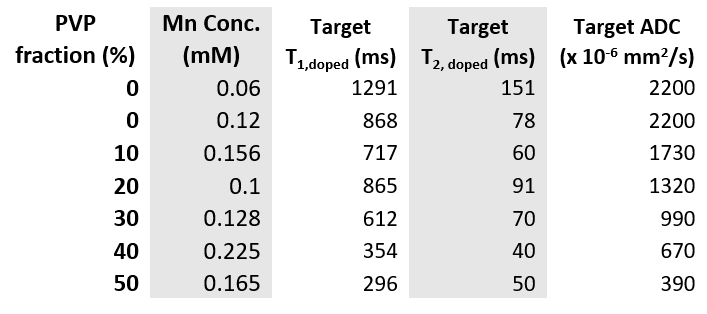
A 25.4 mM stock solution of Mn2+ was added to solutions of PVP ranging from 0% to 50% mass fraction. Sub-mL volumes of stock Mn were added to ~50 mL of PVP solution, leaving the concentration of PVP essentially unchanged (Table 1). Samples were poured into 30 mL HDPE vials. The diffusion phantom was disassembled to replace undoped vials with the solutions seen in Table 1; a full set of undoped vials was left in the phantom to allow comparison of T1, T2, and ADC values with the doped materials (Figure 1). The phantom was imaged at 23 °C on a 3T clinical scanner using conventional IR and spin echo (SE) techniques to assess T1 and T2, and a diffusion-weighted imaging (DWI) sequence to measure the ADC. The phantom was then imaged with an MRF protocol for comparison to these techniques.
Results
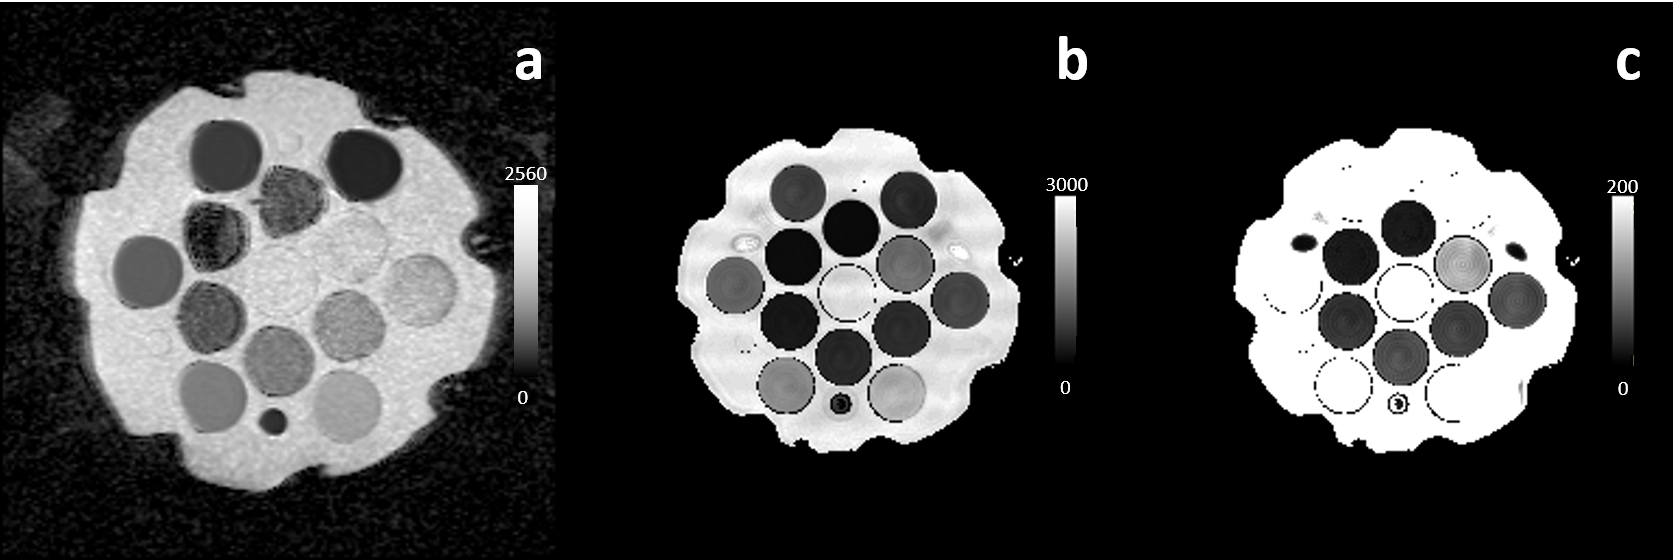
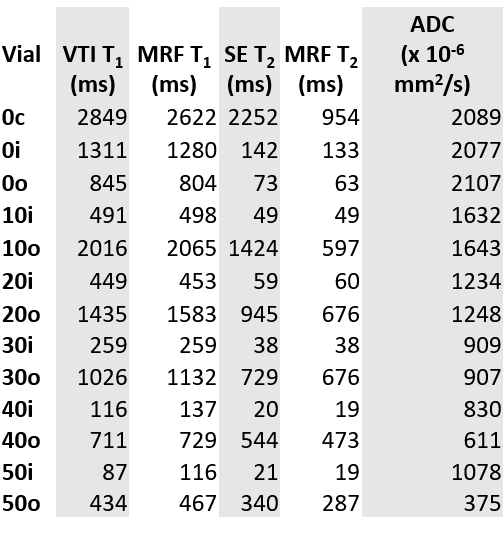
Qualitative images of the phantom show good homogeneity within the vials (Fig. 1), indicating good mixing. ROIs were drawn in the IR, SE, and DWI experiments, and used to calculate T1 and T2 values; an ADC map as well as MRF maps of T1 and T2 are shown in Fig. 2a-c, where ROIs were drawn in each vial to obtain average T1, T2, and ADC. Table 2 shows the results for the IR, SE, and DWI experiments for all 13 vials, as well as MRF T1 and T2 results. Relaxation times are notably different in the doped solutions vs. their undoped counterparts for the same PVP concentration. ADCs are essentially unchanged between doped and undoped solutions, with the exception of the 40% and 50% PVP.Discussion
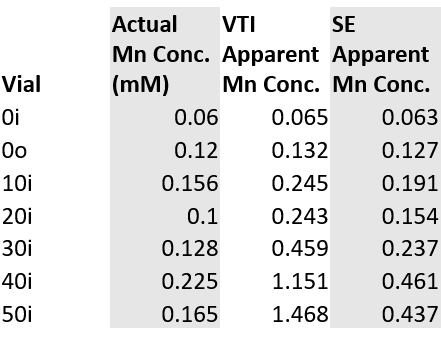
The MRF results agree with gold standard qMRI techniques, though solutions with long T2 values do not match as well as solutions with T2 <143 ms. While 0% PVP (doped water) solutions demonstrate T1 and T2 values close to the target values, the 10-50% solutions have much shorter T1 and T2 values than anticipated. These large discrepancies indicate that Eq. (1) is not valid in the regime of high concentration of PVP, and that Mn2+ is conjugating to the polymer chains, leading to relaxation mechanisms not present in purely aqueous solutions. The strong effect of PVP concentration on these relaxation mechanisms is evident by back calculating the “apparent” Mn concentration based on the IR and SE results (Table 3): the increasing apparent concentration indicates larger Mn relaxivity as a function of PVP concentration, and that this effect is most pronounced for spin-lattice vs. spin-spin mechanisms. The large ADC values seen for the doped 40% and 50% solutions are likely a consequence of the short T2 values, which were ~5X shorter than the echo time of 92 ms, leading to a low signal-to-noise ratio.Conclusions
We have demonstrated a promising approach for engineering multiparametric materials for qMRI and MRF. In the PVP system used in this study relaxation times were shorter than anticipated; by reducing the Mn concentrations employed here, the target values should be achievable. This unexpected strong relaxation by Mn2+ ions warrants further study of the relaxation mechanisms, which will aid in engineering future multiparametric materials.Acknowledgements
YJ and MAG would like to acknowledge funding support from Siemens Healthcare and NIH grants 1R01EB016728,1R01BB017219.References
- Ma D, Gulani V, Seiberlich N, Liu K, Sunshine JL, Duerk JL, Griswold MA. Magnetic resonance fingerprinting. Nature, 2013;495:187–192. doi:10.1038/nature11971
- Jiang Y, Hamilton JI, Lo W-C, Wright KL, Ma D, Coristine AJ, Seiberlich, Gulani V, Griswold MA. Simultaneous T1, T2 and Diffusion Quantification using Multiple Contrast Prepared Magnetic Resonance Fingerprinting. Proc. 25th ISMRM Annual Meeting, Honolulu, 2017;1171
- Jiang Y, Ma D, Keenen KE, Stupic KF, Gulani V, Griswold MA. Repeatability of Magnetic Resonance Fingerprinting T1 and T2 Estimates Assessed Using the ISMRM/NIST MRI System Phantom. Mag. Reson. Med., 2017;78:1452-1457. doi:10.1002/mrm.26509
- Holz M, Heil SR, Sacco A. Temperature-dependent self-diffusion coefficients of water and six selected molecular liquids for calibration in accurate 1H NMR PFG measurements. Phys. Chem. Chem. Phys., 2000;2:4740-4742. doi:10.1039/B005319H
- Boss MA, Chenevert TL, Waterton JC, Morris DM, Ragheb H, Jackson A, deSouza N, Collins DJ, van Beers BE, Garteiser P, Doblas S, Russek SE, Keenan KE, Jackson EF, Zahlmann G. Temperature-controlled Isotropic Diffusion Phantom with Wide Range of Apparent Diffusion Coefficients for Multicenter Assessment of Scanner Repeatability and Reproducibility. Proc. 22nd ISMRM Annual Meeting, Milan, 2014;4505
Figures