4250
From phantoms to patients: Paving the way for MRF in clinical practice1Erwin L. Hahn Institute for MRI, University of Duisburg-Essen, Essen, Germany, 2High Field and Hybrid MR Imaging, University Hospital Essen, Essen, Germany, 3Department of Diagnostic and Interventional Radiology and Neuroradiology, University Hospital Essen, Essen, Germany, 4Siemens Healthcare GmbH, Erlangen, Germany, 5Friedrich-Alexander Universität Erlangen-Nürnberg, Erlangen, Germany, 6Case Western Reserve University, Cleveland, OH, United States
Synopsis
This study puts the focus on estimating the stability of MRF data in phantoms, volunteers and patients and investigates the options to integrate MRF into routine clinical workflows. The phantom and in-vivo scans yielded consistent and reproducible results throughout different scan days. Thus, MRF enables a fast and reliable generation of quantitative data in vivo and, along with appropriate reference values, has the potential to improve diagnostics in neuroimaging.
Introduction
Magnetic resonance fingerprinting (MRF) enables the direct derivation of tissue-characteristic quantities such as spin density and relaxation constants T1 and T2. The additional information on tissue characteristics derived from MRF bears the potential to leverage the understanding of tumor biology to advanced levels and potentially improve current clinical MR imaging procedures. However, the reliability of these novel mapping techniques needs to be thoroughly evaluated before introducing it into a productive clinical environment. This study puts the focus on estimating the stability of MRF data in phantoms, volunteers and patients and investigates the options to integrate MRF into routine clinical workflows.Methods
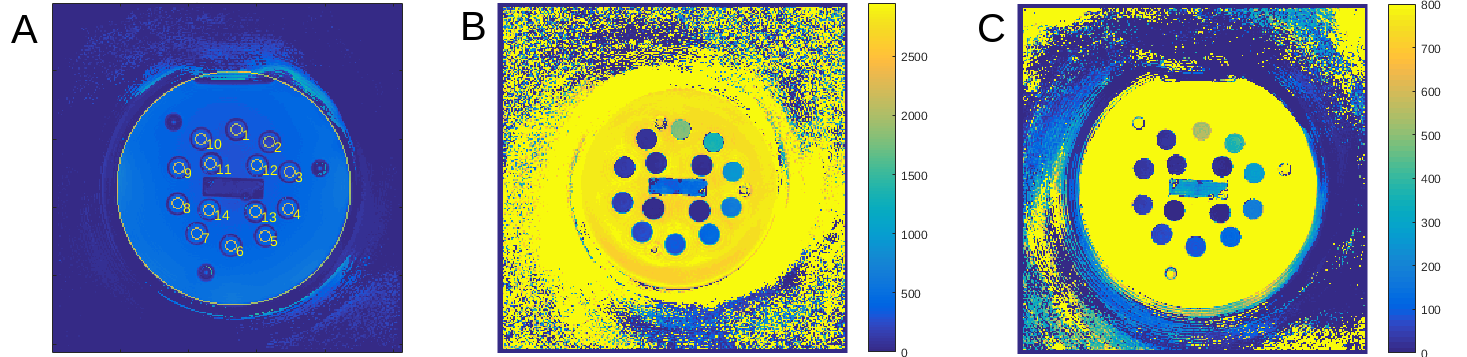
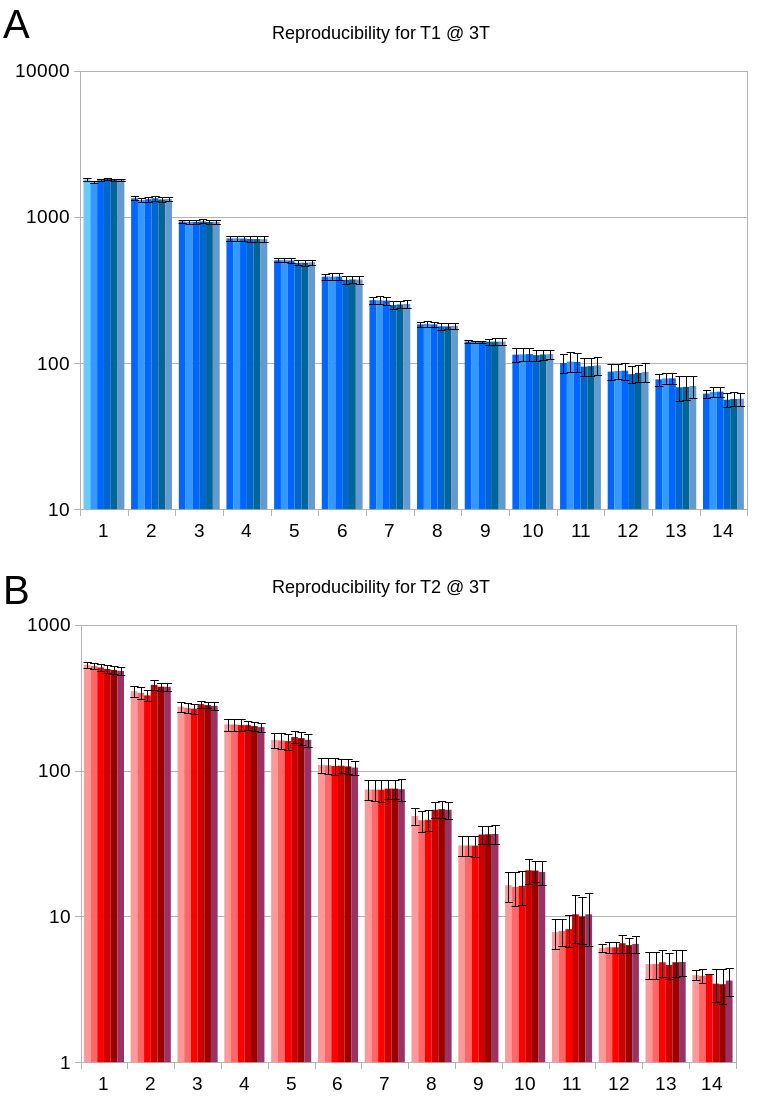
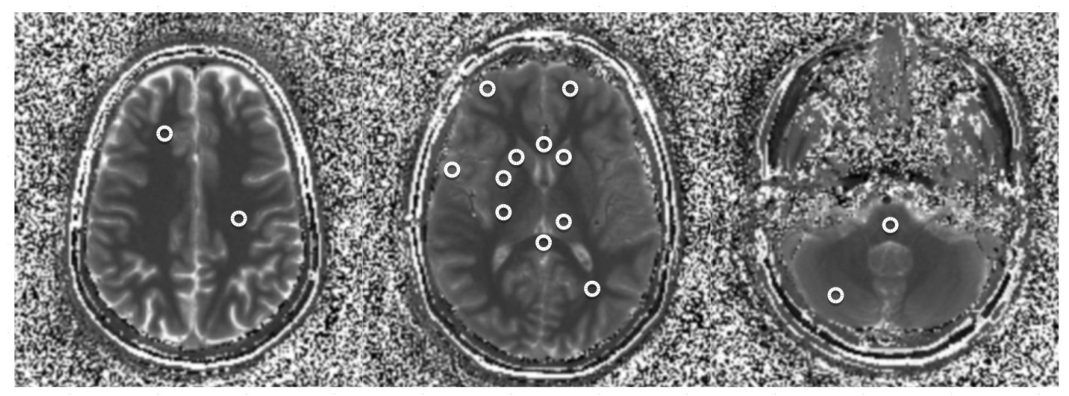
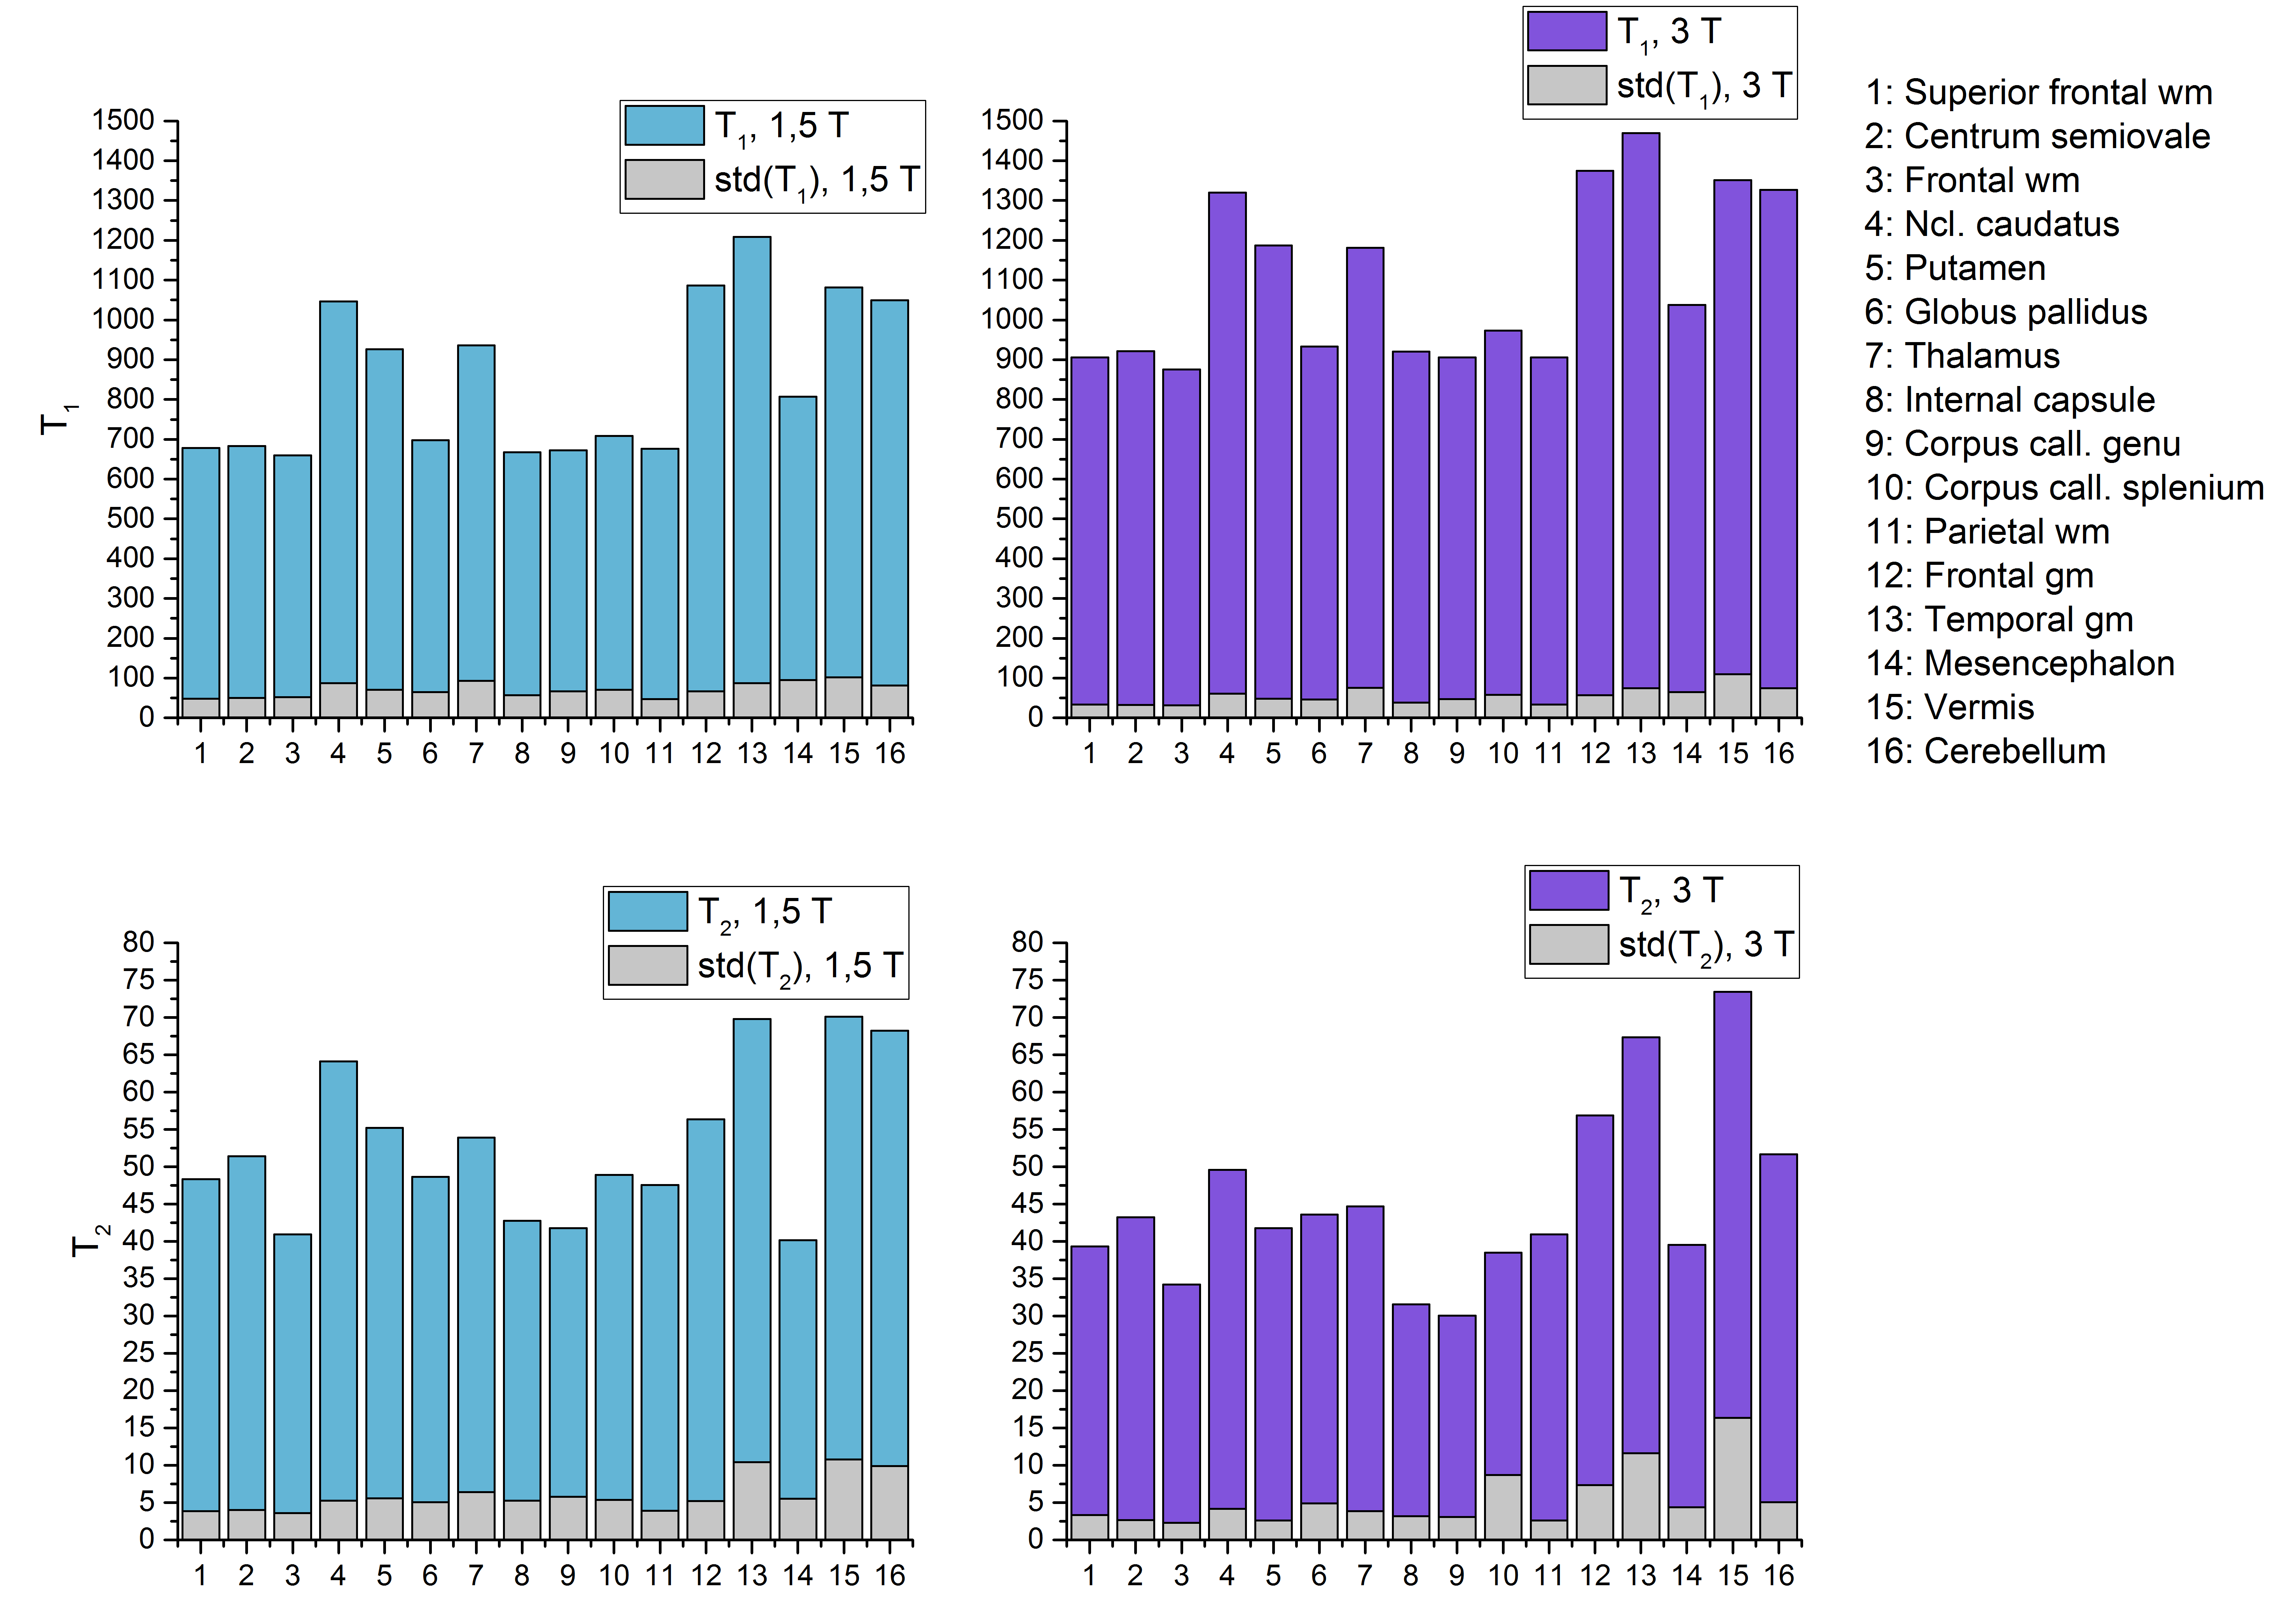
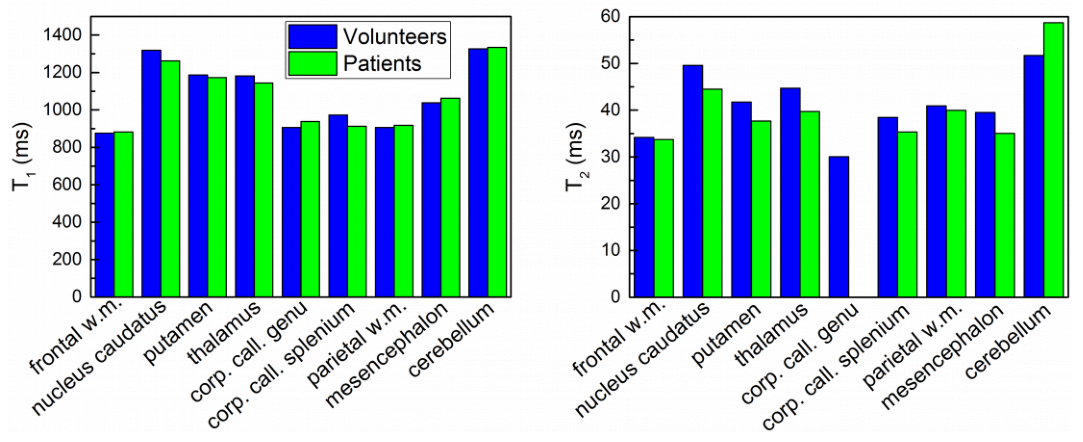
A non-commercial MRF sequence prototype1 was implemented on a 1.5T and a 3T MR system (MAGNETOM Aera and Skyra, Siemens Healthcare, Erlangen, Germany). For repeated stability scans, a standardized NIST system phantom2 was used, which contains multiple compartments resulting in a broad range of T1 and T2. The obtained quantities were compared to their corresponding reference values provided by NIST and analysed with respect to their variability throughout different scan days (Fig. 1 and 2). Moreover, MRF was applied in n = 10 healthy volunteers (at both field strengths), acquiring maps from three reference slices covering the upper lobar, mid-ventricular and cerebellar neurocranium. Based on these scans, 16 anatomical regions were selected in each of the datasets (Fig. 3) and compared in an intra-individual fashion. In addition, a total of n = 80 patients with various neurological pathologies that were scheduled for a routine clinical protocol at 3T received an additional MRF protocol prior to the application of contrast agent. The anatomical regions that were not infiltrated by the pathology were extracted from the patient imaging data and compared across subjects and to their corresponding values in healthy volunteers, where applicable.Results and Discussion
The NIST phantom scans yielded consistent and reproducible results throughout different scan days with a standard deviation of less than 5% for T1 and less than 8% for T2 (Fig. 2). All measured T1 and T2 values agreed well with the reference values as given by NIST with a consistent tendency to underestimate the long relaxation times and overestimate the short relaxation times which confirms an earlier finding of Jiang et al.3. All subjects tolerated the MRF protocol well. Given the rather short acquisition and reconstruction times on the order of less than one minute, an integration into the routine scanning workflow seems feasible. However, particular care needs to be taken when positioning the field-of-view to adequately cover the anatomic regions under study. The obtained T1 values were reproducible and showed a standard deviation of less than 10% across volunteers and patients. The same held true for T2 values, yet with a higher spread of up to 20% (Fig. 4 and 5). In general, quantities obtained from patient data showed higher deviations from their mean value (T1: 7.2%, T2: 14.8%) than those in healthy subjects (T1: 4.9%, T2: 8.6%). This may be attributed to the larger spread in age and gender of the patient cohort as shown in previous publications. It is thus evident, that the latter parameters have to be considered when trying to establish a clinical reference database of normal and pathological T1 and T2 in various anatomical regions.Conclusion
MRF is feasible in phantoms, healthy volunteers, and patients. It enables a fast and reliable generation of quantitative data in vivo and thus, along with appropriate reference values, has the potential to improve diagnostics in neuroimaging.Acknowledgements
No acknowledgement found.References
1. Jiang, Y., et al., MR fingerprinting using fast imaging with steady state precession (FISP) with spiral readout. MRM, (2015)
2. Russek et al., Characterization of NIST/ISMRM MRI system phantom. Proc. of the 20th Annual Meeting of ISMRM (2012), #2456
3. Jiang et al., Repeatability of magnetic resonance fingerprinting T1 and T2 estimates assessed using the ISMRM/NIST MRI system phantom, MRM (2016)
Figures