4247
Simultaneous Observation of Two Paramagnetic MRI Contrast Agents via Dynamic T1 and T2 Mapping with Magnetic Resonance Fingerprinting: Initial In Vivo Results1Radiology, Case Western Reserve University, Cleveland, OH, United States, 2Biomedical Engineering, Case Western Reserve University, Cleveland, OH, United States, 3Molecular Biology and Microbiology, Case Western Reserve University, Cleveland, OH, United States, 4Neurosciences, Case Western Reserve University, Cleveland, OH, United States, 5Physiology and Biophysics, Case Western Reserve University, Cleveland, OH, United States, 6Pediatrics, Case Western Reserve University, Cleveland, OH, United States
Synopsis
In this work simultaneous T1 and T2 mapping via MR Fingerprinting was used to observe the distribution of dysprosium and gadolinium MRI contrast agents in a mouse tumor model. Changes from baseline in T1 and T2 were observed using each agent alone and an increased effect was seen when agents were used in combination. Additionally, a decrease in the dysprosium dose lead to a reduction in the level of T1 and T2 enhancement observed. These results indicate that MRF might be able to be used to track multiple MRI contrast agents in vivo.
Introduction
We have recently developed a Dual Contrast–Magnetic Resonance Fingerprinting1 (DC-MRF) technology that can simultaneously and unambiguously estimate the local concentration of two MRI contrast agents for molecular MR imaging applications. In the initial in vitro study, accurate estimates of the concentration for each MRI contrast agent were obtained simultaneously in phantoms containing various mixtures of the two contrast agents. As a logical next step, we hypothesized that this DC-MRF acquisition could be used to sensitively track the uptake of two MRI contrast agents in mouse cancer models. Herein, we show how dynamic MRF assessments of T1 and T2 relaxation times can be used to observe contrast agent dependent intra-tumoral relaxation rate enhancement following co-administration of gadolinium (Gd) and dysprosium (Dy) MRI contrast agents in vivo.Purpose
The purpose of this work was to use MRF to dynamically map T1 and T2 before and after simultaneous injection of two MRI contrast agents in a mouse tumor model. In this initial study, dynamic ΔR1 and ΔR2 curves from dual-agent injections were compared with corresponding single-agent findings. The sensitivity of the MRF assessment was also evaluated by altering the injected dose.Methods
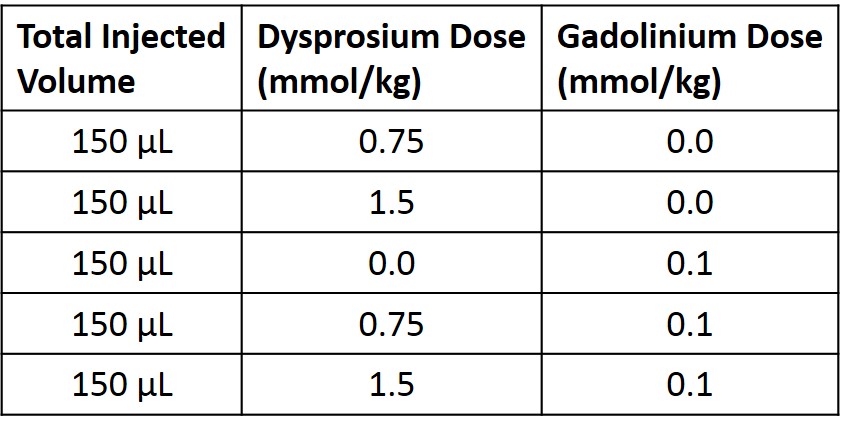
Dynamic T1 and T2 mapping was performed via MRF2 on a 9.4T Bruker Biospec preclinical MRI scanner for mice bearing LN-229 xenograft brain flank tumors before and after bolus injection of MRI contrast agents. Gadolinium (gadopentate dimeglumine) and dysprosium (Dy-DOTA-azide) contrast agents were injected via a tail-vein catheter either alone or co-administered as a mixture. An undersampled spiral FISP MRF acquisition3,4 (R=8, two minutes per scan) was used to generate the dynamic MRF-based T1 and T2 maps. MR Fingerprints for each pixel were generated from 1024 undersampled images (matrix=128x128, field-of-view=3x3mm, single slice thickness=1.5mm) and then matched on a pixel-by-pixel basis to a dictionary of simulated fingerprints with the best dictionary match yielding an estimate of T1 and T2 for that pixel2. Ten pre-contrast tumor T1 and T2 maps were acquired prior to contrast agent administration, after which mice were injected with a bolus of either a single agent (Gd or Dy) or both agents (Gd+Dy) according to the dose schedule described in Table 1. The dynamic MRF scans were continued to acquire 30 post-contrast scans resulting in a total of 40 simultaneously acquired T1 and T2 maps (total time=80 minutes). Relaxation rate enhancement from baseline was calculated as ΔR1=(1/T1-1/T10) and ΔR2=(1/T2-1/T20) where T10 and T20 were calculated as the mean value from the 10 pre-contrast scans. A region-of-interest (ROI) analysis was performed to create dynamic mean ΔR1 and ΔR2 time courses for each animal.Results
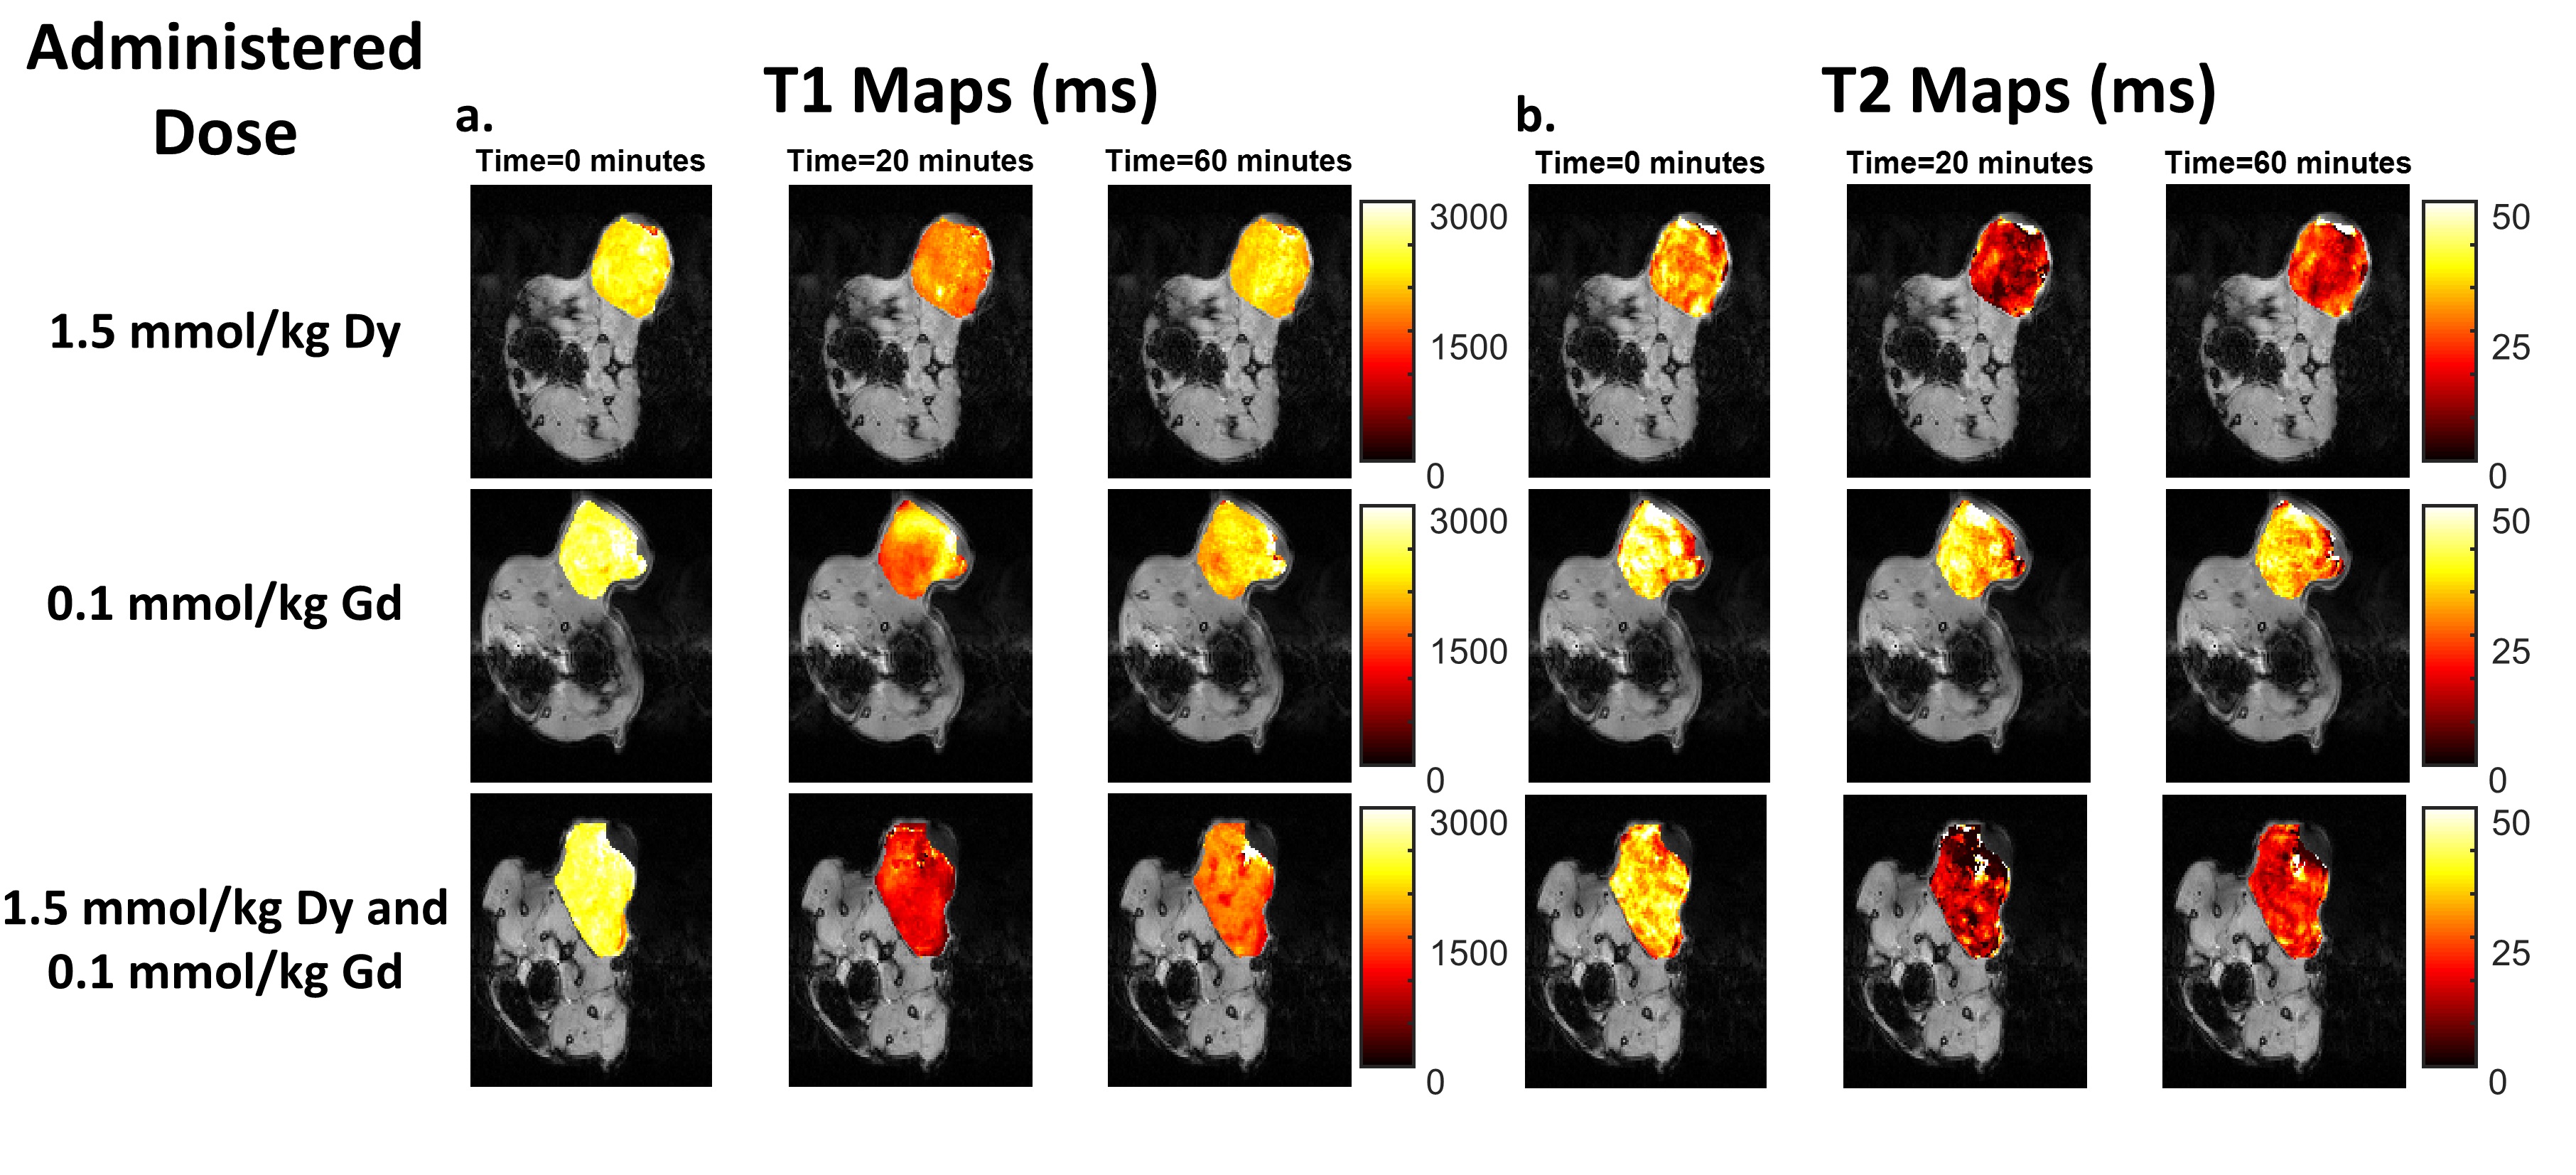
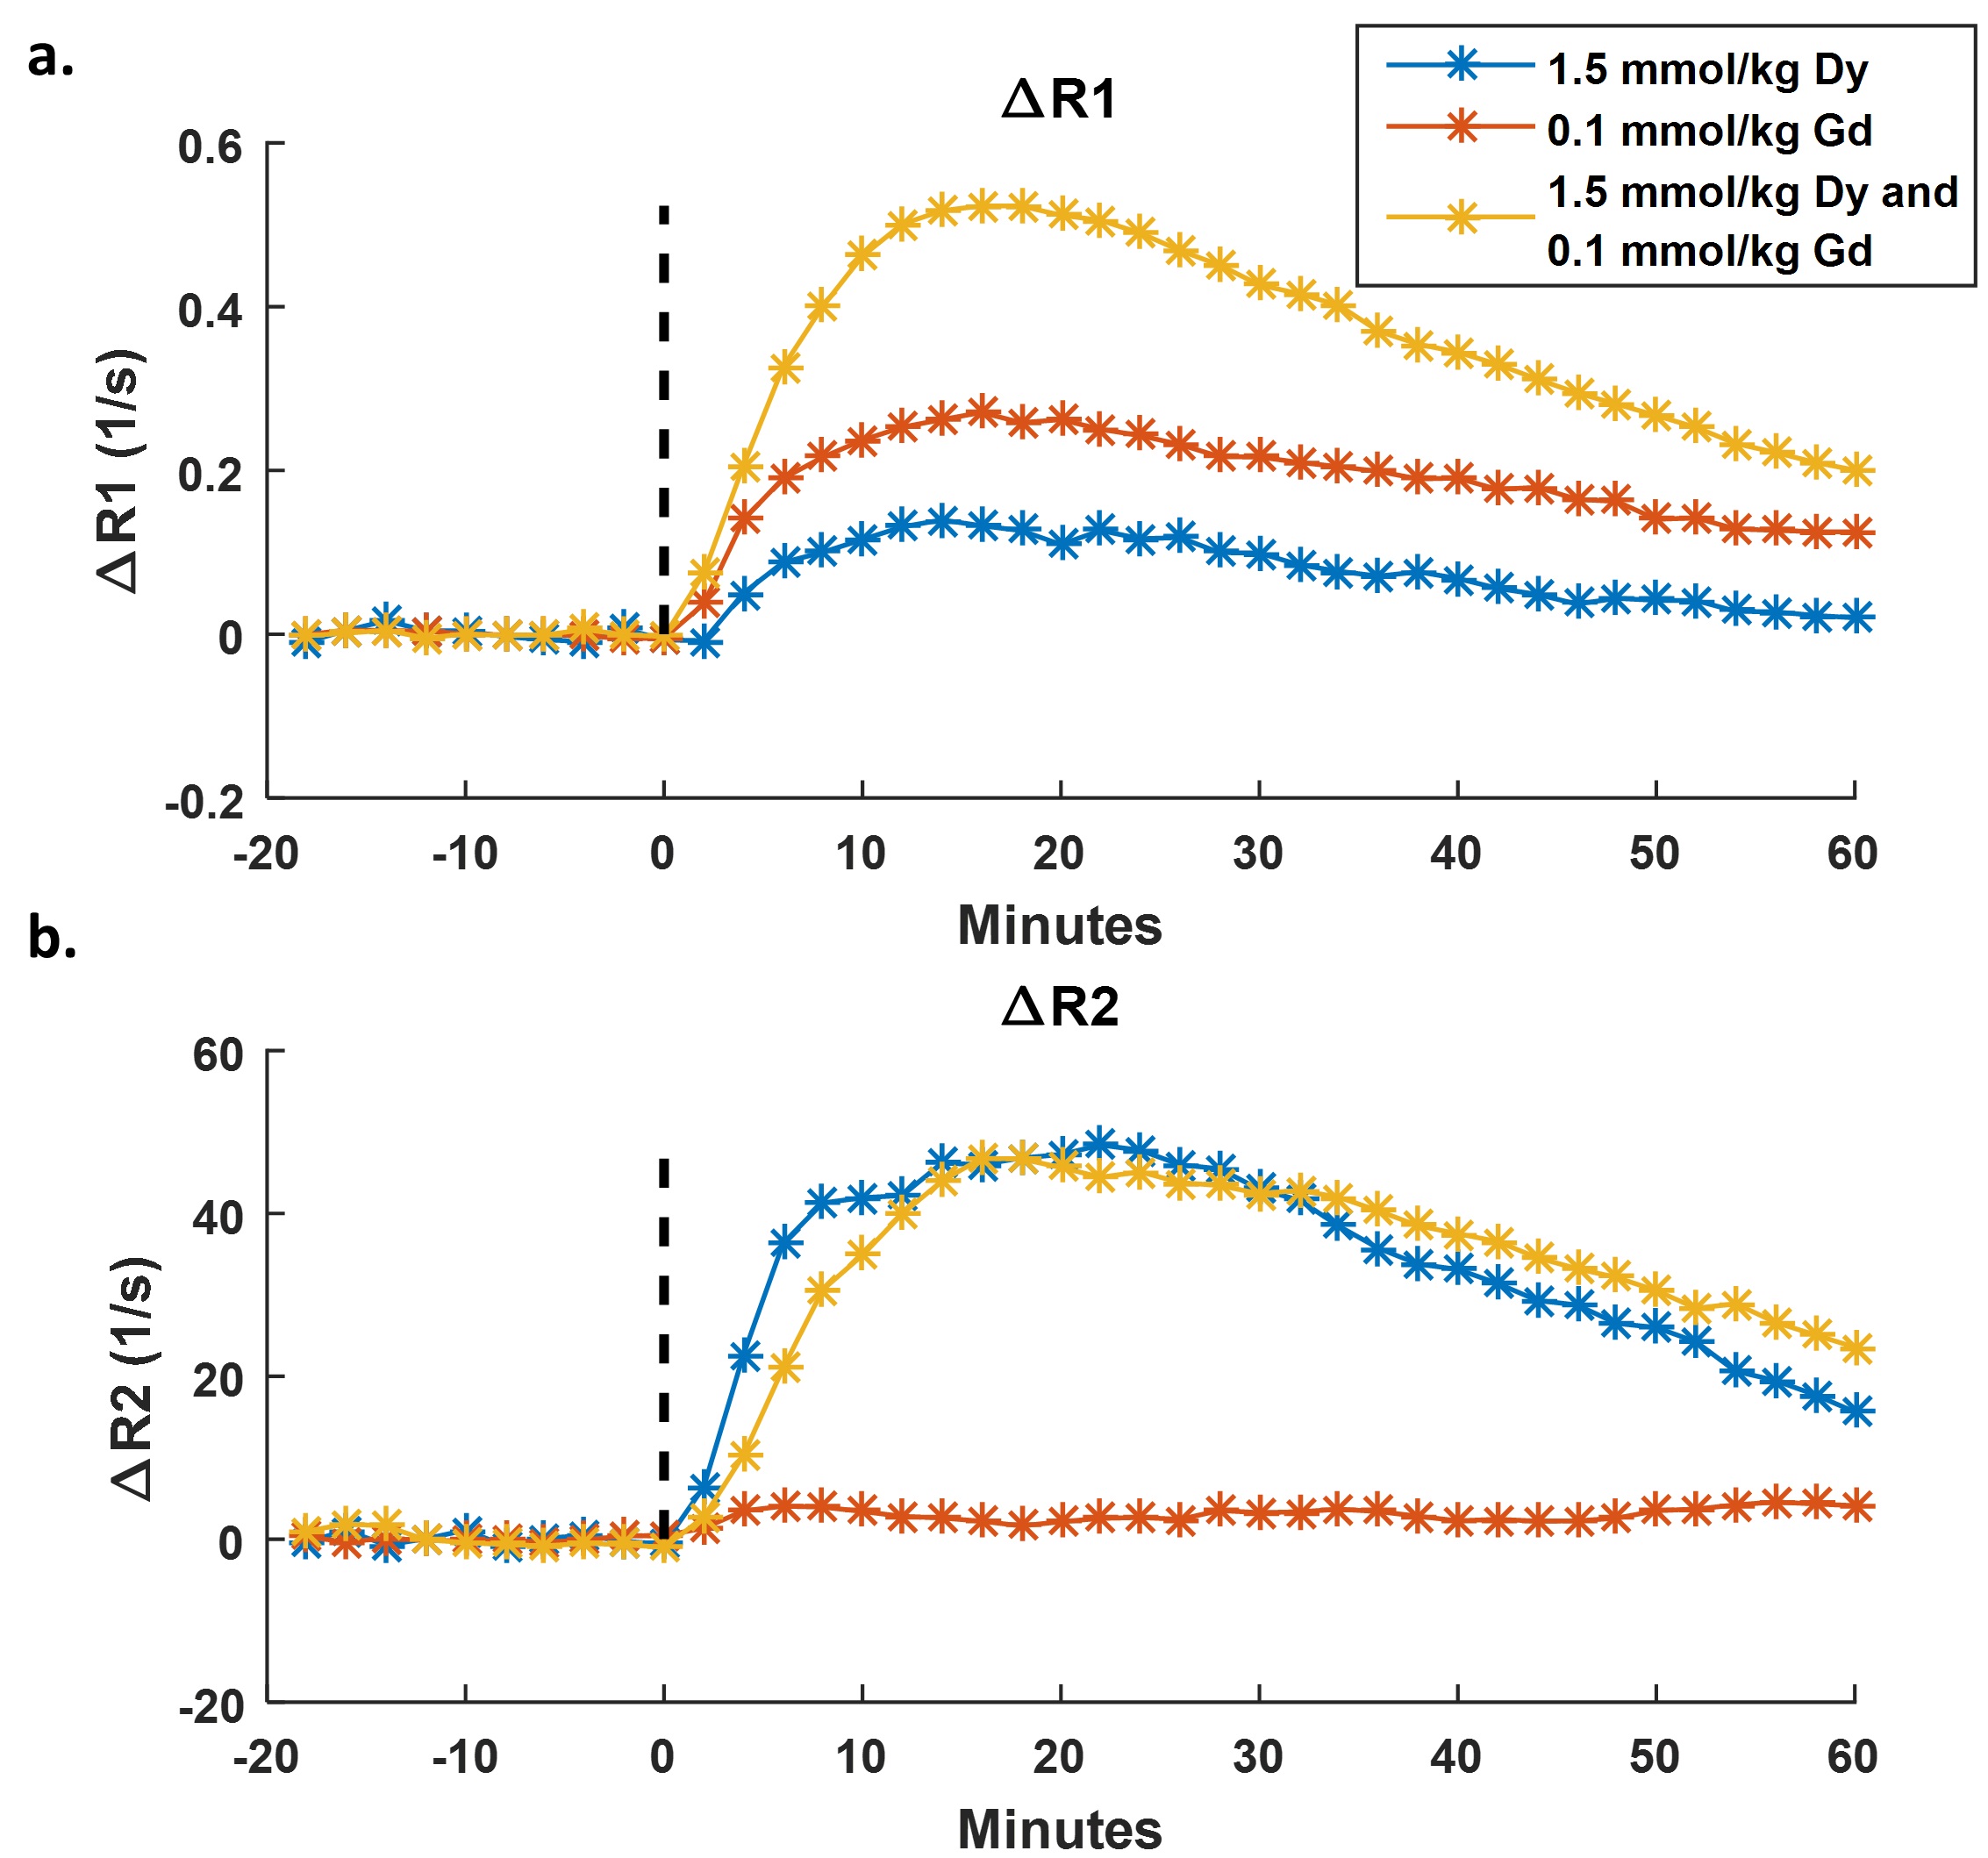
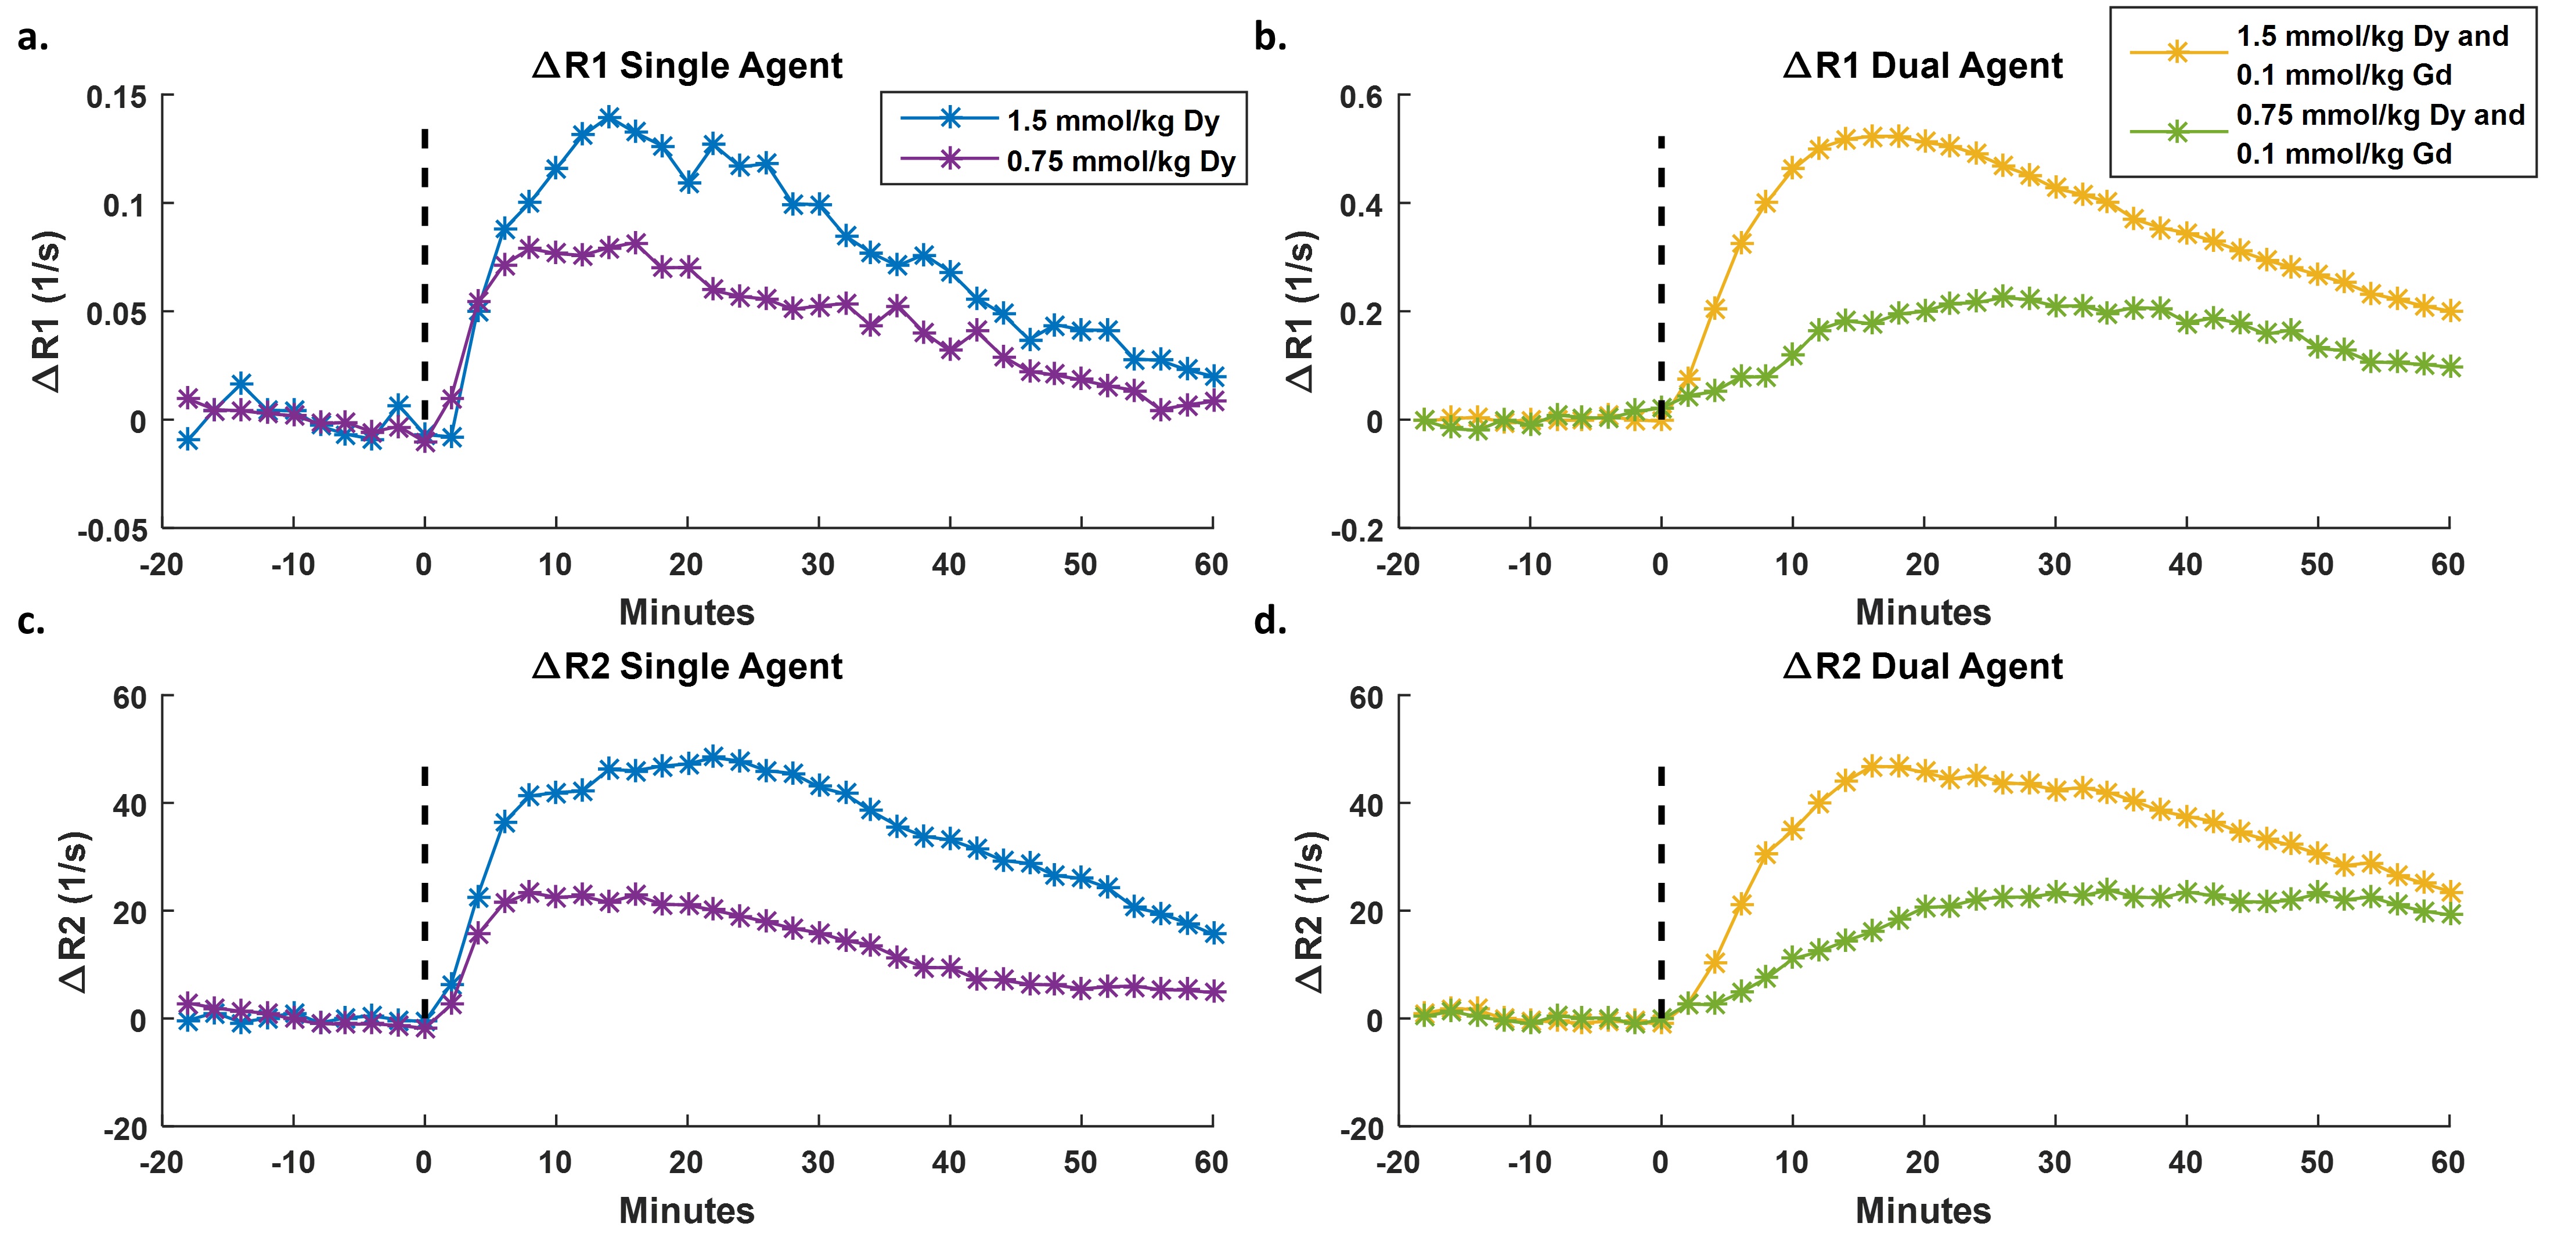
Representative single-agent and dual-agent T1 and T2 maps from time points corresponding to pre-contrast (0 minutes), peak agent concentration (20 minutes post-injection), and washout (60 minutes post-injection) are presented in Figure 1. Shortening of T1 and T2 can be seen throughout the tumor at peak concentration with recovery toward baseline observed at the later time point. ROI-based ΔR1 and ΔR2 time courses are shown in Figures 2 and 3. Pre-contrast ΔR1 and ΔR2 values were consistent for all experiments with minor variation due to tumor heterogeneity. Each ΔR1 and ΔR2 curve (except ΔR2 for Gd only) demonstrated a rapid increase immediately after bolus injection of the contrast agent(s) followed by a washout period. Importantly, the dual-agent (Gd+Dy) MRF experiments showed increased post-contrast ΔR1 and ΔR2 values in comparison to the single-agent experiments at the same injected dose (Fig. 2). The MRF-based ΔR1 and ΔR2 curves also demonstrated consistent alterations in response to reductions in the injected dose of contrast agent (Fig. 3).Discussion
This initial in vivo study demonstrates the potential for dynamic MRF T1 and T2 mapping to provide sensitive observations of relaxation rate enhancement following simultaneous administration of two paramagnetic MRI contrast agents. These initial contrast-enhanced MRF studies show that rapid MRF techniques can reliably obtain dynamic ΔR1 and ΔR2 time courses in preclinical tumor models on high-field MRI scanners. Further, co-administration of the Gd and Dy contrast agents resulted in increased peak ΔR1 and ΔR2 values compared to corresponding single-agent studies at the same injected dose. This suggests that two MRI contrast agents could be simultaneously assessed in vivo using the previously described DC-MRF methodology in combination with the multi-agent relaxation model.Conclusions
T1 and T2 quantification via MRF can detect relaxation rate enhancement due to paramagnetic MRI contrast agents either alone and as mixtures. In addition, detected alterations in T1 and T2 appear to be related to the injected dose. Overall, these results suggest that DC-MRF could be used to detect two MRI contrast agents in vivo.Acknowledgements
NIH F30 HL136190, NIH T32 EB007509, NIH TL1 TR000441, CF Foundation, NIH R21 HL130839References
1. Anderson, C., et. al., Scientific Reports, 2017.
2. Ma, D., et. al., Nature, 2013.
3. Jiang, Y., et. al., Magnetic Resonance in Medicine, 2015.
4. Gu, Y., et. al., Proceedings of the 25th Annual Meeting of the ISMRM, 2017.
Figures