4244
T2 measurement in SE-WMRI fast spin echo imaging1Imaging Center for Integrated Body, Mind and Culture, National Taiwan University, Taipei, Taiwan, 2Electrical Engineering, National Taiwan University, Taipei, Taiwan
Synopsis
To investigate the contrast in SE-WMRI spin echo imaging, we measured five tubes of SPIO solution with various concentrations using standard and SE-WMRI Multi-Slice-Multi-Echo (MSME) sequence. T2 relaxation times were then calculated based on the 16 acquired images per scan. Results show that with a 1.4-fold acceleration, the T2 relaxation time of SE-WMRI MSME remains the same within the error bar as standard imaging.
introduction
SE-WMRI is an MR imaging method that utilizes a special
sampling trajectory to achieve acceleration while maintaining equivalent
sampling density of the k-space[1]. As a result, the signal-to-noise ratio remains the same
in spite of halving the scan time. In our previous study, SE-WMRI performs
identically in terms of SNR and image details compared to standard gradient
echo & fast spin echo imaging [2]. However, due to the
gradient switching nature of SE-WMRI, we have observed some slight pronouncements
in air-tissue interfaces and vessels. To investigate the characteristics of
SE-WMRI in fast spin echo, we conducted T2 relaxation measurement based on the
well-established MSME method [3] in this study to see whether
the contrast has been changed with the application of acceleration.methods
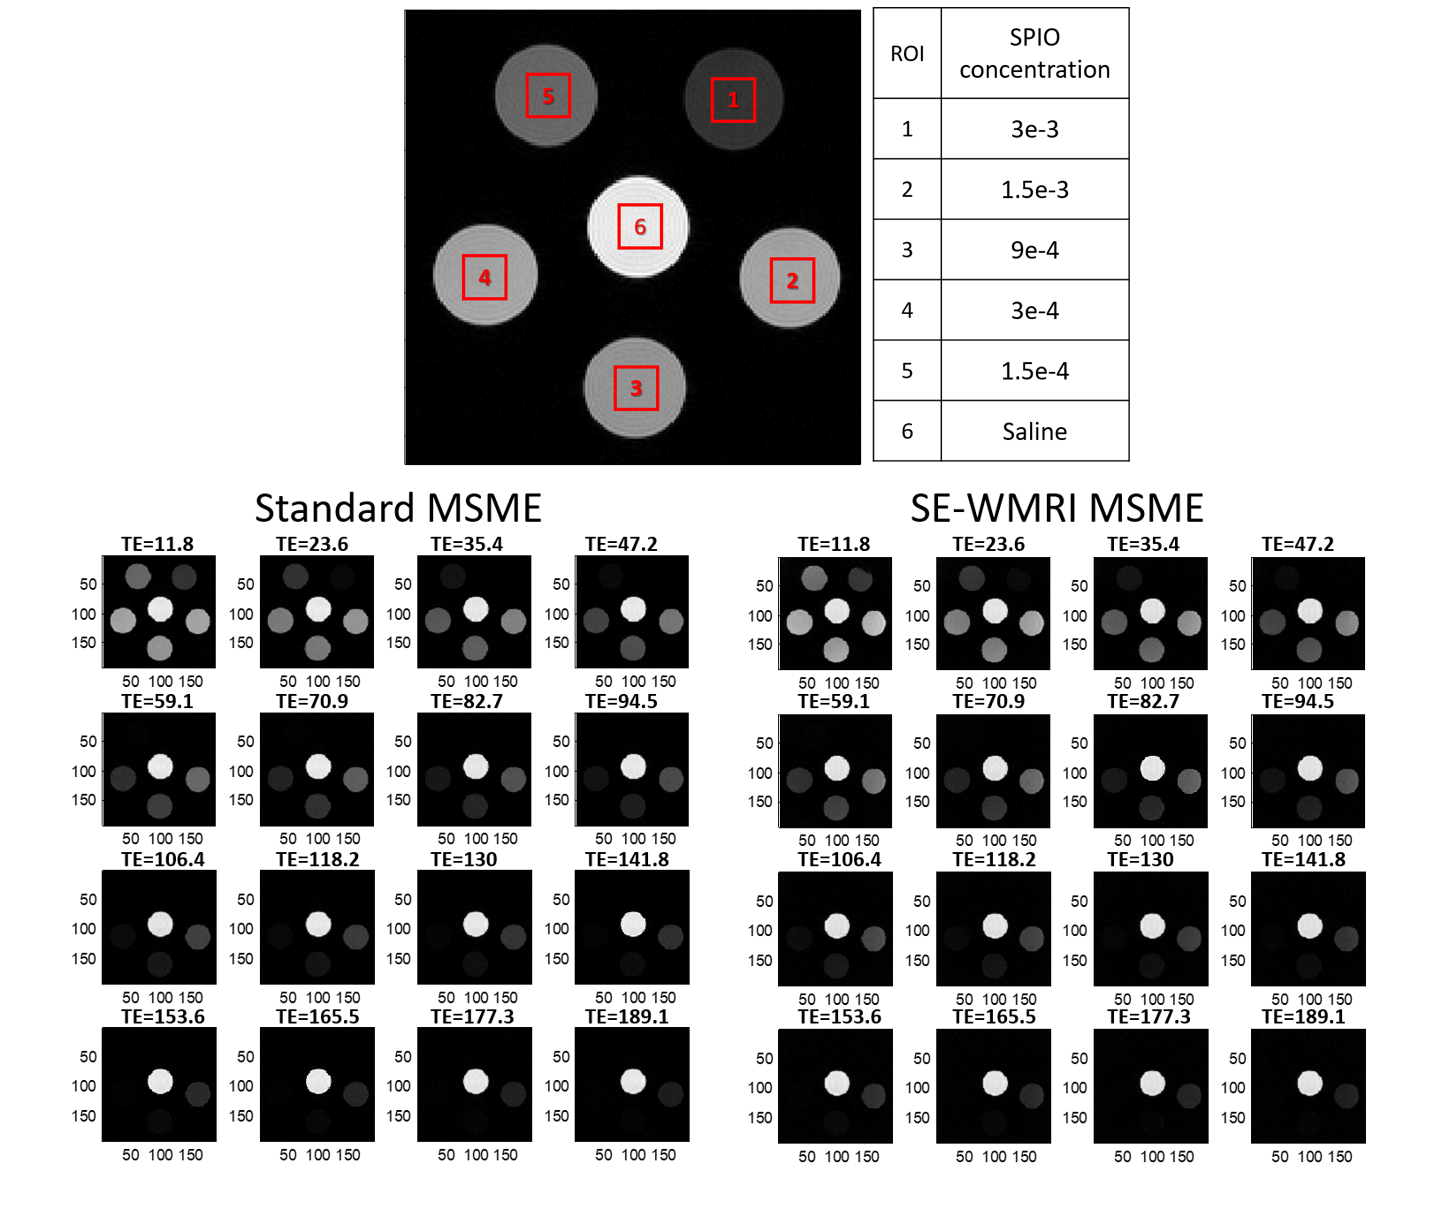
Five tubes of SPIO solution with different concentration ranging from 1.5e-4 to 3e-3 surrounds a tube of saline as reference. The concentrations were chosen after a series of tests to ensure T2 relaxation could be depicted. T2 measurement was conducted with a modified MSME sequence, with W=2, S=5 SE-WMRI acceleration applied. Imaging parameters are as follow: FOV=4cmx4cm, Mtx=192x192, TR=2500ms, number of echoes= 16. The MSME image series will have TE values of 11.8, 23.6, 35.4, 47.2, 59.1, 70.9, 82.7, 94.5, 106.4, 118.2, 130.0, 141.8, 153.6, 165.5, 177.3 & 189.1 ms. Total scan time for NEX=2 standard and W=1.4 SE-WMRI MSME imaging is 12mins & 8min20sec respectively. Signal acquired with SE-WMRI were then reconstructed with a pre-measured set of kspace trajectory to form 16 images that will be provided for image series analysis. A 20-by-20 pixels square ROI for T2 calculation was chosen within each tube, the intensity means calculated and plotted along time. All of the experiments were done on a Bruker Biospec 7T system, with a quadrature volume coil.results
Reconstructed images were shown in Fig.2, The 16-echo MSME images were highly identical between standard & SE-WMRI; brightness of tubes with higher concentration drop rapidly as TE increases, and only the signal from saline prevails.
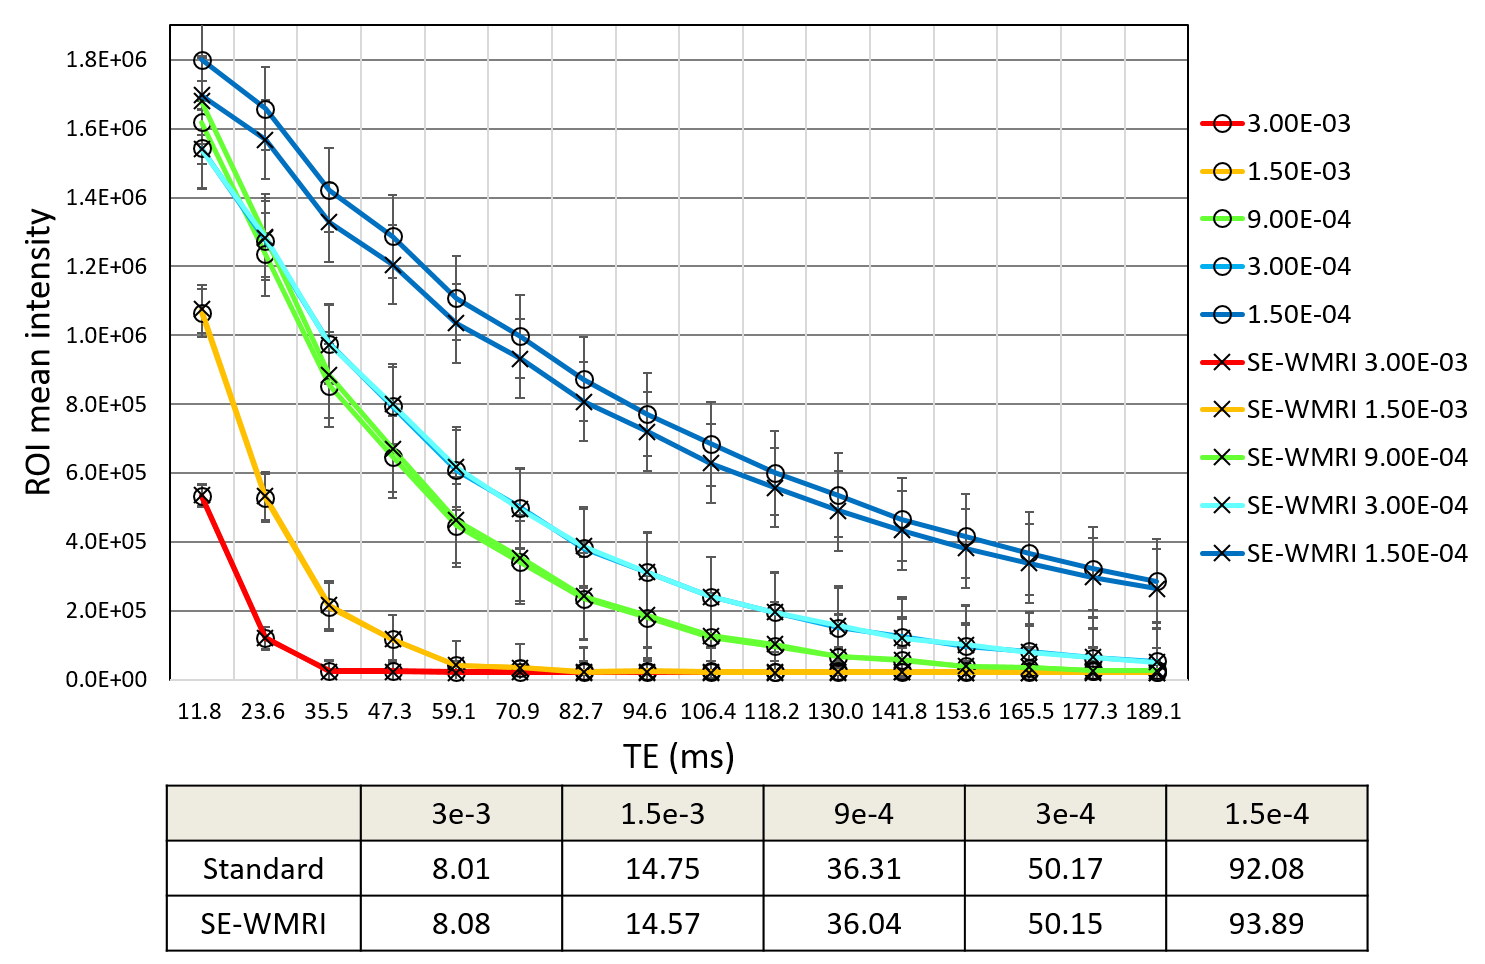
The mean intensity taken from the ROI’s was plotted in figure 3. Among different SPIO solution curves, it can be observed that signal decays faster with higher concentrations. T2 relaxation time of each tube was approximated through curve fitting and listed in the table below fig.3, here it is shown that the calculated T2 relaxation times taken with SE-WMRI (X) and standard MSME (O) were almost same throughout all concentrations.
discussion
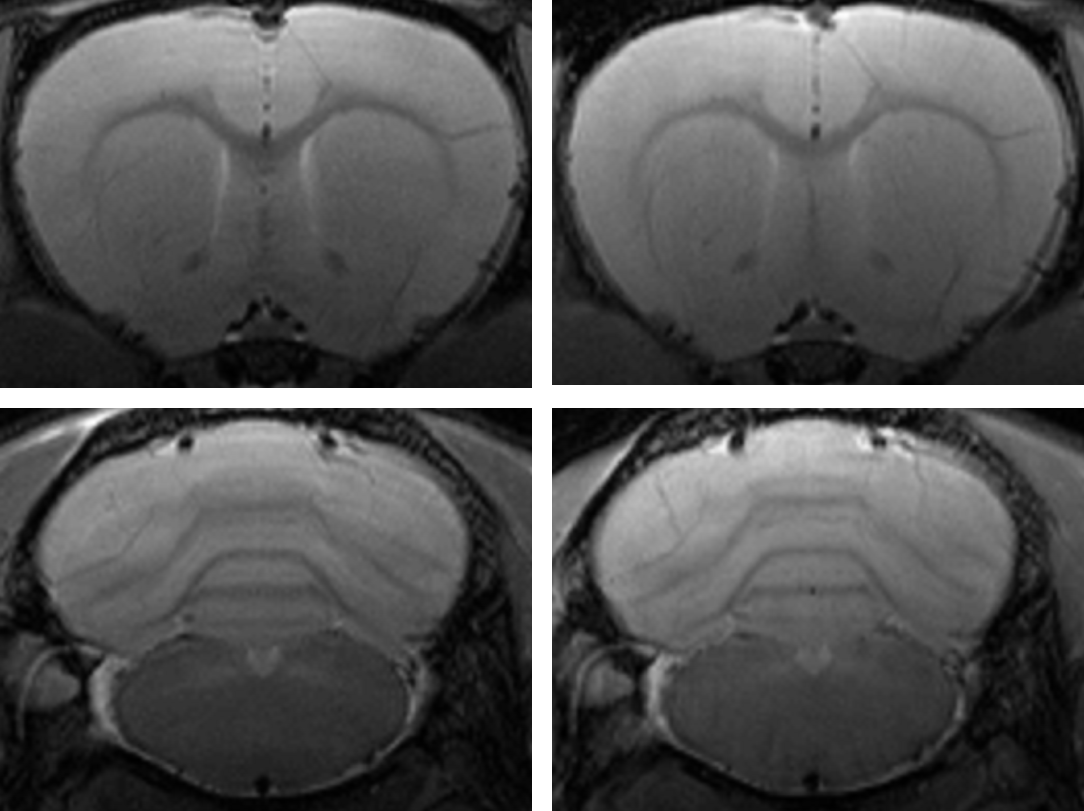
In Gradient echo (GRE) imaging we have seen pronounced T2* related features due to the nature of GRE and the gradient switching of SE-WMRI. The degree of this phenomenon also depends on gradient & shimming quality, number of segments of SE-WMRI as well as the composition of the subject. From the results in this study we can conclude that fast spin echo SE-WMRI imaging does not show such effect.conclusion
In this study we measured tubes containing different SPIO concentrations in order to measure T2 relaxation time using standard & SE-WMRI modified MSME, the results show that SE-WMRI acceleration does not affect the T2 relaxation time. Compared to the blurring effects when increasing the echo train length or the SNR loss with parallel imaging, SE-WMRI serves as a favorable alternative to speed up fast spin echo imaging scans for clinical applications.Acknowledgements
We thank 7T animal MRI Core Lab of the Neurobiology and Cognitive Science Center for technical and facility supports, and C.-H. Hsieh and J.-H. Chen of Instrumentation Center for MRI experiments at National Taiwan University.References
1. Wu, E.L., et al., Single-frequency excitation wideband MRI (SE-WMRI). Med Phys, 2015. 42(7): p. 4320-8.
2. Wu, E.L., et al. SE-WMRI Fast Spin Echo Imaging. in ESMRMB. 2017. Barcelona.
3. Chavhan, G.B., et al., Principles, techniques, and applications of T2*-based MR imaging and its special applications. Radiographics, 2009. 29(5): p. 1433-49.
Figures