4242
Optimized parameters for MP2RAGE images on 7-T MRI1Center for Information and Neural Networks, National Institute of Information and Communications Technology, Osaka, Japan, 2Graduate School of Frontier Biosciences, Osaka University, Osaka, Japan, 3Siemens Healthcare K.K., Osaka, Japan, 4Advanced Clinical Imaging Technology, Siemens Healthcare AG, Lausanne, Switzerland, 5Department of Radiology, University Hospital (CHUV), Lausanne, Switzerland, 6LTS5, École Polytechnique Fédérale de Lausanne (EPFL), Lausanne, Switzerland
Synopsis
The MP2RAGE sequence at ultra-high magnetic fields can be advantageous for investigation of microstructural changes because of reduced B1 inhomogeneity and images with different contrasts (uniform (UNI), T1, and fluid and white matter suppression (FLAWS)). In this study, we used several evaluative methods to optimize the inversion times and flip angles for UNI, T1, and FLAWS images of the MP2RAGE sequence at 7 T. We found the optimized inversion times with flip angles for UNI and T1 images, but different parameters for FLAWS images. The results suggested that different parameters of MP2RAGE at 7 T should be applied for different contrast types.
INTRODUCTION
The MP2RAGE at ultra-high magnetic fields may be useful for the segmentation of anatomical structure studies and clinical diagnosis because of reduced B1 inhomogeneity and the potential to detect microstructural changes. The MP2RAGE sequence can acquire three types of images, including uniform (UNI), T1, and fluid and white matter suppression (FLAWS) images. UNI and T1 images can be used in functional neuroimaging studies, whereas FLAWS could be applied for clinical diagnosis. However, the optimized parameters of the MP2RAGE for each type of image could be different. In this study, we evaluate the three types of images to optimize parameters at various inversion times (TIs) and flip angles (FAs) using the MP2RAGE sequence on 7-T magnetic resonance imaging (MRI).METHODS
Subjects: Three healthy male subjects without a history of neurological disease or any other medical conditions participated in this study. The study was approved by the local ethics committee.
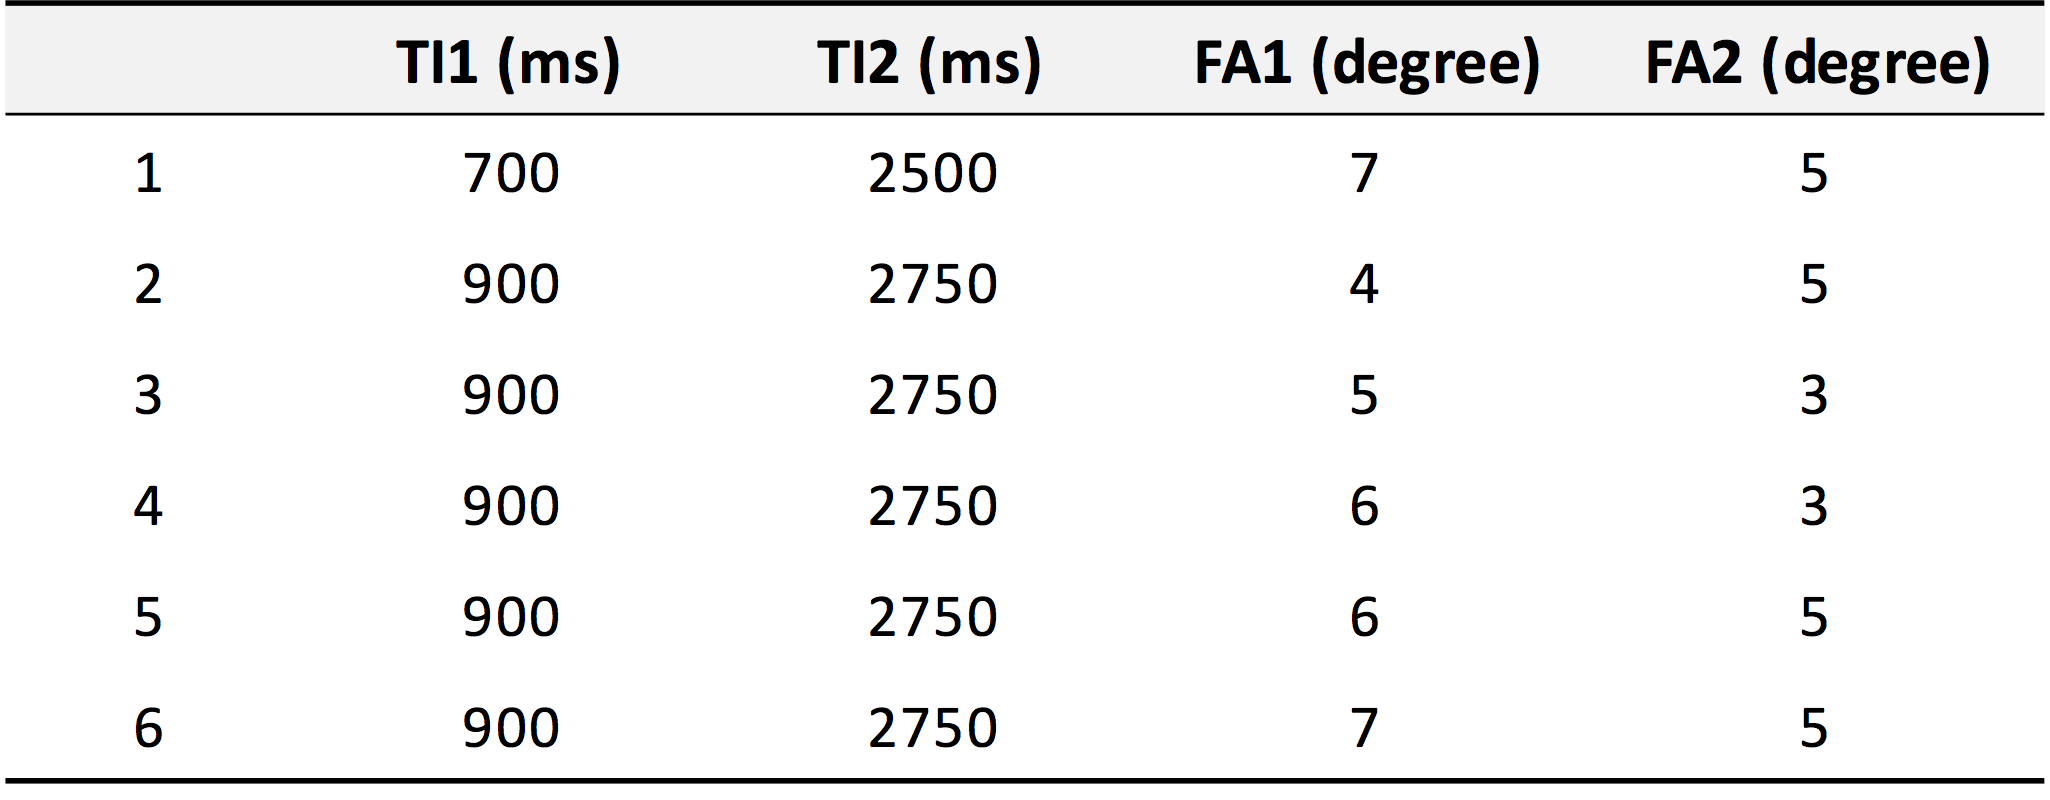
Parameters: The experiments were performed on a 7-Tesla MRI scanner (Siemens, Germany) with a 32-channel head coil (Nova Medical, USA). We used vendor-supplied MP2RAGE sequences as work-in-progress (WIP) packages. MP2RAGE images were acquired using the following common parameters: field of view (FOV) = 320 x 320, 256 slices, repetition time (TR) = 5000 ms, echo time (TE) = 3.36 ms. TIs and FAs are shown in table 1.
Analysis: UNI, T1, and FLAWS images were normalized with an MNI152 template using a linear registration method by using FSL 5.0 (FMRIB, Oxford, UK) and all intensities were extracted from four anatomical structures (frontal, occipital, parietal, and temporal lobes). To evaluate the entire cortical structure, we summed the values of the four lobes. All values were plotted and smoothed by the Gaussian filter using MATLAB 2014a (The MathWorks, Natick, MA, USA). To evaluate UNI images, images were segmented with three types of tissues (grey matter (GM), white matter (WM), cerebrospinal fluid (CSF)), and two probability distribution measurements (skewness and kurtosis) were calculated. To evaluate T1 images, peak T1 values for GM and WM were extracted from T1 images. To evaluate FLAWS images, skewness and kurtosis values were calculated.
RESULTS
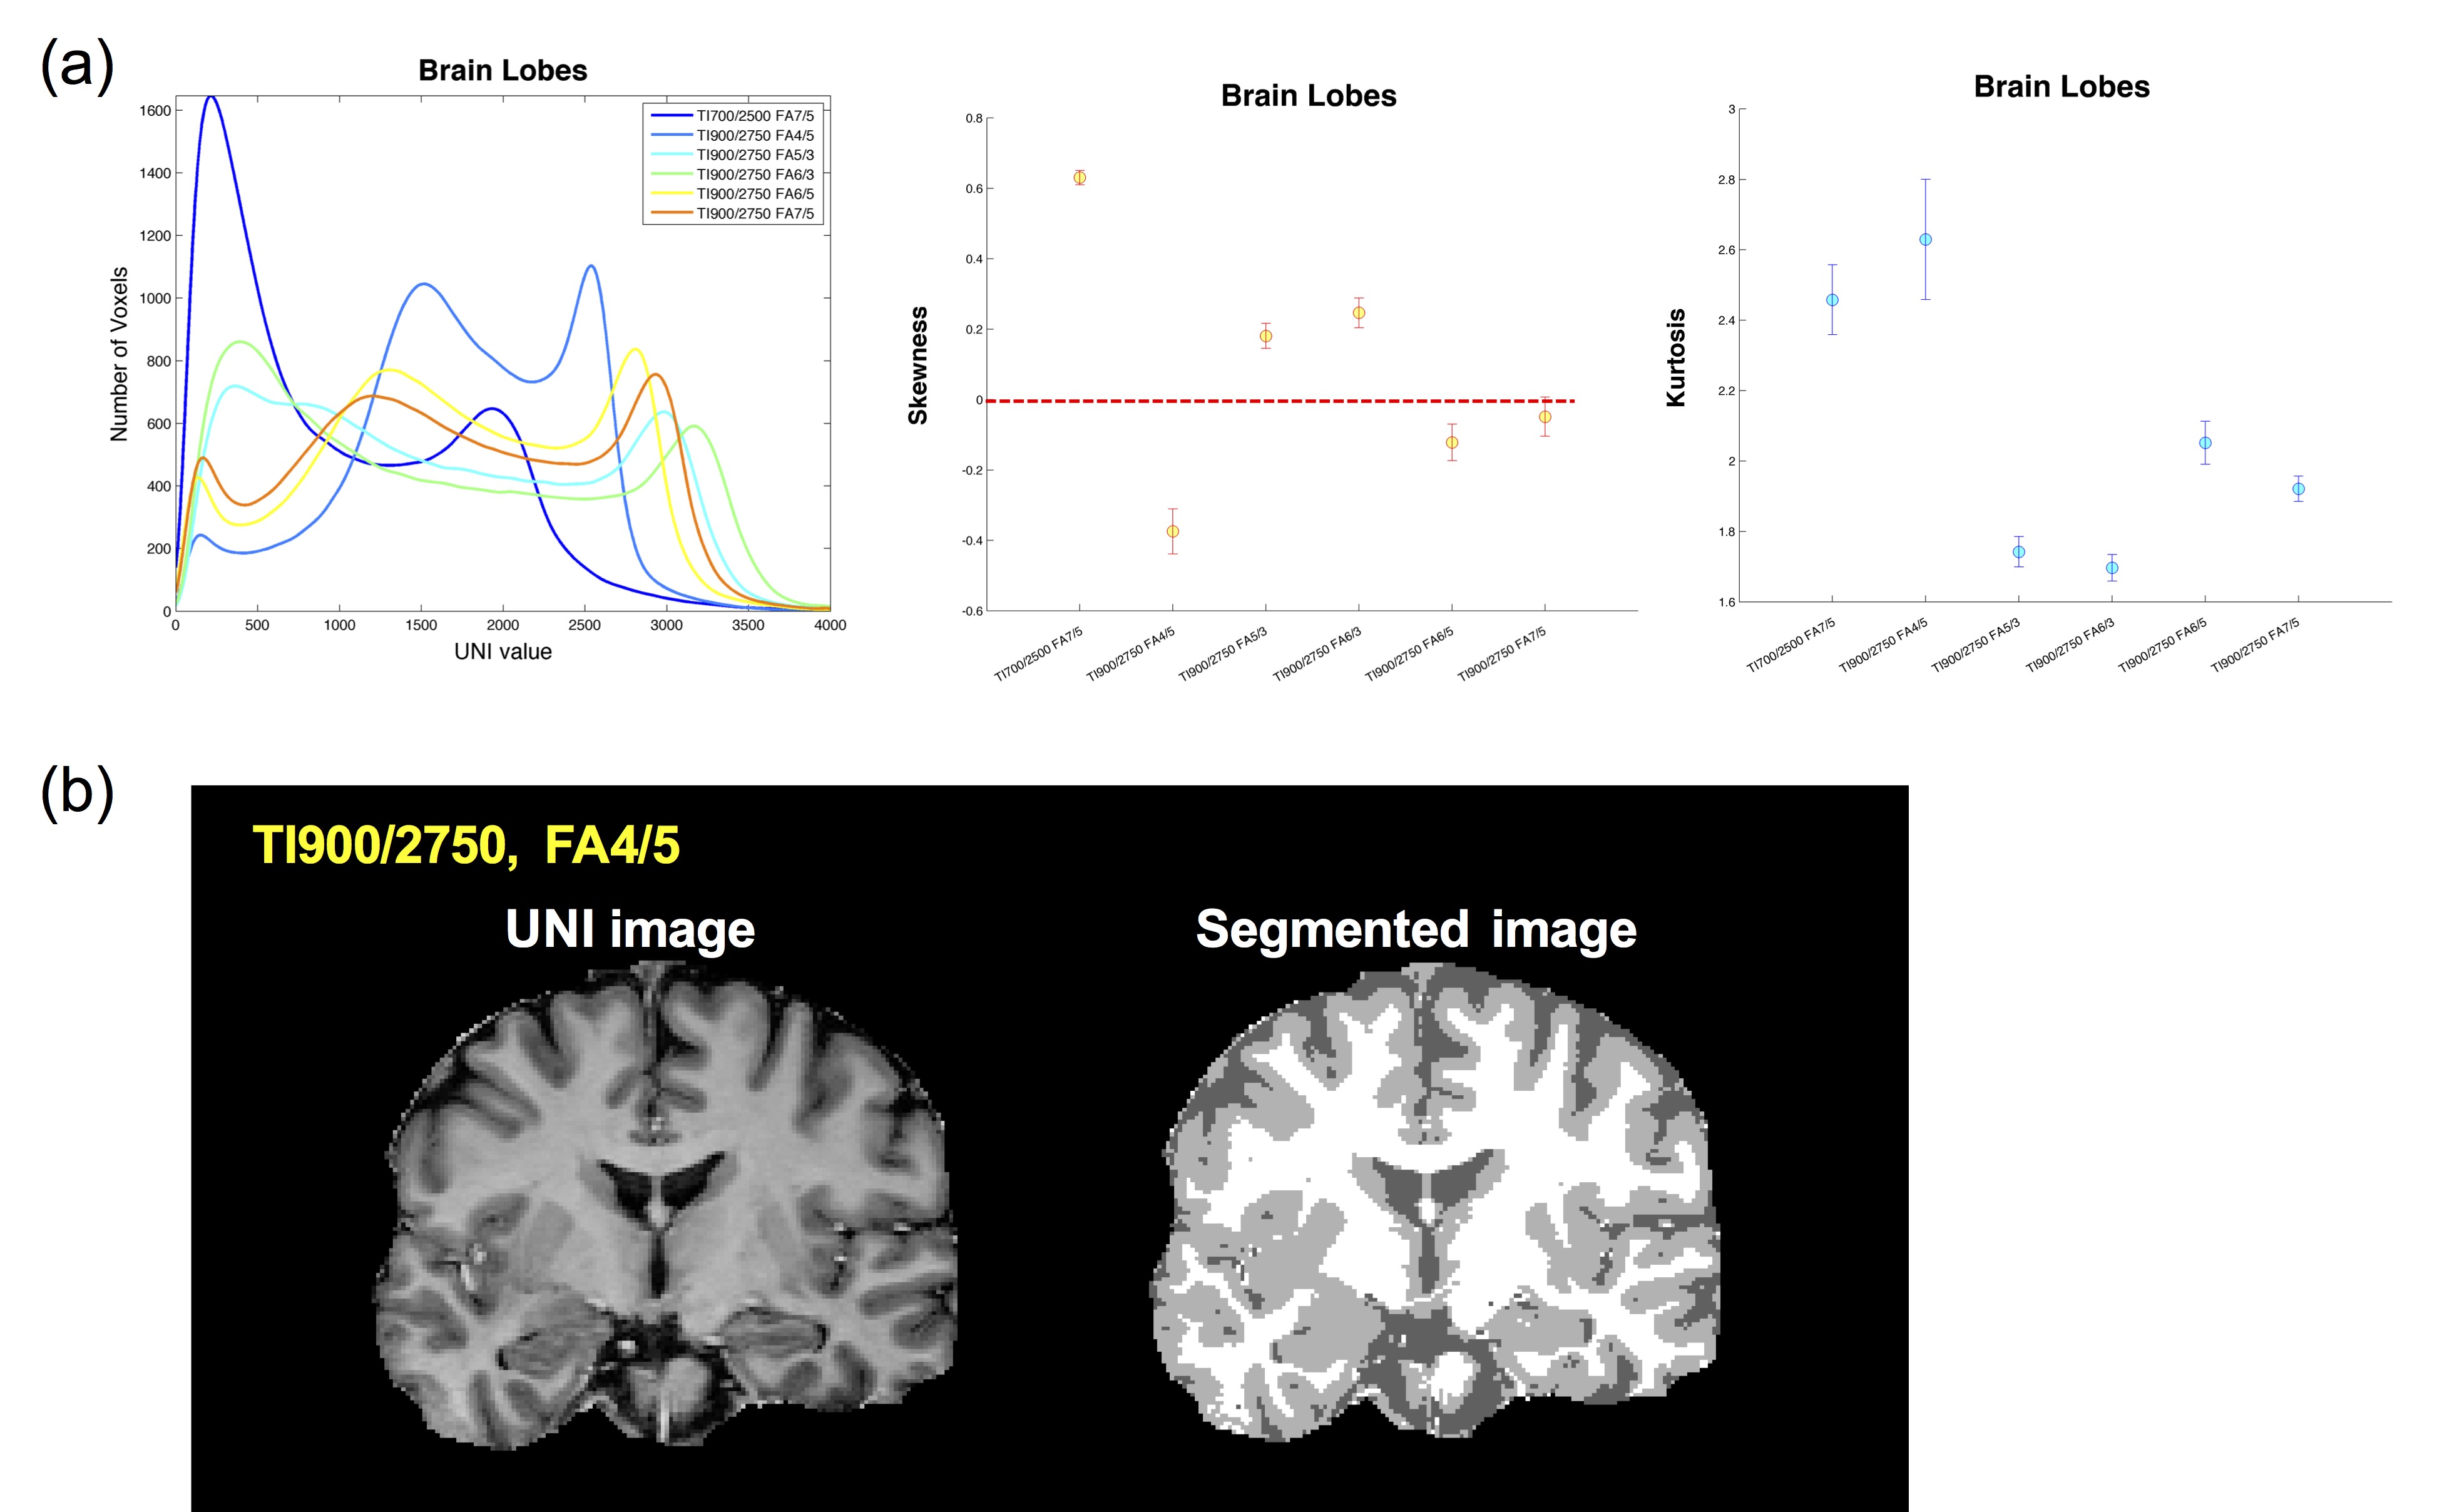
UNI image results: Intensity distribution in UNI images at FAs = 4/5, 6/5, and 7/5 only showed separated distribution shapes between CSF, GM, and WM (Fig. 1a). In addition, we calculated the skewness value and the kurtosis value, which indicates the shape of the peaks. The lowest negative skewness values and highest kurtosis values were found at TIs = 900/2750 and FAs = 4/5, which showed a sufficient segmentation of the three tissue types (Fig. 1b).
T1 image results: T1 images with different parameters showed different T1 value profiles for GM and WM. The peak T1 values at TIs = 900/2750 and FAs = 5/3 demonstrated the best agreement with those of previous studies 1.
FLAWS image results: A linear trend of skewness and kurtosis values according to FA changes was found, even though optimized parameters for FLAWS image were not defined in this study. Both skewness and kurtosis values decreased with increasing FAs at the same TIs. Decreasing skewness and kurtosis values suggest an increasingly right-sided proportion of distribution, which may reflect GM proportion. The image at TIs = 900/2750 and FAs = 7/5 only showed GM peaks in this result.
DISCUSSION
Our results showed very similar intensity distribution shapes of each parameter in all subjects. These results suggest that the distribution profiles of each parameter could be reproducible and reliable in our study. The parameters of this study have not been defined at random, but selected by previous studies that were optimized. However, the optimized parameters of each type of image from MP2RAGE sequences may be different. We found slightly different optimal parameters for UNI, T1, and FLAWS images. In case of UNI images, FAs = 4/5 represented the excellent separated tissue distribution than FAs = 5/3, although FAs = 5/3 showed the best agreement with previous T1 values and has been commonly used in previous studies 2,3. In case of FLAWS images, we found that there were decreasing trends in skewness and kurtosis values according to increasing FAs at same TIs. In addition, decreased TIs only showed GM peaks. These results suggest that decreased TIs and increased FAs should be applied for optimized FLAWS images compared with optimized parameters of UNI images.CONCLUSION
This study suggested that appropriate parameters should be applied to acquire optimized images using the MP2RAGE sequence. Furthermore, this study provided important clues for investigating optimized parameters of UNI, T1, and FLAWS images using MP2RAGE sequences on 7-T MRI.Acknowledgements
No acknowledgement found.References
1. Marques JP, Kober T, Krueger G, van der Zwaag W, Van de Moortele P-F, Gruetter R. MP2RAGE, a self bias-field corrected sequence for improved segmentation and T 1-mapping at high field. Neuroimage 2010;49:1271–1281.
2. Keuken MC, Forstmann BU. A probabilistic atlas of the basal ganglia using 7 T MRI. Data Brief 2015;4:577–582.
3. Tardif CL, Schäfer A, Waehnert M, Dinse J, Turner R, Bazin P-L. Multi-contrast multi-scale surface registration for improved alignment of cortical areas. NeuroImage 2015;111:107–122.
Figures