4240
Velocity Sensitivity of Inner-Volume Cardiac Echo Planar Imaging1Electrical Engineering, University of Southern California, Los Angeles, CA, United States, 2Biomedical Engineering, University of Southern California, Los Angeles, CA, United States
Synopsis
Inner volume echo planar imaging (IV-EPI) is feasible and useful for cardiac diffusion tensor imaging and arterial spin labelling . IV-EPI inherently provides velocity-selective saturation caused by the crusher gradients around the 180º refocusing-pulse. In this study, we characterize this velocity-dependent effect on myocardial signal in systolic and diastolic cardiac phases. We find that a simple velocity distribution model fits the data well, and that the data from our experiments allows us to make recommendation for designing gradients to avoid myocardial signal loss for diastolic and systolic IV-EPI imaging.
Introduction
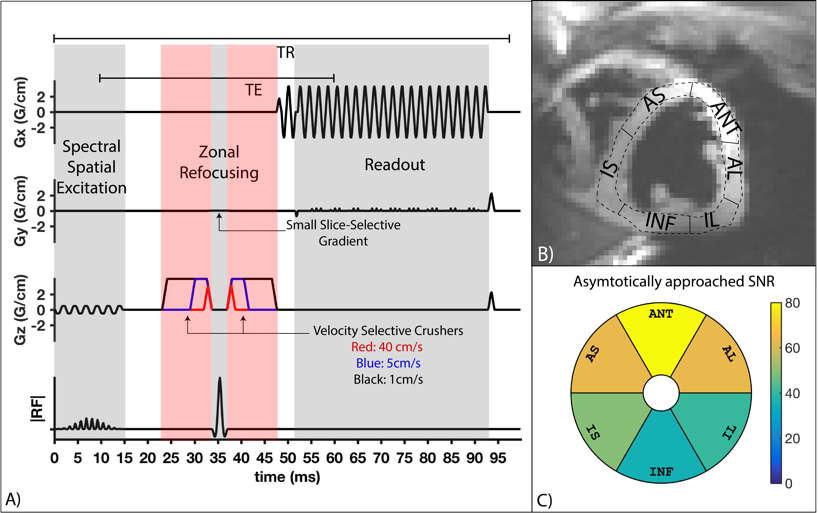
Myocardial tissue characterization often requires fast (a.k.a. “snapshot”) imaging of the heart. Candidate techniques include transient bSSFP or GRE, and single-shot spiral or echo-planar imaging. Recently, inner volume single-shot echo planar imaging (IV-EPI) has been demonstrated as feasible and useful for cardiac diffusion tensor imaging1 (DTI) and cardiac arterial spin labelling2 (ASL). It is capable of acquiring a single image in <70ms (well within a stable cardiac phase) and efficiently measures the prepared longitudinal magnetization or a stimulated echo. This study examines the velocity-selective saturation effects in IV-EPI caused by the crusher gradients around the 180º refocusing-pulse (see Fig. 2A). These provide the benefit of suppressing undesirable LV-blood pool signal that may cause partial-volume artifacts, but they can also reduce desirable myocardial signal. We experimentally characterize the myocardial signal loss in systolic and diastolic cardiac phases in human adult volunteers.Methods
Imaging: Three healthy subjects (2M/1F,Age: 23-26) were scanned on a GE 3T Signa HDxt scanner using single-shot partial-Fourier IV-EPI , shown in Fig. 2A; one subject was scanned twice on separate days, resulting in four datasets. The imaging sequence consisted of a 90º spectral-spatial excitation3, zonal refocusing to reduce FOVy4 and partial Fourier EPI (5/8th) to reduce the echo-time and readout duration. TE/TR/FA=51.3/95ms/90, matrix size=128x64, partial-fourier=5/8th , and readout time=40ms. TE was fixed at 51.3ms based on the largest crusher gradients shown in Fig. 2A.
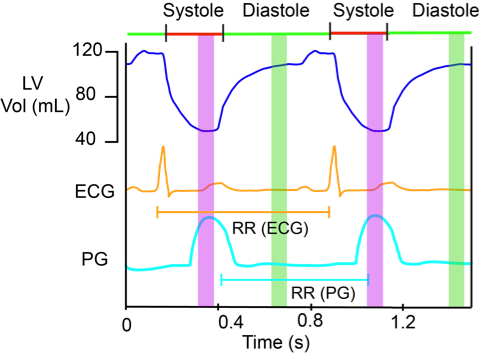
Experiment: A plethysmograph (PG) gated cine bSSFP scan was used to visually determine stable systolic and diastolic phases shown in Fig 1. Trigger-delays were set as ratios of the RR duration to place the imaging at the center of these periods. Eleven images were acquired for each of 14 kv values ( between 0.0125-0.5s/cm) during both systole and diastole, where kv= γAT, γ is the gyromagnetic-ratio, A is the area of each crusher gradient in Fig. 2A, and T is the separation between them.
Reconstruction: Ramp-sampled partial-Fourier EPI data was re-gridded and phase corrected using GE Orchestra then reconstructed using projection over convex sets5 (POCS). Data was then converted to SNR units for analysis6. Images for all kv were aligned using advanced normalization tools7 (ANTs). One image for each subject was manually segmented, with the ROI propagated to all aligned images. The myocardium was divided into 6 segments8 as shown in Fig. 2B and the data for each segment was fitted to the model of velocity-selective modulation of image signal9.
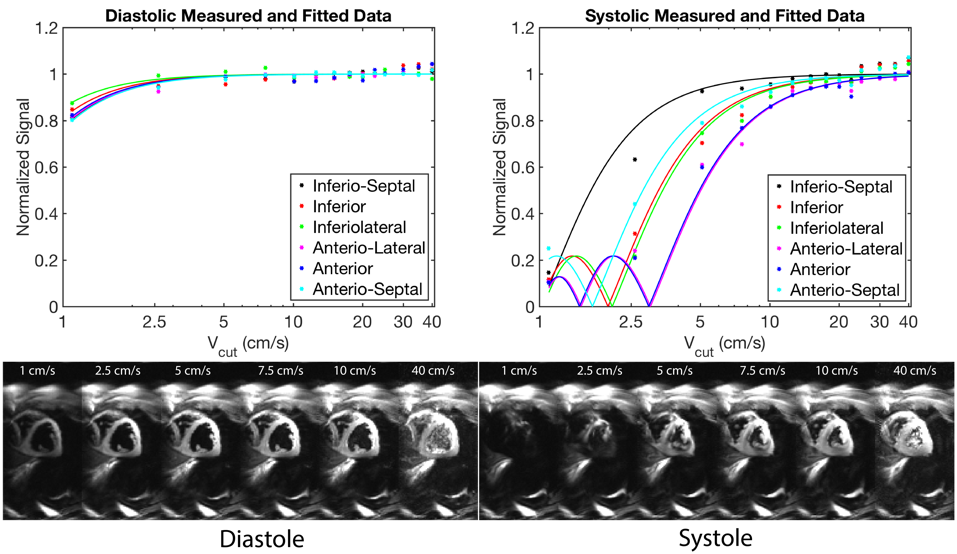
Modeling: The model used here was borrowed from velocity-selective arterial spin labeling literature9, originally developed for capillary blood flow. This assumes that the velocity of spins within a voxel is uniformly distributed from 0 to 2vz , where vz is the average longitudinal-velocity in cm/s . Using this model the velocity-selective modulation of signal amplitude in IV-EPI is given by: $$$S=\vert{M_osinc(2k_v v_z)}\vert$$$, where S is the measured signal, Mo is the scaling term in SNR units . The first zero-crossing of sinc is $$$V_{cut}=1/2k_v$$$ in cm/s and spins moving at velocities faster than Vcut are saturated. 14 Vcut values of 1.0-40cm/s (that correspond to kv values of 0.0125–0.5s/cm) were used for this experiment.
Results
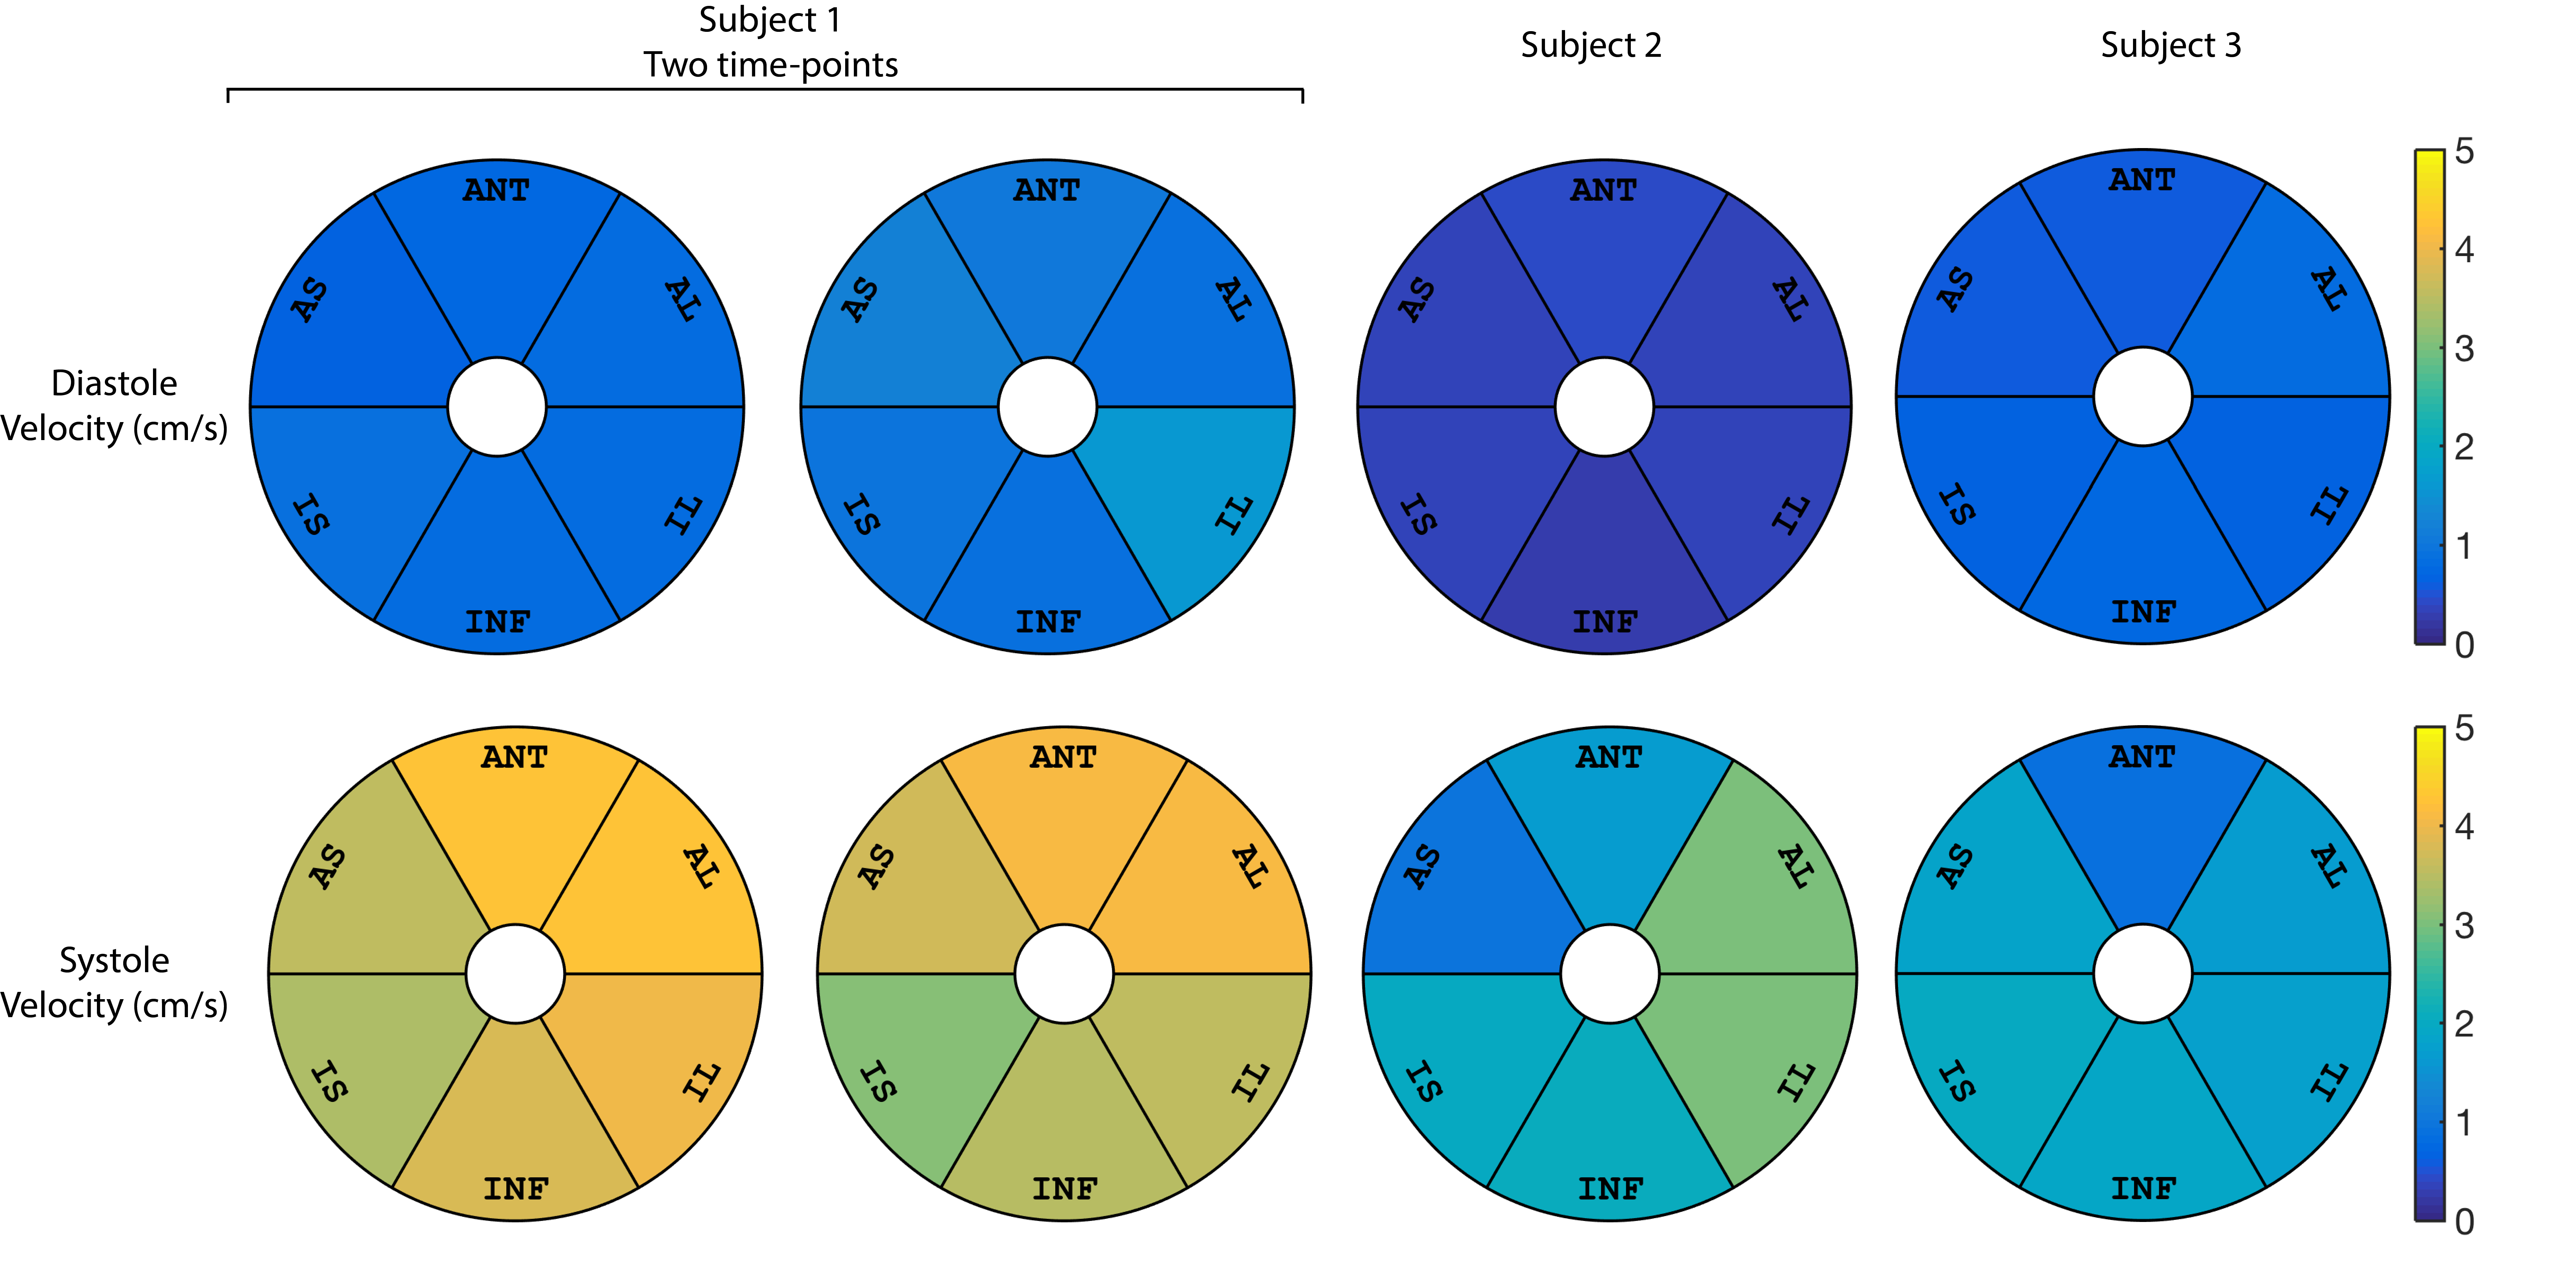
Results are shown in Figs. 3,4 and 5. The estimated average vz of the myocardium was 0.3-1.6cm/s during stable-diastole and 0.9–4.3cm/s during stable-systole. The residue for the fitting (not shown here) was uniform and low for both systole and diastole. Subject 1 had a higher HR of 70-85 (vs subject 2 and 3 with HR of 50-55 and 60-65) and had higher estimated diastolic and systolic velocities. The segment-by-segment variation in SNR was consistent between subjects and the average is shown in Fig. 2C.
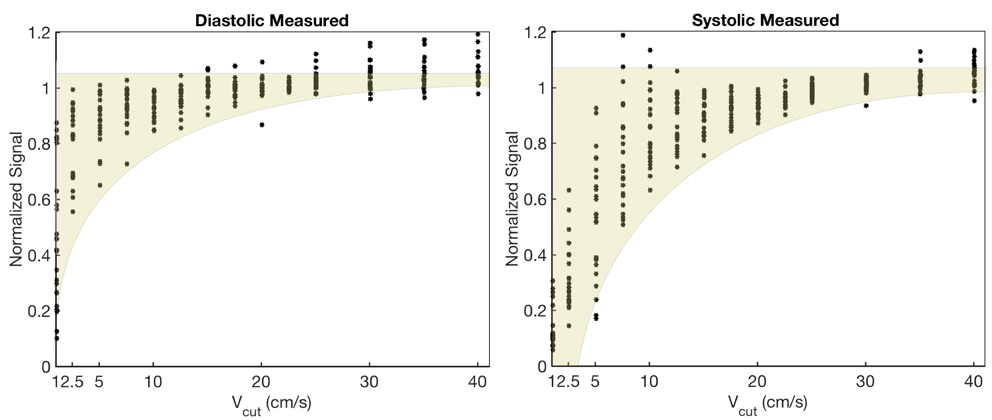
Fig. 4 contains representative images from Subject 2 and shows that the model fits the data well for both diastolic and systolic images. Fig. 5. shows a scatter plot of normalized signal from all segments and all subjects plotted. This can be used to infer the choice of Vcut that minimizes the myocardial velocity-saturation.
Conclusion
In order to minimize myocardial velocity saturation effects in IV-EPI and to suppress blood pool signal as much as possible, it is appropriate to design crusher gradients with a Vcut=15cm/s at stable-diastole or Vcut=25cm/s at stable-systole. This is because there was no detectable saturation of myocardium using the IV-EPI sequence for these and larger Vcut values based on Fig.5. This study also demonstrates the ability to experimentally characterize velocity saturation effects of IV-EPI, and supports use of a simple model originally developed for capillary blood flow. If the range of candidate Vcut were sampled much more finely, this experiment could inform the development of better models for myocardial longitudinal-velocity distribution.Acknowledgements
Funding NIH R01-HL130494References
1. Lau AZ, Tunnicliffe EM, Frost R, Koopmans PJ, Tyler DJ, Robson MD. Accelerated human cardiac diffusion tensor imaging using simultaneous multislice imaging. Magn. Reson. Med. 2014;73:995–1004
2. Javed A, Nayak K. Cardiac ASL using Single-Shot EPI at 3T. ISMRM 2017:3237
3. Schick F, Forster J, Machann J, Kuntz R, Claussen CD. Improved clinical echo-planar MRI using spatial-spectral excitation. J. Magn. Reson. Imaging [Internet] 1998;8:960–967.
4. Feinberg DA, Hoenninger JC, Crooks LE, Kaufman L, Watts JC, Arakawa M, Feinberg A, Crooks E, Watts C. Inner volume MR imaging: technical concepts and their application. Radiology 1985;156:743–747.
5. Haacke EM, Lindskogj ED, Lin W. A fast, iterative, partial-fourier technique capable of local phase recovery. J. Magn. Reson. 1991;92:126–145.
6. Kellman P, McVeigh ER. Image reconstruction in SNR units: A general method for SNR measurement. Magn. Reson. Med. 2005;54:1439–1447.
7. Avants B, Tustison N, Song G. Advanced normalization tools (ANTS). Insight J [Internet] 2009:1–35.
8. Cerqueira MD. Standardized Myocardial Segmentation and Nomenclature for Tomographic Imaging of the Heart. Child. A Glob. J. Child Res. 2003:1448–1453.
9. Wong EC, Cronin M, Wu W-C, Inglis B, Frank LR, Liu TT. Velocity-selective arterial spin labeling. Magn. Reson. Med. 2006;55:1334–1341.
10. Greaves K, Puranik R, O’Leary JJ, Celermajer DS. Myocardial tissue velocities in the normal left and right ventricle: relationships and predictors. Heart. Lung Circ. 2004;13:367–373.
11. Codreanu I, Robson MD, Golding SJ, Jung B a, Clarke K, Holloway CJ. Longitudinally and circumferentially directed movements of the left ventricle studied by cardiovascular magnetic resonance phase contrast velocity mapping. J. Cardiovasc. Magn. Reson. 2010;12:48.
Figures