4233
mGRE and TFE based cardiac SWI at 3.0 T1Philips Healthcare, Beijing, China
Synopsis
In this work, a 3.0 T multiple echo sequence was developed for cardiac scans, and a feasibility study was carried to assess whether susceptibility-weighted imaging (SWI) provides image contrast for the detection of myocardium disease. Currently collected images indicates that cardiac SWI at 3.0 T provides a prominent option for detecting myocardial abnormality, while further optimization to obtain sensitivity and accuracy is needed.
Purpose
Blood products within the haemorrhagic myocardium have different susceptibilities to adjacent tissue and their signal develops a phase accumulation as TE increases. Susceptibility-weighted imaging (SWI) finds magnetic susceptibility differences, based on phase difference between regions containing paramagnetic deoxygenated blood products and the surrounding tissue(1,2). Hence SWI enhances visibility of haemorrhagic ischaemiaereperfusion injury. Previously 1.5T SWI cardiac research has demonstrated the uplift in detecting myocardial haemorrhage as a marker of acute ischaemiaereperfusion haemorrhage (3). Another 3T research demonstrated detection of intramyocardial hemorrhage following acute myocardial infarction via SWI and T2 T2* (4).
This study is to assess susceptibility-weighted imaging (SWI) at 3.0 T in detecting myocardium diseases, and to find optimized strategy from multiple gradient-echo sequence and turbo gradient echo sequence.
Materials and Methods
2D cardiac SWI imaging methods were developed on a 3T unit (Ingenia, Philips, Best, the Netherland). The maximum gradient strength was 80mT/m and the maximum slew rate was 200mT/m/ms. The abdomen torso coil was used for signal acquisition. A cardiac SWI was based on black-blood inversion recovery multiple gradient-echo (mGRE) sequence. Compressed SENSE (compressed sensing combined with sensitivity unfolding acceleration) was applied for fast imaging. 8 echoes was designed to balance between short acquisition within single breath hold and enough echoes for SWI reconstruction. Both magnitude and phase image were acquired, within single breath-hold for each slice at short axis or 4 chamber view.
mGRE scan protocol was set as: TR=36ms; 8 echoes with fly back readouts TE1=1.94ms, echo spacing=1.8ms and BW at 1430Hz; flip angle 35 deg; SPAIR fat suppression, single heart phase and trigger delay at end diastole. Imaging acquisition matrix 168×143 with ACQ voxel size 1.8mm×2.1mm. Compress SENCE reduction factor at 8, and total acquisition time is 10 seconds.
The institutional review board approved this study. Volunteers and patients suspected with myocardium injuries and coronary artery disease underwent cardiac SWI. Volunteer images (male, mean age 31) shows good correlation of SWI contrast of cardiovascular system, as showed in fig 1. A patient (male, age 65) with coronary artery disease was scanned and a fatty content at the apical part of myocardium was found.
Blurring was observed in the mGRE SWI results, turbo gradient echo (TFE) option was tested alternatively to improve image contrasts. TFE sequence was set as: TR=16ms; TFE factor 7 with 14 shots, acquisition matrix 168×157 with compressed sense factor 2, ACQ voxel size 1.8mm×1.8mm with other parameters the same as mGRE.
The 2D high-pass filtered phase map (converted from SWIp in 3D imaging) was used to create masks for the SWI reconstructions. Susceptibility-Weighted image, phase image and T2* images were generated.
Results
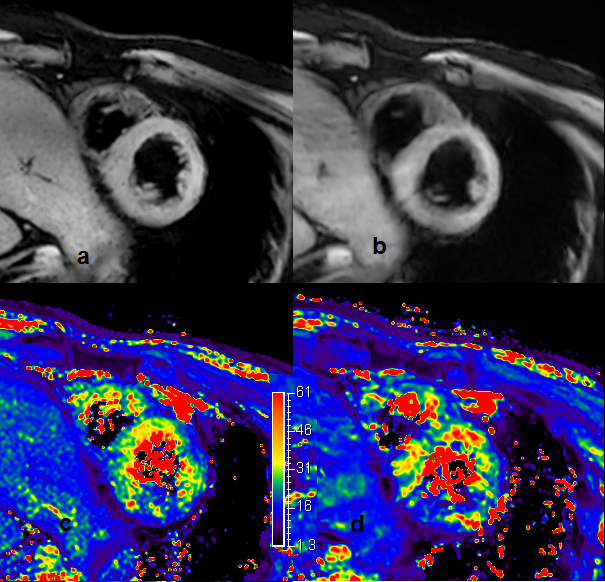
Figure 1 shows SWI images from volunteer in short axis. The mGRE based SWI (b) image resolution is lower and hence blur. There are a few dots on TSE based SWI images (a), which might indicate small blood vessels, but could cause false alarm. The T2* mapping from both technique are very similar (c. T2* from TFE; d. T2* from mGRE).
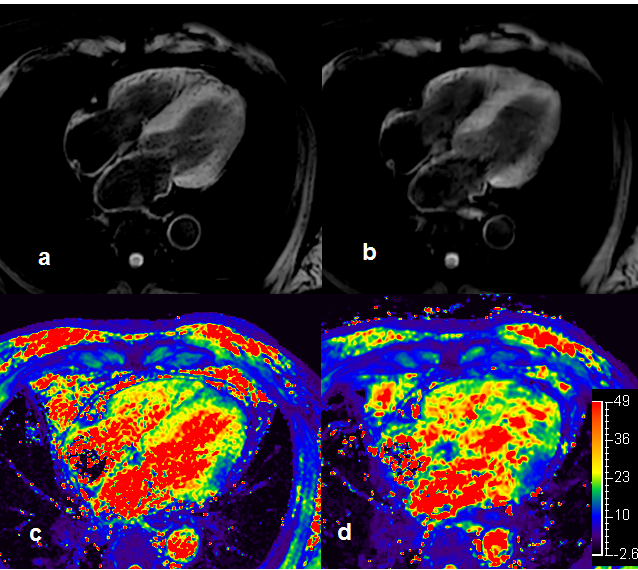
Figure2 shows the 4 chamber view SWI images for the same volunteer in short axis. There were too much dark spots in the TFE based SWI image. The mGRE seems give more reliable T2* mapping and SWI.
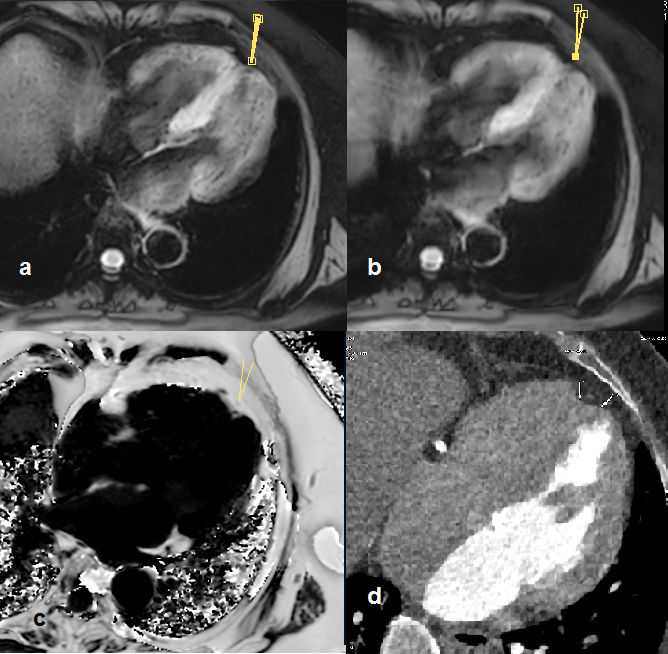
Figure 3 shows the SWI images (a. TFE; b. mGRE) for the patient with coronary artery disease. Abnormality was found at the apical region of myocardium. The size and scale in SWI indicate it a fatty tissue. Cardiac proton density fat fraction (PDFF) scan (c) and the CT angiography examined within a month reconstructed to the same slice (d).
The PDFF map and low intensity in CT image matches the abnormality in SWI and indicate it adipose tissue, which is an age related myocardium degeneration at apical region.
Conclusion and Discussion
In this preliminary study, newly designed cardiac SWI was demonstrated for detecting susceptibility abnormity. We find similar conclude that cardiac SWI has potential in detecting cardiovascular and myocardium diseases, and distinguish myocardial hemorrhage STEMI as indicated via studies (5-8).
It was noticed the multiple gradient echo based SWI have less resolution comparing to turbo gradient echo option, but turbo gradient echo appeared to be over sensitive similar to single gradient echo based SWI method and might cause false alarm. Sensitivity artifacts with reduced signal was observed in myocardium close to stomach in both cases.
Hereby a further improvement to balance between resolution and sensitivity, and to reduce sensitivity artifacts near air cavity in magnitude source image would be preferred. Currently more cases are recruited to further evaluate the limit of cardiac SWI methods.
Acknowledgements
1. Haacke EM, Xu Y, Cheng YC, et al. Susceptibility weighted imaging (SWI). Magn Reson Med 2004;52(3):612e8.
2. Sehgal V, Delproposto Z, Haacke EM, et al. Clinical applications of neuroimaging with susceptibility-weighted imaging. J Magn Reson Imaging 2005;22(4):439e50.
3. Durighel, et al. Acute myocardial infarction: susceptibilityweighted cardiac MRI for the detection of reperfusion haemorrhage at 1.5 T, Clinical Radiology 71 (2016) e150ee156
4. Kidambi A, et al. Susceptibility-weighted cardiovascular magnetic resonance in comparison to T2 and T2 star imaging for detection of intramyocardial hemorrhage following acute myocardial infarction at 3 Tesla, Journal of Cardiovascular Magnetic Resonance201416:86
5. Durighel G, Tokarczuk PF, Karsa A, Gordon F, Cook SA, O'Regan DP: Acute myocardial infarction: susceptibility-weighted cardiac MRI for the detection of reperfusion haemorrhage at 1.5 T. Clinical Radiology 2016, 71(3):e150-e156.
6. 2. Liu S, Xiu B, Liu J, Xue A, Tang Q, Shen Y, Xie J: Association of rs1122608 with Coronary Artery Disease and Lipid Profile: A Meta-analysis. Archives of Medical Research 2016, 47(4):315-320.
7. 3. Moreira LB, Castro ÍB, Hortellani MA, Sasaki ST, Taniguchi S, Petti MAV, Fillmann G, Sarkis JES, Bícego MC, Costa-Lotufo LV et al: Effects of harbor activities on sediment quality in a semi-arid region in Brazil. Ecotoxicology and Environmental Safety 2017, 135(Supplement C):137-151.
References
No reference found.Figures