4230
A Gradient Spoiled Spin-Echo Sequence for Simultaneously Measuring B1+, B0, T1, T2, T2*, and Velocity of a Two-Dimensional Slice1Electrical Engineering, Stanford University, Stanford, CA, United States, 2Electrical Engineering, Stanford University, Stanford University, CA, United States
Synopsis
A single sequence is presented that quantifies several parameters simultaneously of a two-dimensional slice.
Introduction
The Saturated Double Angle Method (SDAM) of B1+ mapping [1] is an efficient method for making a B1 map of a volume. A non-selective B1-insensitive adiabatic saturation pulse is followed by some time for recovery before an imaging RF pulse is emitted. The sequence is repeated for two different RF pulses ($$$60^\circ$$$ and $$$120^\circ$$$) from which the Double Angle Method of B1 mapping can be performed [. After the saturation recovery time of approximately $$$400$$$ ms, DAM is performed on a volume one slice at a time (with a minor amount of difference in the magnetization recovery of each slice).In this paper, we show how to modify SDAM when imaging one slice to simultaneously perform B1+ and B0 mapping; T1, T2, and T2$$$^\ast$$$ quantification; and velocity encoding.
Methods
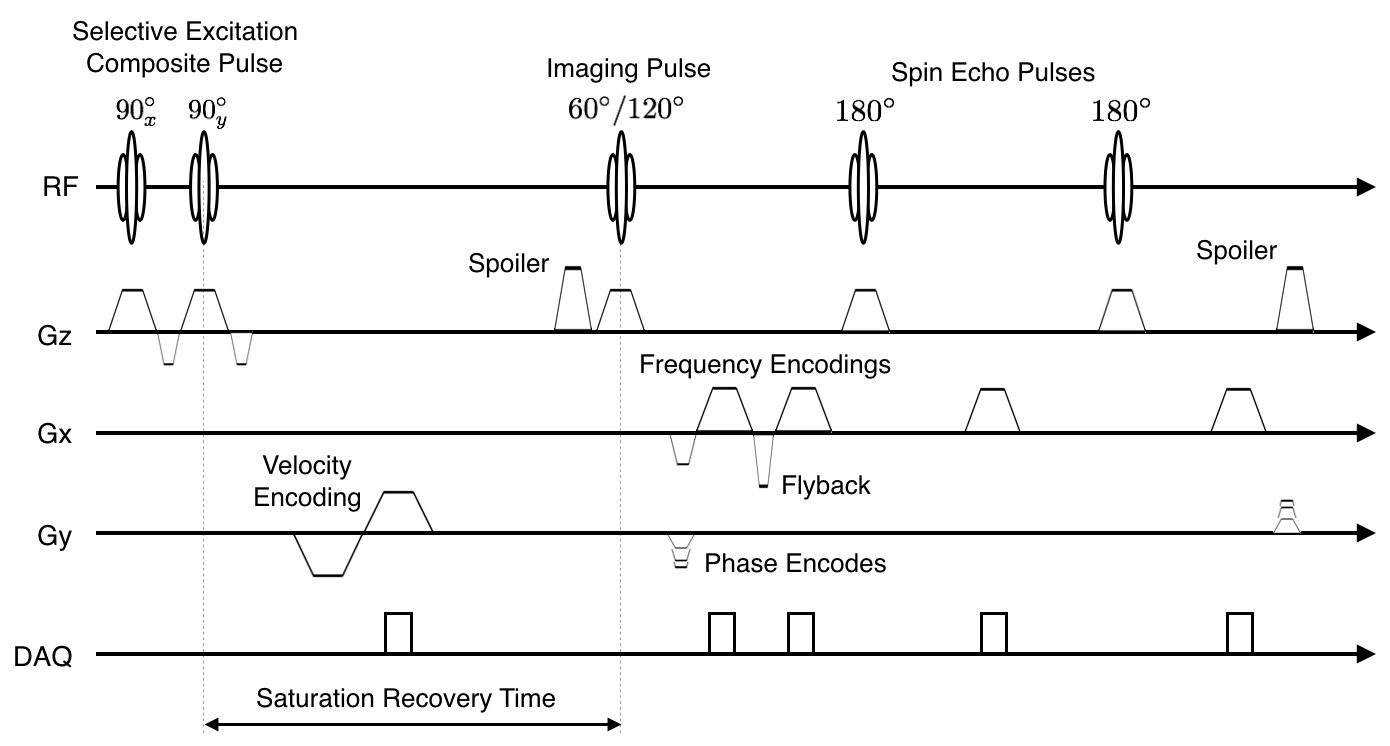
Though the saturation pulse is followed by a $$$400$$$ ms time period with SDAM, the efficiency is increased greatly by sequentially performing DAM on many slices. However, if one were to perform SDAM on a single two-dimensional slice, there there would be a great deal of time where nothing happens. Our approach is to take advantage of this time and incorporate standard techniques to extract significantly more information.We perform B1 mapping using SDAM. Rather than acquiring once after the $$$60/120^\circ$$$ RF pulses, we acquire data a second acquisition with flyback separated by some small amount of time (approximately $$$4$$$ms). By reconstructing both images associated with the two data acquisitions and measuring the phase difference between each voxel, we can create a B0 map [3]. By fitting an exponential decay to the magnitudes of the two images, we are able to quantify T2$$$^\ast$$$. Once T2$$$^\ast$$$ is known, we can extrapolate to determine the magnitude of the magnetization prior to the imaging RF pulse. By assuming the magnetization was saturated with the composite pulse, we are able to use this magnitude to quantify T1. After the second acquisition, we emit two spatially selective $$$180^\circ$$$ RF pulses and measure the spin echoes associated with each RF pulse. By fitting an exponential decay to the magnitudes of the spin echoes, we are able to quantify T2. Since all of this is done for both the $$$60^\circ$$$ and $$$120^\circ$$$ pulses, we are able to average both results to increase the SNR by a factor of $$$\sqrt{2}$$$.Instead of the non-selective adiabatic saturation pulse used by SDAM, we use a selective $$$90_x-90_y$$$ composite pulse. We use this time to conduct a velocity encoding gradient waveform. The saturation pulses associated with the $$$60/120^\circ$$$ imaging pulses are followed a horizontal/vertical velocity encoding gradient, respectively.
The complete sequence diagram for the Multi-Map sequence is shown in figure 3.
Results and Conclusion
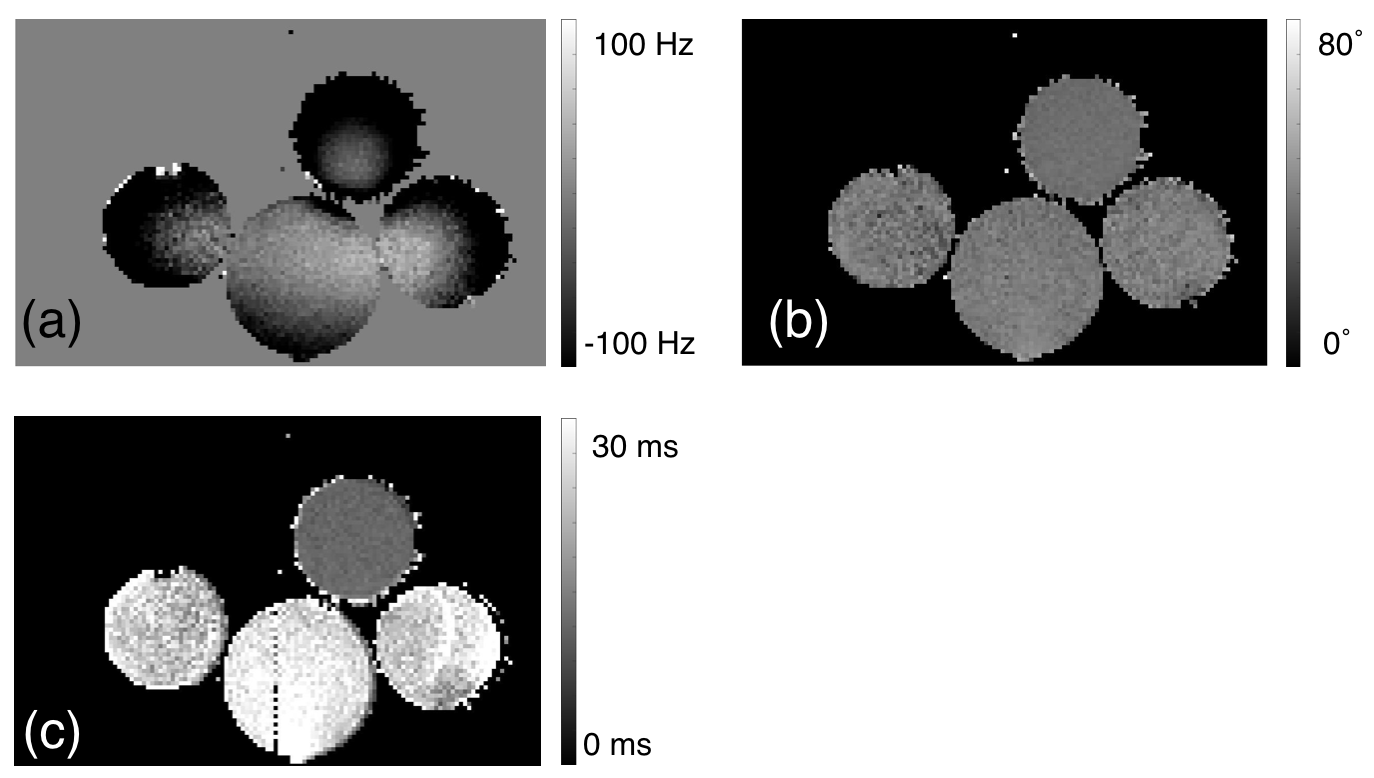
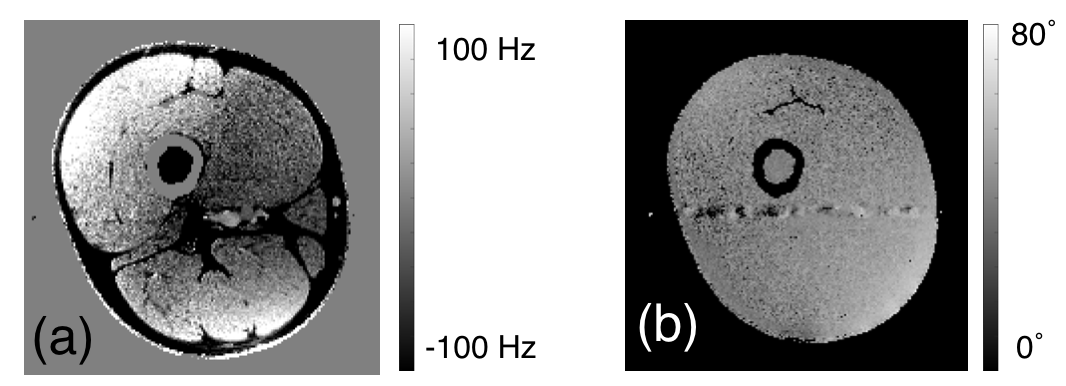
Results are shown for bottles containing Manganese Chloride and Nickel Chloride mixed with water in figure 1. The solution concentration vas varied to create different T1, T2, and T2*. Results are show for an axial slice of a human thigh in figure 2. The results indicate the utility of this sequence to gather several different quantities simultaneously.Acknowledgements
No acknowledgement found.References
[1] Charles H Cunningham, John M Pauly, and Krishna S Nayak. Saturated double-angle method for rapid B1+ mapping. Magnetic Resonance in Medicine, 55(6):1326–1333, 2006.
[2] EK Insko and L Bolinger. Mapping of the radiofrequency field. Journal of Magnetic Resonance, Series A,103(1):82–85, 1993.
[3] Krishna Nayak and Dwight G Nishimura. Automatic field map generation and off-resonance correction for projection reconstruction imaging. Magnetic resonance in medicine, 43(1):151–154, 2000.
Figures