4223
In-vivo water T2 mapping in tissues containing water and fat using a T2-prepared 3D Dixon TSE sequence and a pre-calibrated fat spectrum model1Department of Diagnostic and Interventional Radiology, Technical University of Munich, Munich, Germany, 2Department of Diagnostic and Interventional of Neuroradiology, Technical University of Munich, Munich, Germany, 3Philips Healthcare, Hamburg, Germany
Synopsis
Water T2 is seen as a potential biomarker for brown adipose tissue presence and as a marker of disease activity in patients with neuromuscular disorders. Measuring water T2 in tissues containing water and fat is challenging due to the need to separate the effects of water and fat during T2 quantification. The present work proposes an adiabatic T2 prepared 3D TSE Dixon sequence in combination with a novel DIXON water-fat decomposition method and demonstrates in vivo its feasibility to measure water T2 of brown adipose tissue in the supraclavicular fossa.
Purpose
Water T2 (T2W) mapping in fatty tissues has various applications including measuring T2W as a marker of brown adipose tissue (BAT) presence1 or as a biomarker of disease activity in fatty infiltrated skeletal muscles of patients with neuromuscular disorders2-4. Measuring T2W in fatty tissues is challenging due to the need to separate the effects of water and fat. Fat suppression relying on chemical shift is not effective due to the multi-peak nature of fat and fat suppression relying on T1 is not effective due to relaxation time differences of fat peaks5. T2W quantification is possible with MRS but lacks high spatial resolution. Imaging techniques combining 2D-MESE data with a multi-exponential T2 decay model6,7 have already been proposed to remove the effect of fat. The present work proposes an alternative approach applying an adiabatic T2 prepared 3D-TSE Dixon sequence combined with a novel Dixon decomposition that takes into account the individual T2-weighting of the fat peaks. The developed methodology was validated in simulations as well as phantom experiments and the in vivo feasibility was shown in the heterogeneous brown adipose tissue of the supraclavicular fossa in the challenging head-neck region.Methods
Pulse sequence:
The T2Prep module consisted of an adiabatic BIR4 RF-pulse that was previously applied to measure skeletal muscle T28,9. Different T2-weightings were achieved by changing the RF-pulse duration. The module was combined with a STEAM-MRS and a 3-point Dixon TSE readout (Figure 1).
Signal model, processing of MRS data and modified DIXON reconstruction:
The standard water-fat signal model including M fat peaks, a field map fB and common water and fat T2*, was extended by T2W and T2 of fat (T2Fα)10. The resulting signal is:
$$ S(TE_{Prep},\Delta{}TE)=\left(W{}e^{-\frac{{TE}_{Prep}}{T2_{W}}}+\sum_{k=1}^{M}\alpha_k{}F{}e^{-\frac{{TE}_{Prep}}{T2_{F\alpha}}}{}e^{-2{}\pi{}\ast{}\sigma_k{}\ast{}\Delta{}TE{}}{}\right){}e^{2{}\pi{}\ast f_B{}\ast{}\Delta TE{}}{}e^{-\frac{\Delta{}TE}{T2^\ast}} $$
T2* decay can be neglected in the TSE readout. The T2-weighted fat peak amplitudes ($$$\alpha_k{}F{}\exp(-{TE_{Prep}}/{T2_{F\alpha}})$$$) and chemical shifts ($$$\sigma_k$$$) are acquired by a T2Prep MRS sequence and called calibration spectra. The MRS-spectra processing included zero order phasing, Gaussian apodization, frequency alignment and peak area quantification considering eight fat peaks11. The extracted T2-weighted peak amplitudes and locations were given as an input in the subsequent Dixon decomposition based on a multiseed region-growing water-fat separation12 separately performed for each T2-weighting. T2W maps were calculated voxel-by-voxel based on T2-weighted water images. Figure 2 shows the processing scheme.
Simulations:
Bloch simulations (Figure 3) were performed to investigate the dependency of the T2Prep module on B1/B0 variations with nominal B1:13.5µT and T1/T2:1050/30ms.
Phantom and in vivo measurements:
All scans were performed on a 3T scanner (Ingenia, Philips, Best, The Netherlands). In the 3-point Dixon TEs of -0.2/0.6/1.4ms were applied. Agar based water-fat phantoms13 with nominal fat fractions of 0/5/10/15/100% were scanned using an 8-channel extremity coil with following parameter: 2D-TSE single-slice acquisition, in-plane resolution:2.2×2.2mm2, FOV:140×140×10mm3, TR:2000ms, TSE-factor:15 and echo spacing:7.1ms. STEAM-TE-series were acquired in water-containing phantoms with TR/TM:5000/16ms and TE:10/20/30/40ms. A healthy volunteer’s (female/23y) head-neck region was scanned with a 16-channel anterior, a 12-channel posterior and a 16-channel head coil. Sequence parameters: 3D TSE acquisition, resolution:1.75×1.75×3.5mm3, FOV:420×120×35mm3, TR:1500ms, TSE-factor:20, echo spacing:7.4ms and scan duration:9:32min. Cardiac triggered STEAM-TE-series were acquired in the supraclavicular fossa with TR/TM:4500/16ms and TE:13/19/25ms. Calibration spectra were acquired with matching TEs and T2Prep durations in the 100% fat phantom and subcutaneous fat.
Results
Figure 3 shows that the simulated relative T2 error stays within 10% down to 75% of the nominal B1 and |ΔB0|≤±440Hz resulting in a T2 mapping bandwidth close to 900Hz. In Figure 4 T2-weighted water images decomposed based on a predefined spectrum and the calibration spectra as well as the T2W maps are shown. When using a predefined spectrum errors in the water-fat decomposition and noisy T2W maps with elevated values are observed. This effect is removed when calibration spectra are used. T2W values obtained by the proposed sequence were positively correlated with the MRS T2W values (R/p=0.98/0.02). In Figure 5 the in vivo T2W map and TE-MRS spectra acquired in the BAT depot of the supraclavicular fossa are shown. Mean T2W values measured from imaging and spectroscopy agree within a relative error of 16%.Discussion and Conclusion
The presented methodology shows accurate T2W quantification over a large range of B0 and B1 values in simulations and good agreement with MRS in phantom experiments. The 3D-TSE readout enables high-resolution T2W mapping in fatty tissue and the acquired spatially resolved T2W maps have the potential to be used to evaluate BAT presence in the highly heterogeneous tissue in the supraclavicular fossa. It is planned to evaluate the reproducibility of the proposed T2W quantification in BAT as well as the applicability in measuring T2W in patients with neuromuscular diseases.Acknowledgements
The present work was supported by the European Research Council (grant agreement No 677661, ProFatMRI) and Philips Healthcare.References
1 Ouwerkerk R, et al., Proceedings ISMRM
2017,p 3436
2 Carlier PG, et al., J Neuromuscul Dis.
3(1):1-28, 2016
3 Carlier PG, et al., J Inherit Metab Dis.
38(3):565-72, 2015
4 Mankodi A et al., Neuromuscul Disord
27(8):705-714, 2017
5 Hamilton G. et al, J Magn Reson Imaging;
34(2): 468-473, 2011
6 Azzabou N, et al., J Magn Reson Imaging
41(3):645-53, 2015
7 Marty B, et al., NMR
Biomed. 29: 431–443, 2016
8 Klupp et al., PLOS ONE 12(2): e0171337,
2017
9 Weidlich et al., NMR in Biomed. 30:e377,
2017
10 Yu H, et al., Magn Reson Med.
60:1122-1134, 2008
11 Ruschke et al., Magn. Reson. Med. 75:
32–41, 2016
12 Berglund et al., Magn Reson Med.
63(6):1659-68, 2010
13 Hines C, et al., Magn Reson Med.
30:1215–1222, 2009
Figures
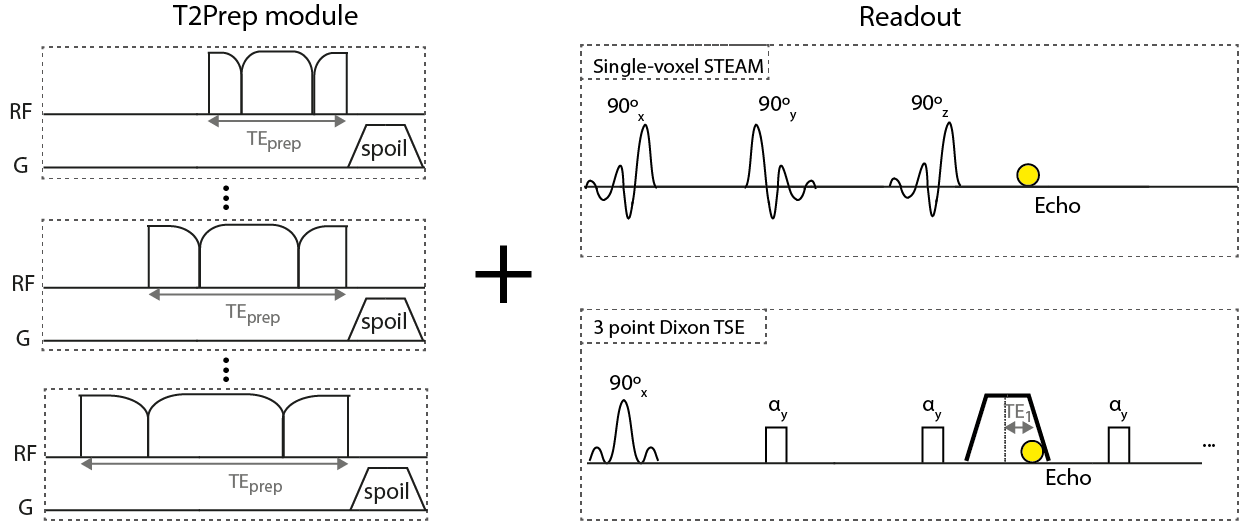
Figure 1:
Sequence diagram: T2Prep modules with varying durations of the BIR4 RF-pulse are combined with a single-voxel STEAM-MRS in order to measure the T2-weighted relative fat peak amplitudes and chemical shifts of the calibration spectra and with a 3-point Dixon TSE readout. In the Dixon TSE constant flip angles of 50° and 1 start-up echo are used. Only the first acquired echo time (TE1) is shown and slice selective gradients are not shown in the readouts. BIR4 pulse duration for the simulations as well as the MR measurements were 10/20/30ms (equal to effective T2-weightings of: 6.8/13.6/20.4ms).
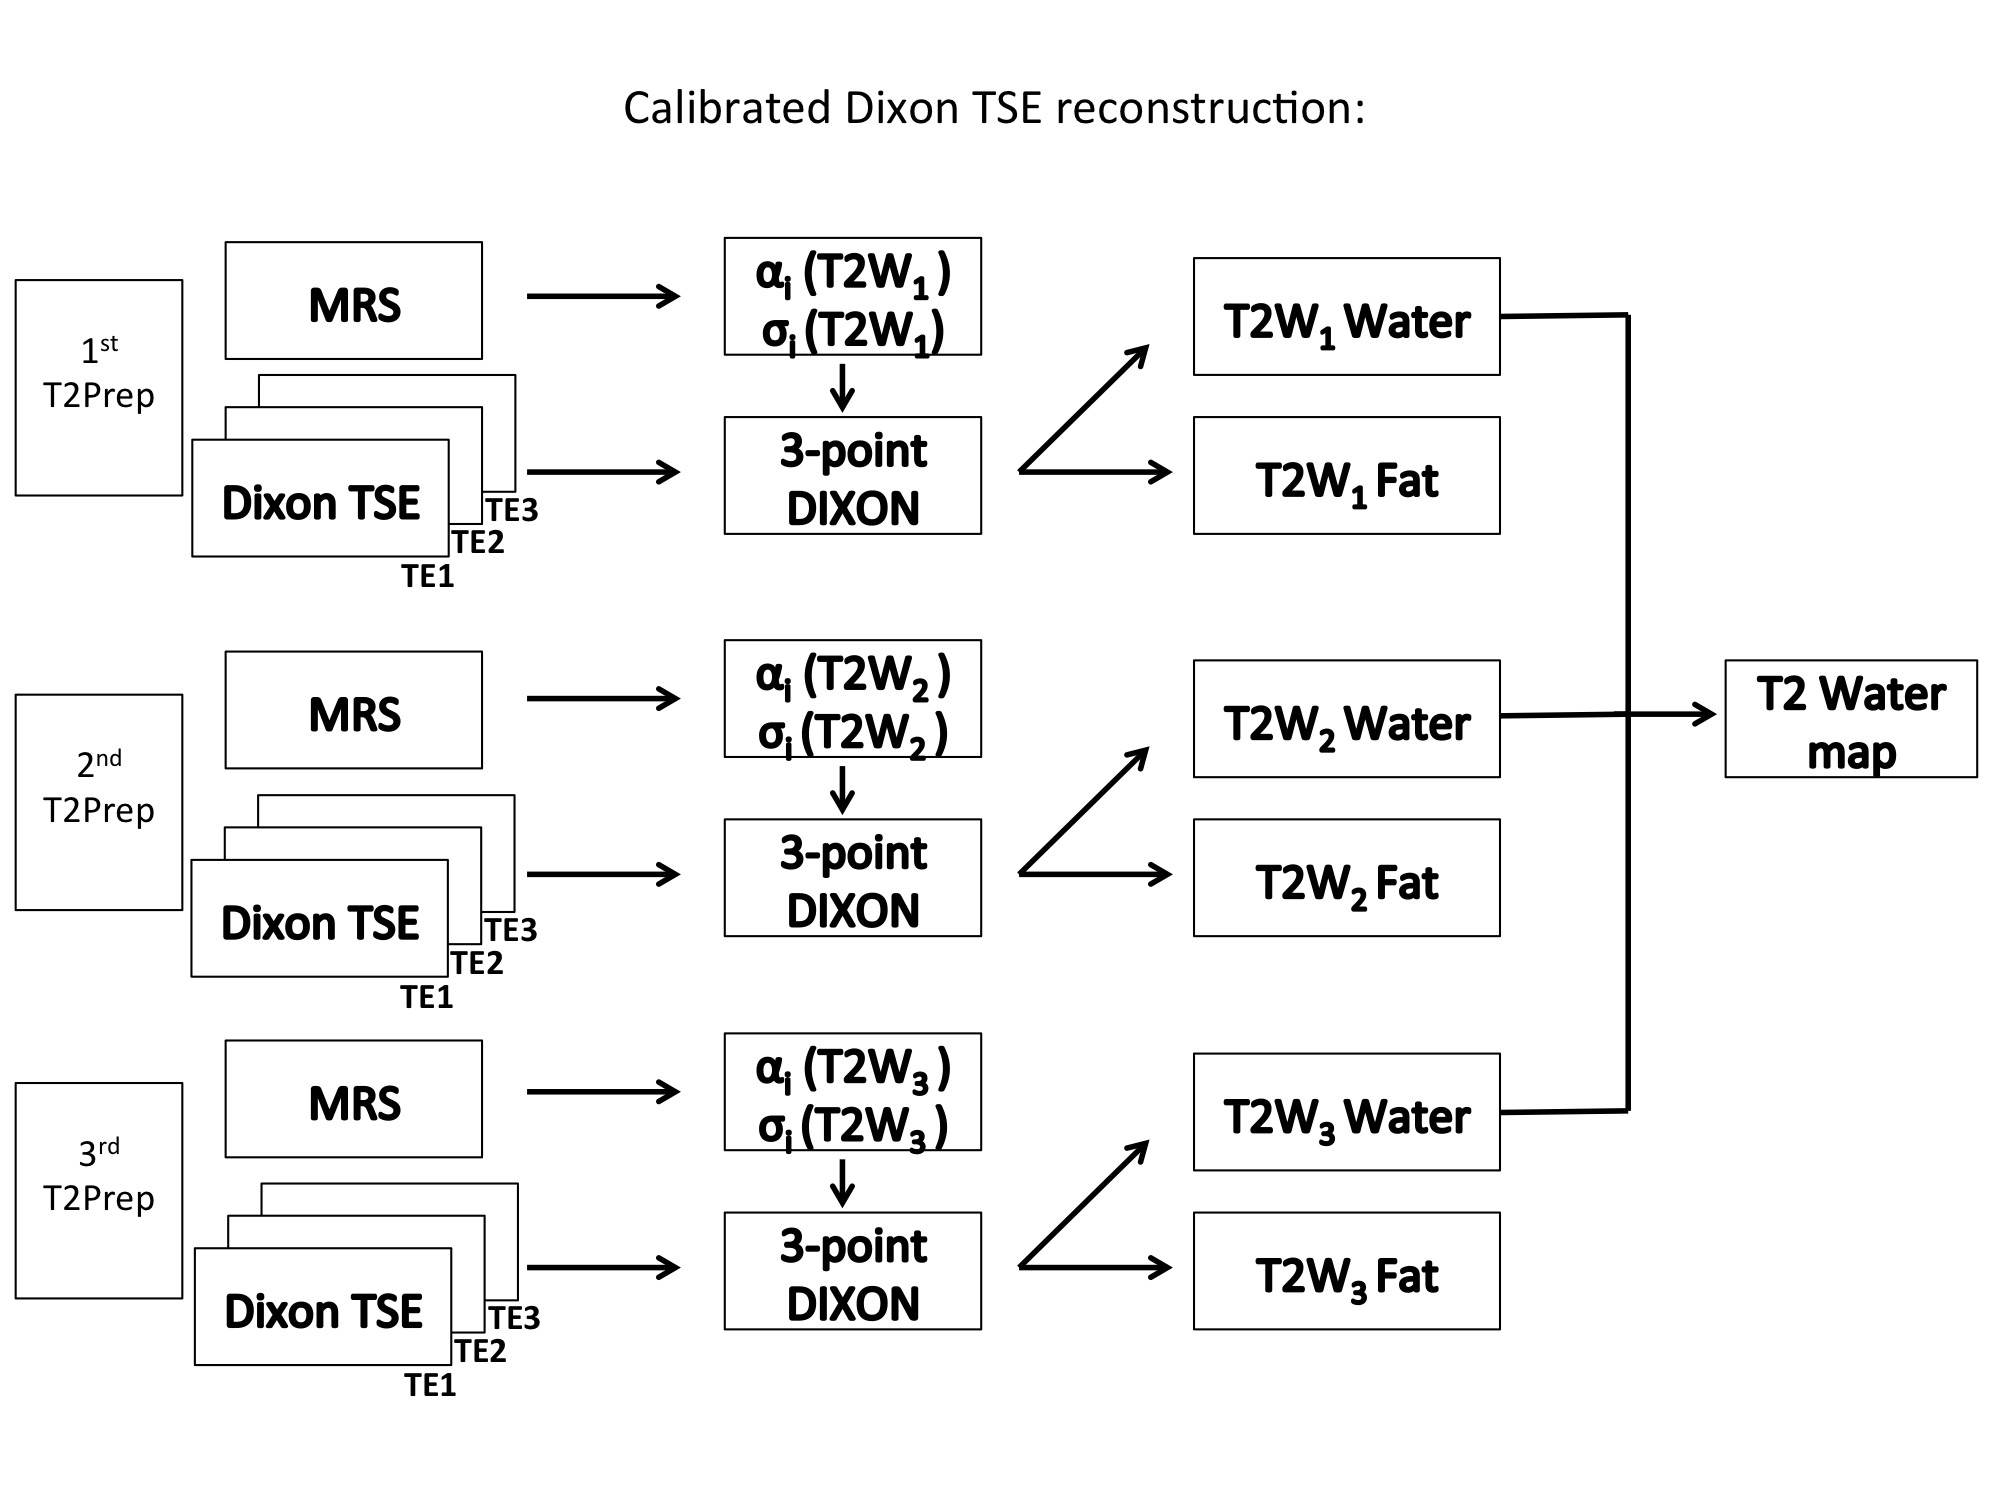
Figure 2:
Calibrated Dixon TSE reconstruction: Every T2-weighting is combined with a MRS and Dixon TSE readout. Relative T2-weighted fat peak amplitudes and peak locations are extracted for each T2 preparation and given as an input to the 3-point water-fat Dixon reconstruction. The obtained T2-weighted water images are subsequently fitted on a voxel-by-voxel basis to obtain T2W maps.
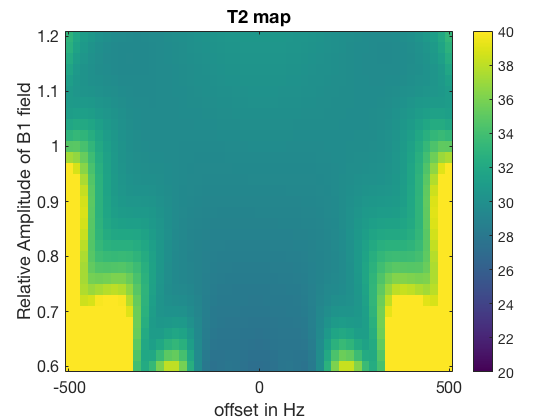
Figure 3:
Simulated T2 map: The sensitivity of the applied T2 preparation module for different B0 and B1 errors was simulated. For a relative B1 of 75% of the nominal B1 field an approximate bandwidth for T2 mapping close to 900 Hz was observed.
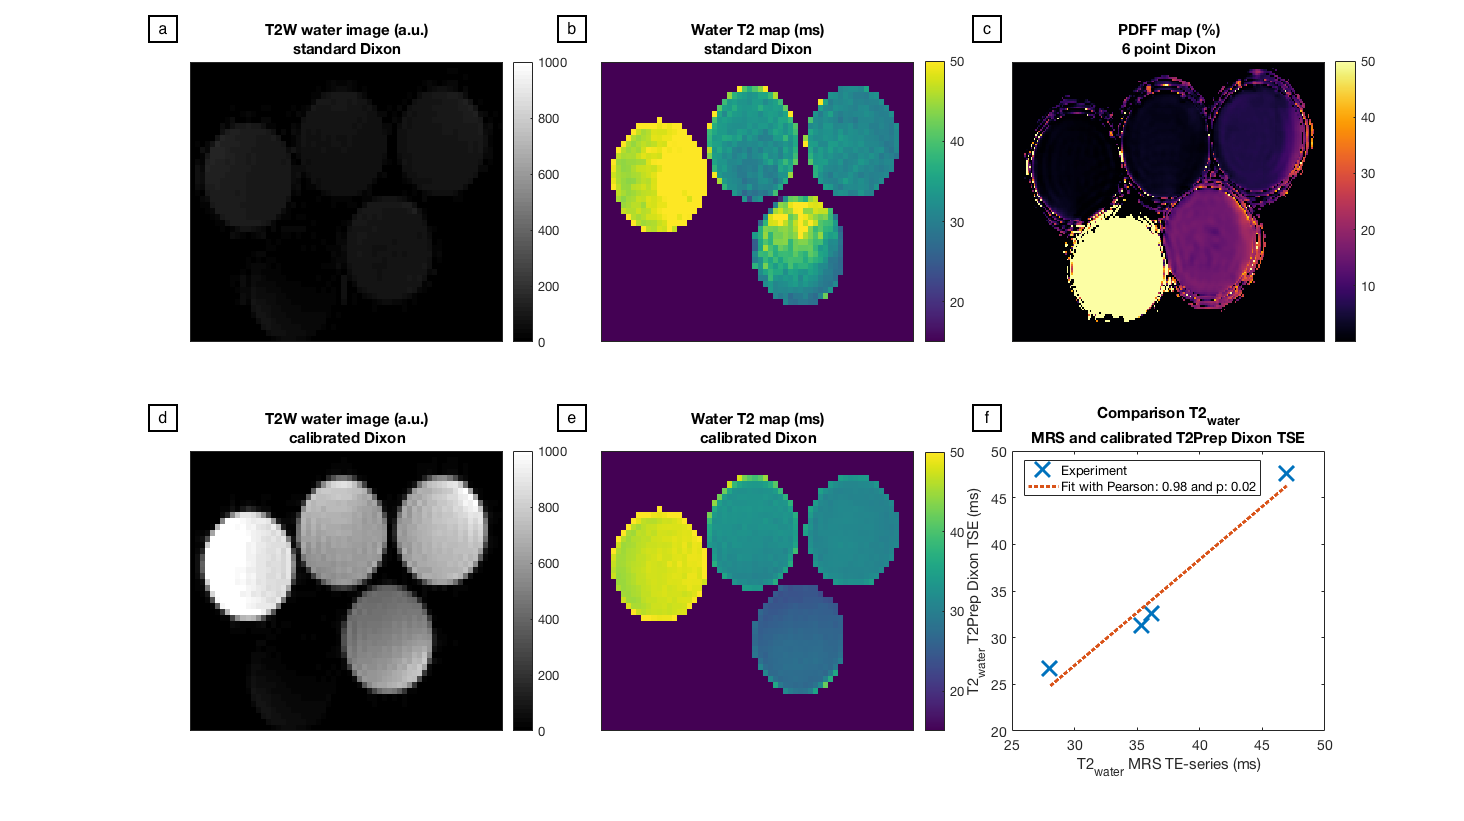
Figure 4:
Phantom experiments: (a) and (d) T2-weighted water image and (b) and (e) obtained T2W maps for a Dixon decomposition with a predefined spectrum or with the acquired calibration spectra. (c) shows a PDFF map and (f) the correlation of the T2W values obtained by the proposed sequence and MRS with a positive and significant correlation of the two methods. (a) shows errors in the water-fat decomposition and (b) noisy T2W maps. Both effects are removed by the usage of the calibration spectra for the Dixon algorithm.
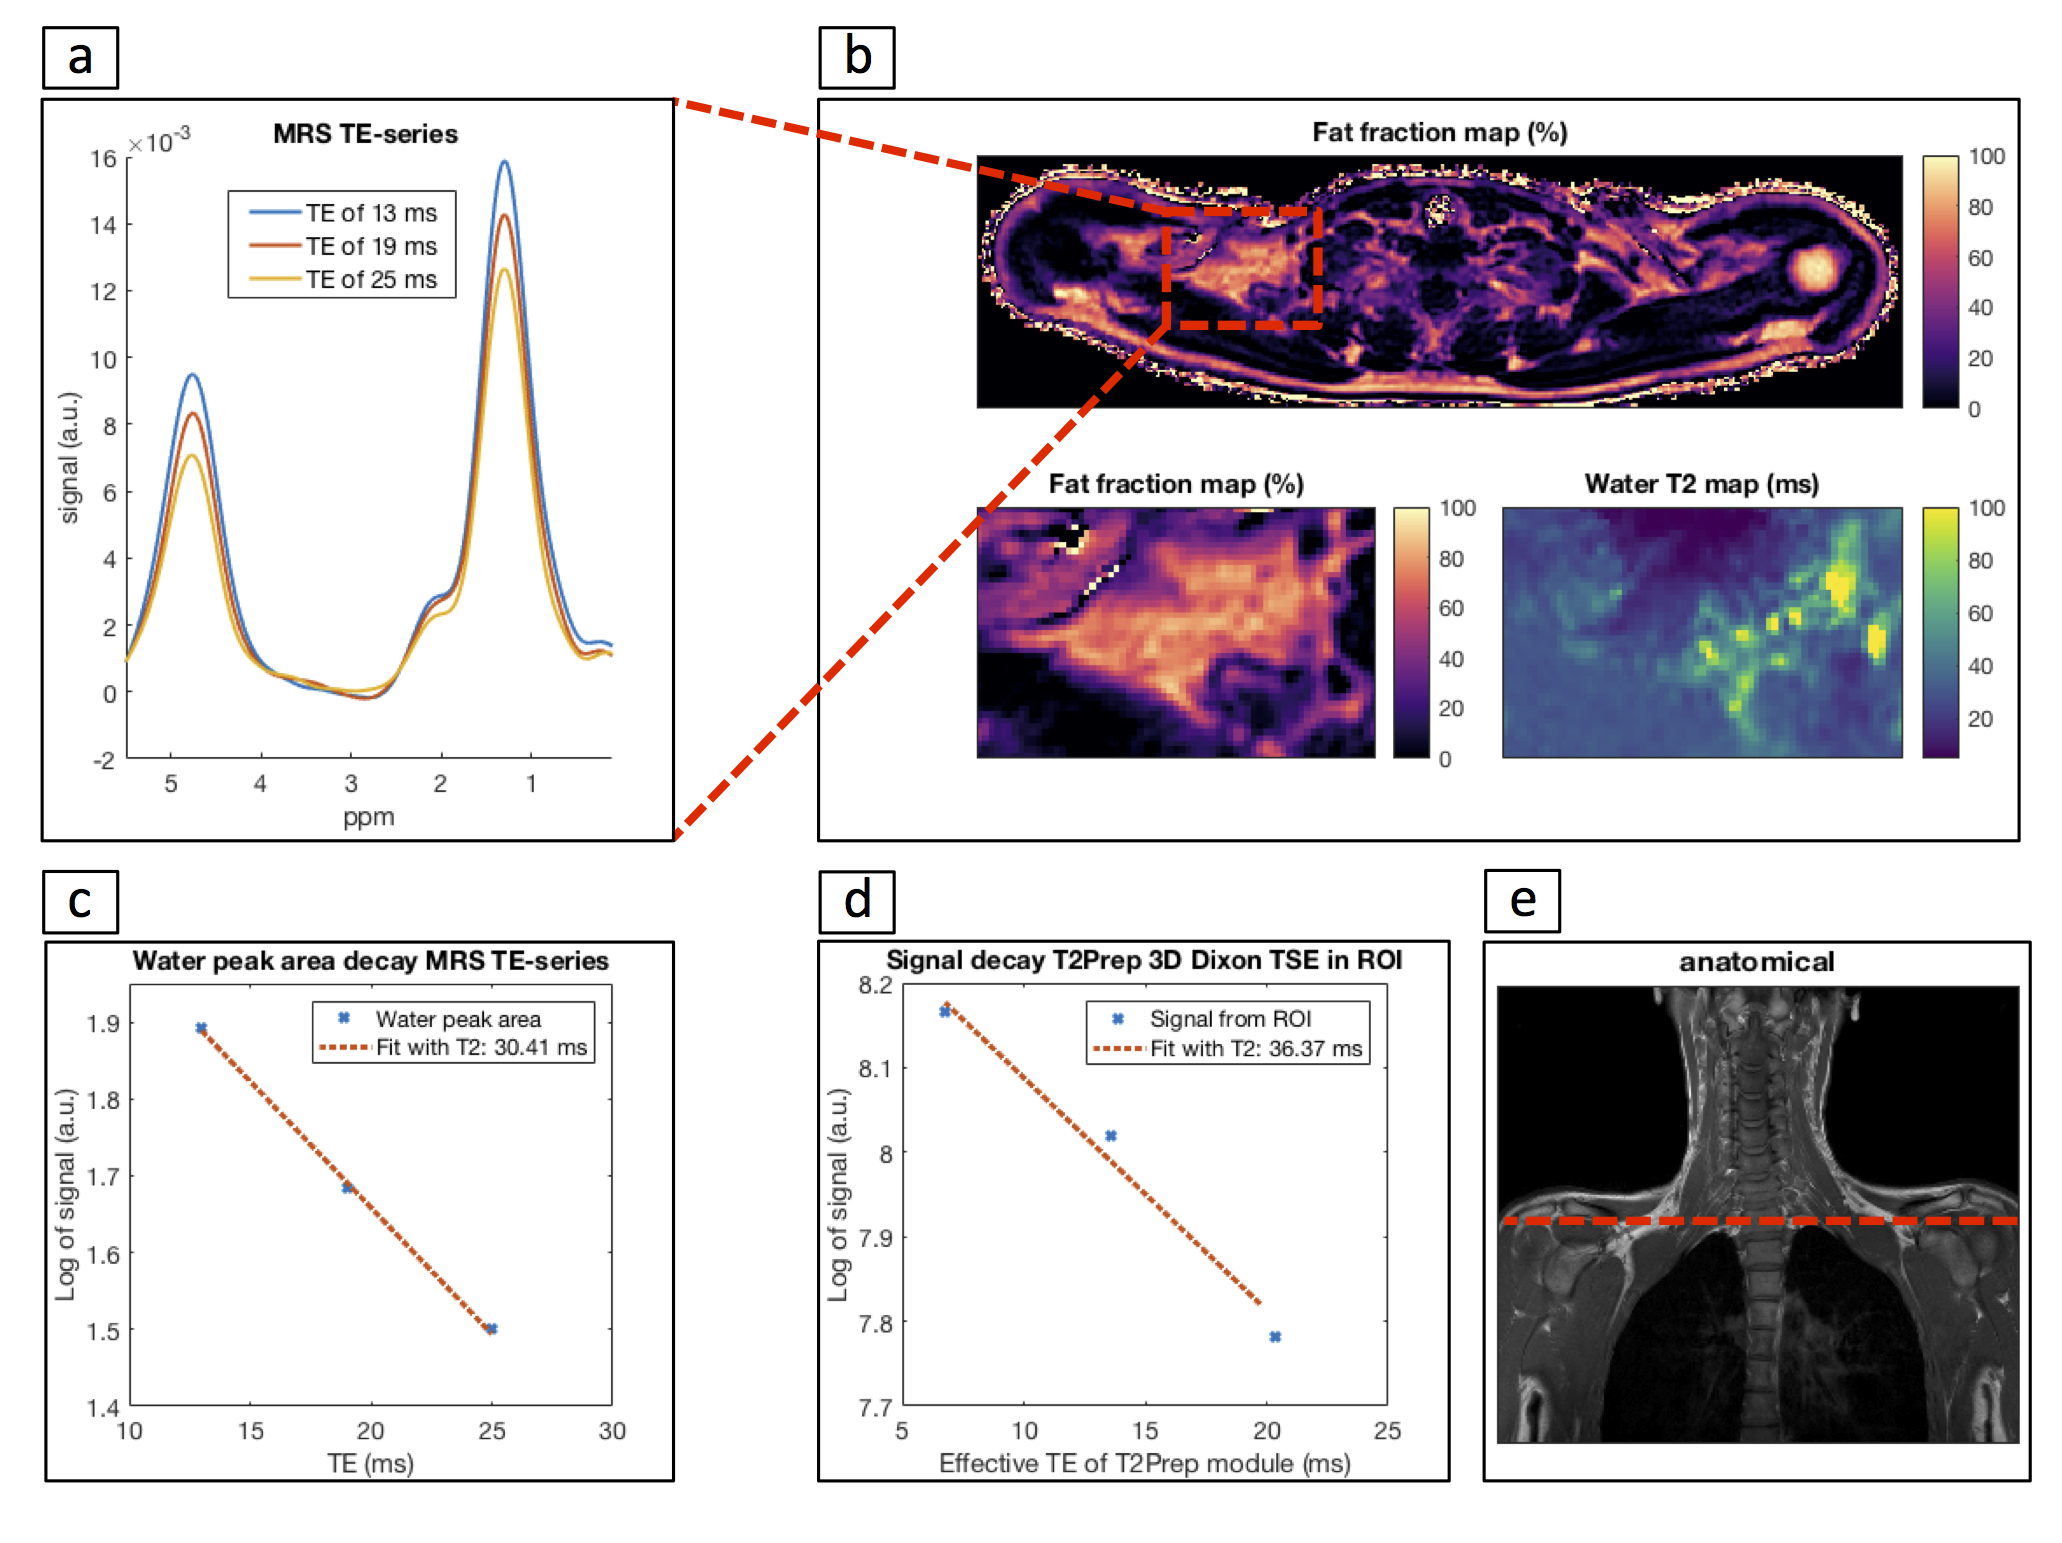
Figure 5:
In vivo measurements: (b) Shows the PDFF map in the head-neck region and a zoomed-in section of the PDFF and T2W map of the supraclavicular fossa in one healthy volunteer. (a) Shows the acquired STEAM TE-series in the supraclavicular fossa. In (b) the tissue heterogeneity can be observed on the PDFF as well as the T2W map. (c) and (d) show the signal decay obtained by spectroscopy and the T2Prep Dixon TSE in the same region. The calculated T2W values agree within a relative error of 16%. (e) Anatomical TW1 TSE with highlighted slice shown in (b).