4221
A fast quality assessment and follow-up of transmit and receive coil paths1Siemens Healthcare, Sant-Denis, France, 2Joliot/Neurospin/UNIACT, CEA, Gif sur Yvette, France, 3Joliot/Neurospin/UNIRS, CEA, Gif sur Yvette, France
Synopsis
To operate a MRI system within the best conditions of reproducibility, Quality Assurance (QA) is mandatory to prevent defects and to detect abnormalities in subparts of the system. When using third-party or home-made coils, it is particularly important to guaranty stability of transmit and receive coil paths. For this purpose, we implemented a fast and user-friendly integrated assessment and follow-up to prevent or quickly detect failures.
INTRODUCTION
To operate a MRI system within the best conditions of reproducibility, Quality Assurance (QA) is mandatory to prevent defects and to detect abnormalities in subparts of the system. It is even more important, when using accessories that are not provided by scanner manufacturer, like for example coils when one is working on investigative Ultra High Field scanners or/and using x-nucleus chain. For this purpose, we developed a QA procedure to assess the linearity of the RF transmission path as well as the receive performance for third-party or home-made coils. A specific focus of this work was to setup an acquisition pipeline and the post-processing evaluation completely integrated into the MRI system to facilitate long-term evaluation.METHODS
Acquisition setup: For the sake of the demonstration, measurements were performed once a week for one year on an investigational 7T MRI system (Siemens Healthineers, Germany, Software version SyngoMR VB17) on a 1Tx/32Rx head coil (Nova medical, Wilmington, MA, USA) for which no standard MR manufacturer assessment was available. A spherical homogeneous oil phantom (Siemens Marcoil Service phantom, T1/T2= 300/100ms) was chosen for its long-term stability. The reproducibility of the phantom positioning was achieved using a holder provided by the coil manufacturer. Two protocols based on modified EPI acquisitions were performed to control separately transmit and receive path of the coil. In both cases, parameters were TR=5s, TE=7.2ms, resolution=4x8x50mm3 with an in-plane matrix size of 64x32 and a scan time of 5 sec per repetition. Transmit measurement: The EPI protocol with 10 repetitions was used to measure signal with a linearly increasing flip angle from 8° to 80°. To cover up the whole range of voltage available for a coil, the excitation pulse duration was automatically adapted with regards to the system calibrated reference voltage. Total scan time was 50 seconds. To evaluate efficiency of transmission, signal amplitude was averaged on an 8x8 pixels region of interest (ROI) in the central slice for each repetition. Then, the average signal was fitted against prescribed flip angle across repetitions with a sinusoidal function considering full relaxation and perfect pulse selectivity. The measured flip angle was then determined using the fitted curve. The coil efficiency was finally obtained by a linear regression between measured flip angle and applied voltage. Receive measurement: A second EPI protocol with 2 repetitions was acquired. The first repetition was acquired without RF excitation. The second repetition was measured with a standard RF excitation for which the flip angle is set to 80°. Total scan time was 10 seconds. Noise and SNR of each channel as well as the combined image were evaluated using the whole image acquired at the center. Follow-up process: After each QA measurement, all fitted results and signal analyzes were automatically saved on the host computer in a dedicated folder for a given coil. This step enabled to retrieve previous measurements and display a long-term evaluation of the QA measurements. This follow-up information was generated in a graphical format within DICOM images. Along with the original series such as magnitude images, an additional series was generated with all QA results to easily evaluate the current status of the coil. All analyses were integrated into the Siemens Image Calculation Environment (ICE) so that no additional steps are required to perform QA post-processing.RESULTS & DISCUSSION
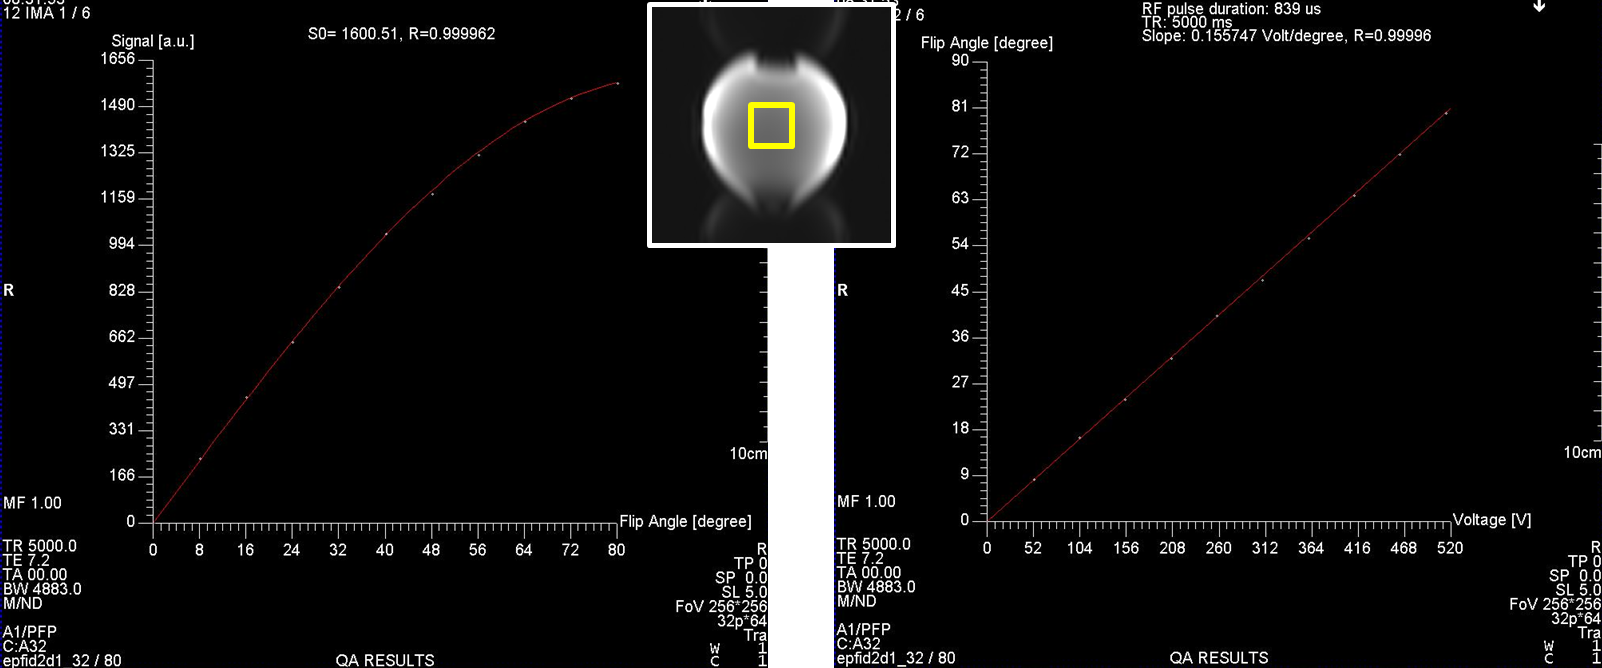
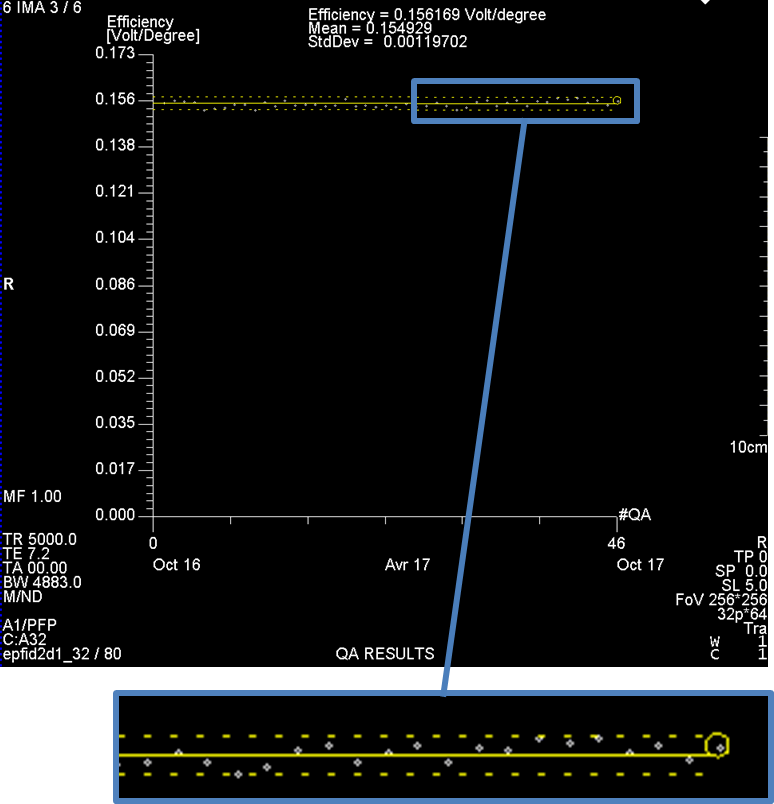
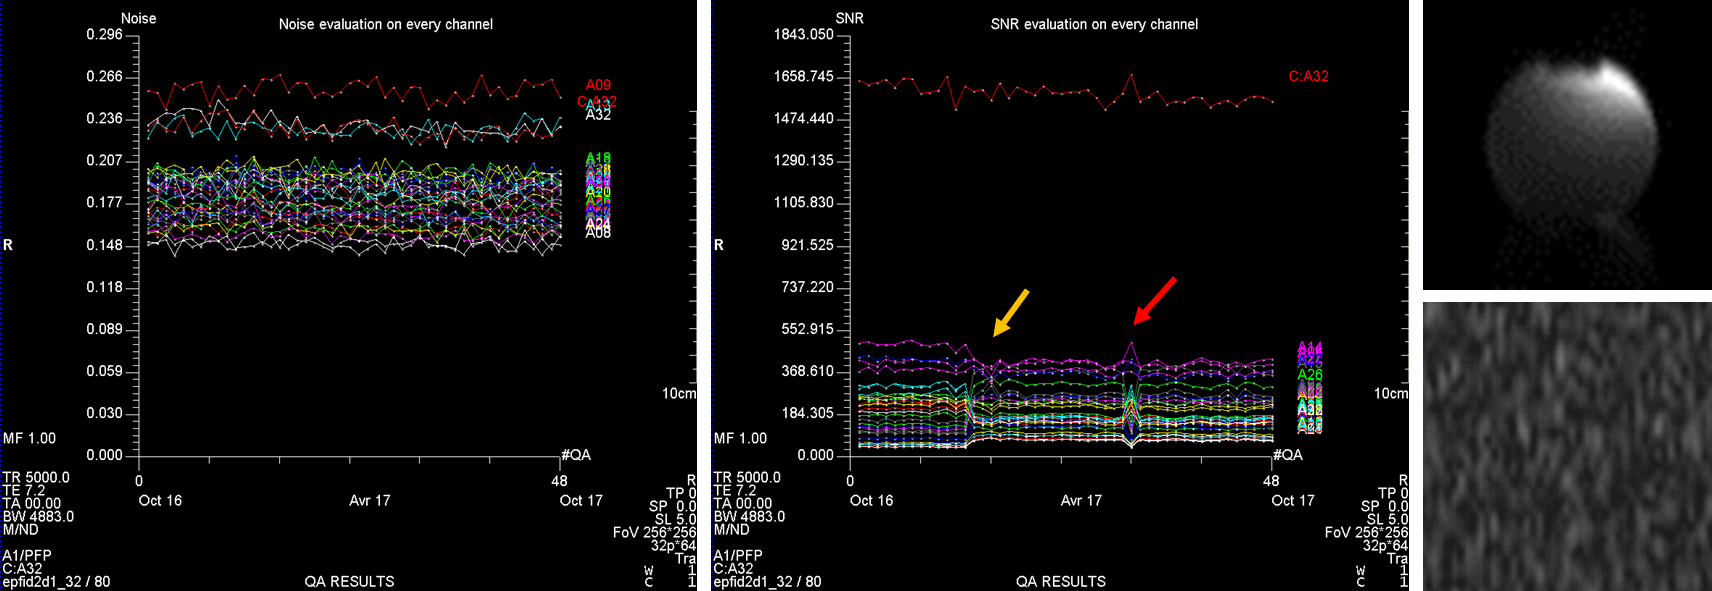
Figure 1 displays an example of data retrieved with the RF transmission evaluation protocol for the 7T 1Tx/32Rx Nova coil. It shows the linearity of the coil transmit capability over the whole voltage range available. This result ensures that the coil behaves correctly for different pulse strengths. The computed efficiency is plotted across time on a long term basis (Figure 2) detect any loss in the transmission of the coil. As shown in Figure 3, noise results show disparity between channels due to various noise figure induced by coil coupling but with a good long-term stability. As each channel does not capture the same amount of signal from the phantom, SNR results is expected to be different across channels. The SNR level shows good stability over time. To enhance the quality analysis of the receive procedure, it would be interesting to integrate a noise covariance matrix estimation as described in [1].CONCLUSION
The characterization of long-term performance of a coil is an important factor to ensure quality of acquired data on a system. To guaranty stability of transmit and receive coil paths when using coils not provided by MR manufacturer, we implemented a fast and user-friendly integrated assessment and follow-up to prevent or quickly detect failures.Acknowledgements
No acknowledgement found.References
1. Use of the noise covariance matrix in array coil quality assurance. E. M. Tunnicliffe, M. J. Graves, and M. D. Robson Proc. Intl. Soc. Mag. Reson. Med. 19 (2011) 4548
2. Protocol for Regular Quality Control of MRI Scanners in a Clinical Setting J. Kuijer , E. Kist , and M. Hofman Proc. Intl. Soc. Mag. Reson. Med. 18 (2010) 5074
3. Quality Assurance Phantoms and Procedures for UHF MRI ‒ The German Ultrahigh Field Imaging (GUFI) Approach, Maximilian N. Voelker et al. Proc. Intl. Soc. Mag. Reson. Med. 25 (2017) 3912
4. Firbank et. al, Br J Radiol (2000) 73:376.
5. Ihalainen et al, Eur Radiol (2004) 14:1859.
Figures