4215
Undersampled Spiral Magnetic Resonance Fingerprinting with Water and Fat Blurring Correction1Multiphysics & Optics, Philips Research Europe, Eindhoven, Netherlands, 2Physics of Molecular Imaging, RWTH Aachen, Aachen, Germany, 3Clinic for Diagnostic and Interventional Radiology, Uniklinik RWTH Aachen, Aachen, Germany, 4Tomographic Imaging Systems, Philips Research Europe, Hamburg, Germany, 5Oncology Solutions, Philips Research Europe, Eindhoven, Netherlands
Synopsis
In the presence of aqueous and fatty tissues, Magnetic Resonance Fingerprinting (MRF) acquisitions with spiral readout suffer from blurring artifacts. We propose to correct undersampled spiral MRF data by combining MRF with a Dixon acquisition and a subsequent conjugate phase reconstruction correction. With the proposed method, the blurring artifacts are removed from the MRF data. T1 and T2 parameter maps with improved homogeneity are obtained.
Introduction
Fast Magnetic Resonance Fingerprinting (MRF) acquisitions rely on accelerated k-space acquisition schemes such as undersampled spiral readouts. In the presence of both aqueous and fatty tissues, however, even short spiral readout gradients cause heavy blurring artifacts in the images. This hampers correct mapping of T1, T2 or the fat signal fraction1. On fully sampled spiral images, a conjugate phase reconstruction (CPR) has successfully been used after Dixon water-fat separation to correct for blurring2. CPR was performed separately on the water and the fat image. The off-resonance map needed for CPR is, conveniently, a by-product of the 3-point Dixon processing. For undersampled spiral MRF, the use of CPR has improved the matching results of MRF for aqueous tissues3,4. In this work, we correct for water and fat blurring in undersampled spiral MRF by combining MRF with a Dixon acquisition and CPR correction.Methods
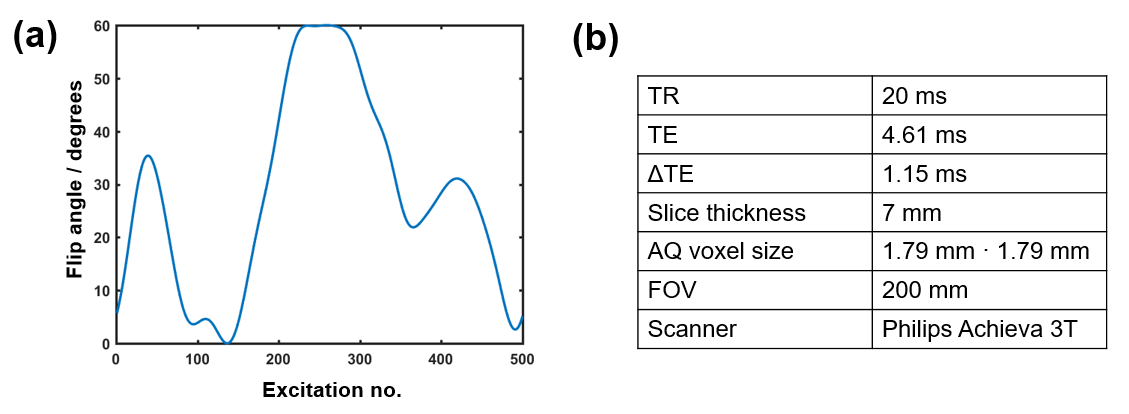
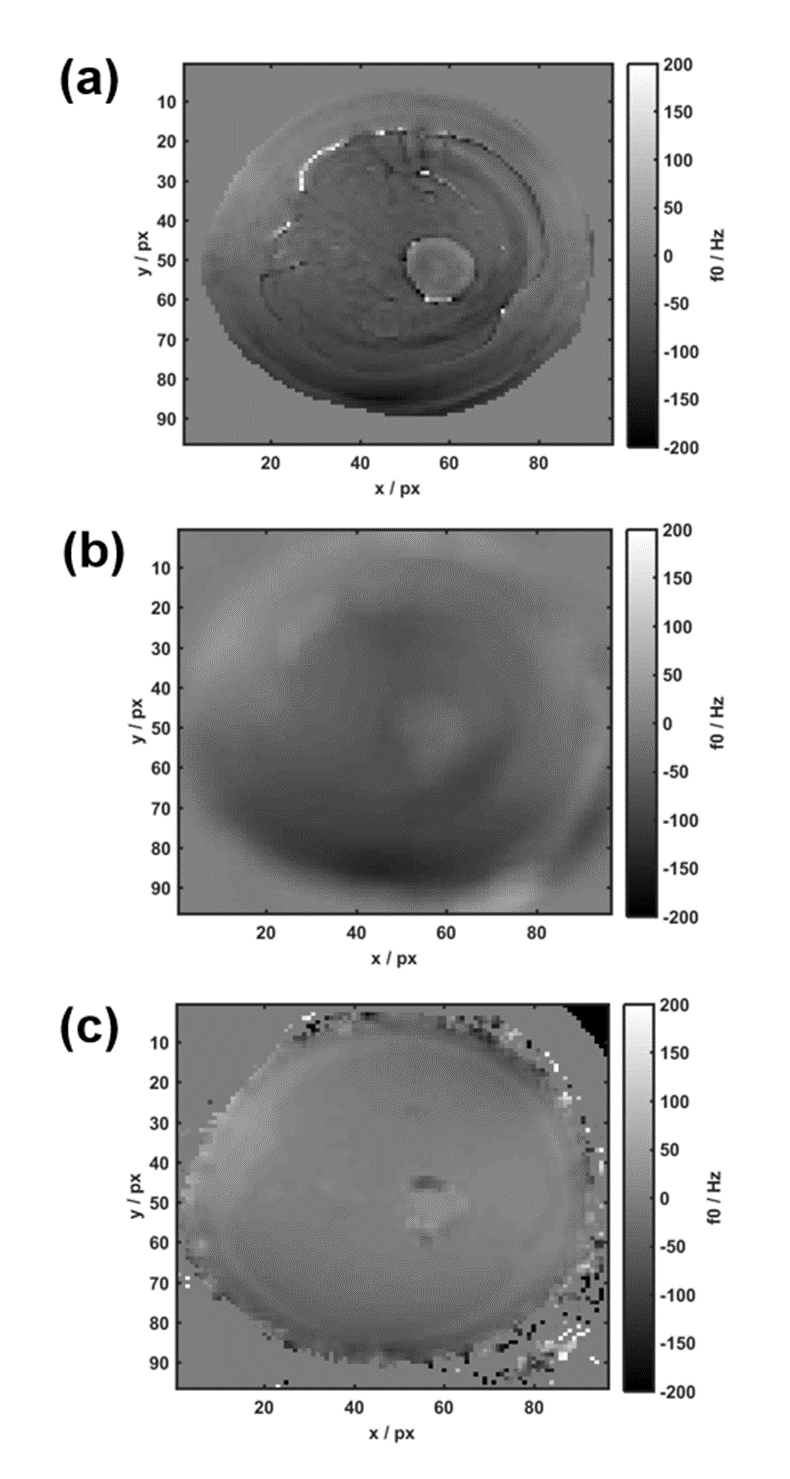
We applied a spiral Dixon multi-acquisition MRF sequence on the upper right leg of a healthy volunteer and acquired 3 MRF trains S0, S1 and S2, which consisted each of i = 1..500 acquisitions using RF pulses of variable flip angles and a constant repetition time (Figure 1). Signal was acquired with one rotating spiral interleave of 5 ms length, undersampling the k-space by a factor of 25. The MRF trains differed in their echo times (TE0 = 4.61 ms, TE1 = 5.76 ms, TE2 = 6.91 ms) and had a duration of 13.5 ms each. For post-processing, a mean off-resonance map was calculated from the temporal averages, denoted by $$$<>$$$, over the undersampled signals S0 and S2: $$$<f_0> = arg\left(\frac{<S_2>}{<S_0>}\right)$$$. Proceeding similarly to2, $$$<f_0>$$$ was smoothed and subsequently used to separate the data into its water and fat contribution Swblurred and Sfblurred, which consisted of 500 complex images each. These were deblurred by CPR, using $$$<f_0>$$$ for Swblurred and $$$<f_0>-440$$$ Hz for Sfblurred. Finally, the deblurred water and fat MRF data SwCPR and SfCPR were recombined to one MRF dataset. A dictionary of possible signal evolutions was calculated using extended phase graphs5.The best matching parameters (T1, T2) were selected for each voxel by inner product matching between the deblurred MRF data and the dictionary. Furthermore, water and fat signal images were approximated by temporally averaging over the CPR-corrected as well as over the uncorrected MRF data. A Cartesian 3-point Dixon sequence was acquired as a comparison data set to judge the accuracy of our post processing method.Results
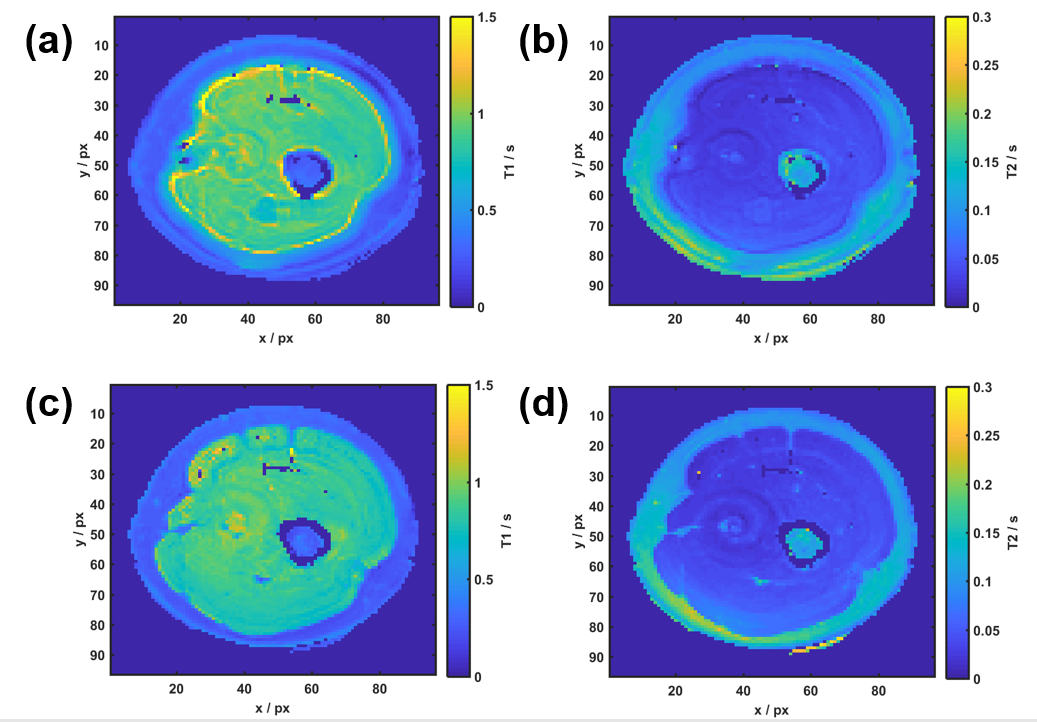
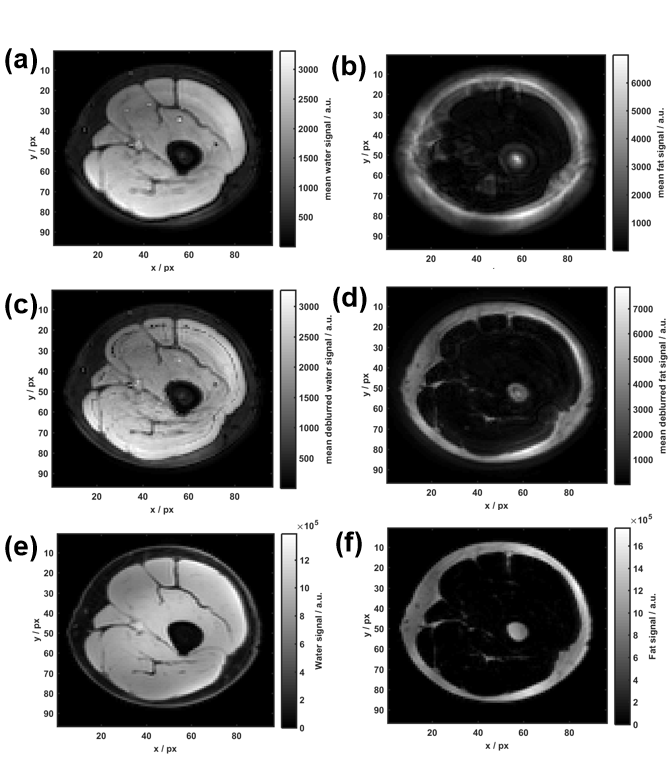
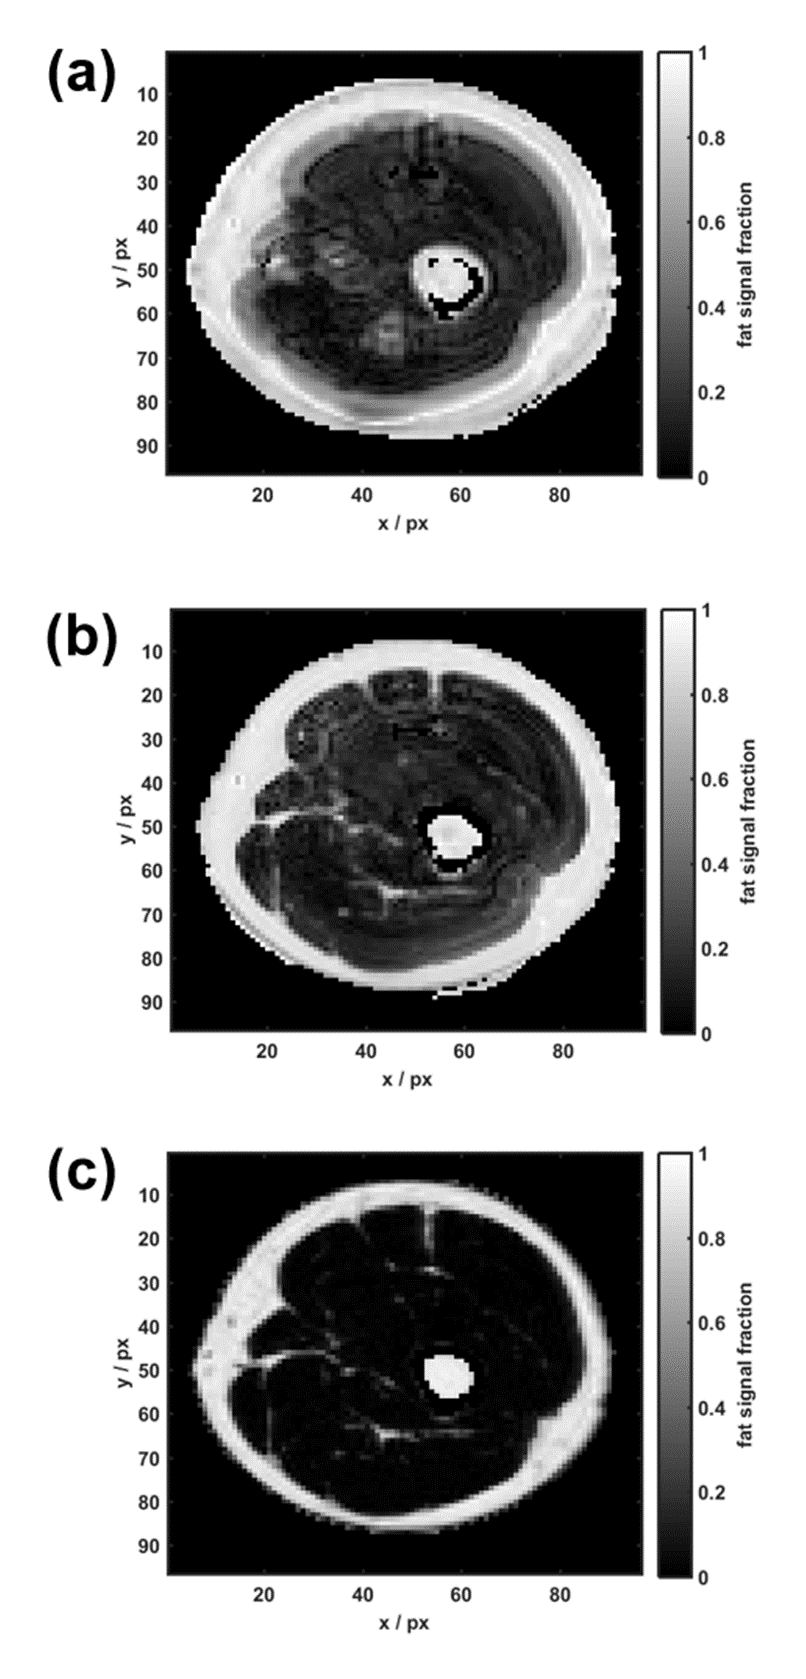
$$$<f_0>$$$ shows similar large-scale features to the Cartesian Dixon off-resonance map, but some finer ring-like subfeatures which mostly disappear after smoothing (Figure 2). After Dixon separation, the fat image <Sfblurred> shows heavy blurring artifacts (Figure 4b). The T1 and T2 maps reflect these artifacts when matching the uncorrected MRF data to the dictionary (Figure 3a+b). After CPR, the boundary between muscle tissue and subcutaneous fat is well distinguishable and the relaxation parameter maps (Figure 3c+d) show improved homogeneity. Average values T1muscle=(840±90) ms, T2muscle =(41±15) ms, T1fat =(300±60) ms and T2fat =(120±40) ms are similar to literature6. In the parameter maps, finer substructures in the muscle are not visible and a spiral flow artifact remains around the vessel. Yet, the deblurred water and fat maps (Figure 4c+d) show the same features as the Cartesian 3-point Dixon scan (Figure 4e+f). When calculating the fat signal fraction $$$S_f / (S_w+S_f)$$$, the CPR-deblurred MRF result slightly overestimates the fat signal fraction in the area of muscle tissue in comparison to the Cartesian Dixon sequence (Figure 5).Discussion
Parameter maps were improved after a Dixon water-fat separation and subsequent CPR. Finer substructures in the T1 and T2 maps are probably non-visible due to their low SNR, e.g. in gaps or areas of low fat fraction. Some remaining signal after imperfect deblurring may also play a role. This may be improved by employing a CPR with multi-frequency interpolation. Obtaining water and fat images by temporally averaging over the signal evolutions remains an approximation: As aqueous tissue has a larger T1 than fatty tissue, a larger portion of its fingerprint signal is in fact negative. Thereby, the fat fraction is slightly overestimated.Conclusion
This work shows that it is possible to correct for water-fat blurring in spiral MRF data without the use of fat-suppression methods. This makes spiral MRF more suited for clinical applications like breast imaging, which else suffer from blurring artifacts. According to the original idea of MRF, the undersampled acquisition results in a sequence duration of only 1:36 min (13.5s/MRF train). Future work includes the application to other anatomical areas.Acknowledgements
This research project is supported by the European Commission through the Marie Sklodowska-Curie Actions, Innovative Training Program - European Industrial Doctorate, Project Nr. 642445.References
1 Ostenson J, et al. Fat Signal Fraction Determination Using MR Fingerprinting, Proc. Intl. Soc. Mag. Reson. Med. 25 (2017)
2 Boernert P, et al. Spiral Water–Fat Imaging with Integrated Off-Resonance Correction on a Clinical Scanner, Magnetic Resonance Imaging 32:1262–1267 (2010)
3 Koken P, et al. Improving Accuracy in MR Fingerprinting by Off-Resonance Deblurring, Proc. Intl. Soc. Mag. Reson. Med. 25 (2017)
4 Ostenson J, et al. Multi-frequency interpolation in spiral magnetic resonance fingerprinting for correction of off-resonance blurring, Magnetic Resonance Imaging 41, 63–72 (2017)
5 Scheffler K, A Pictorial Description of Steady-States in Rapid Magnetic Resonance Imaging. Concepts in Magnetic Resonance, Vol. 11(5) 291–304 (1999).
6 Gold G E, et al. Musculoskeletal MRI at 3.0 T: Relaxation Times and Image Contrast. American Journal of Roentgenology, Vol.183(2) 343-351 (2004)
Figures