4204
Distortion measurements empirically validate gradient model impact on diffusion weighting1Radiology, University of Michigan, Ann Arbor, MI, United States, 2Modus Medical Devices, London, ON, Canada, 3Philips Research Laboratories, Hamburg, Germany, 4Philips Research Laboratories, Cambridge, MA, United States, 5Philips MR Clinical Science, Best, Netherlands, 6University Health Network, Princess Margaret Cancer Center, Toronto, ON, Canada
Synopsis
Distortion fields induced by gradient nonlinearity were measured for two channels of two MRI systems to validate vendor-provided gradient design models intended for correcting spatially nonuniform diffusion weighting. Excellent agreement was observed between the model and the empiric displacement measurements recast into first two diagonal elements of system nonlinearity tensor for both systems. The measurements were sensitive enough to detect sub-millimeter differences between nominally symmetric right-left and anterior-posterior gradients. Unexplained minor deviation from spatially symmetric design was detected for right-left gradient of both systems by diffusion and distortion measurement.
Introduction
Analogous to image-based correction of geometric distortion, MRI vendors are exploring implementation of on-scanner correction for nonuniform diffusion weighting (DW) induced by gradient nonlinearity (GNL)1,2 using gradient design information. This work empirically validates gradient design model through independent (non-DWI) distortion measurements to warrant practical correction implementation.Methods
GNL-induced geometric distortions were measured using 3D geometric distortion phantom3 for right-left (RL) and anterior-posterior (AP) gradient channels (GRL and GAP) on 1.5T and 3T (two) clinical MR scanners with geometric correction disabled. To separate shim distortion contribution, the 3D field-echo acquisition was repeated twice for each of phase-encoding applied along GRL and GAP and changing fat-shift direction (R vs. L and A vs. P) for a total of four scans. The volume displacement fields were auto-reconstructed from phantom surface measurements on 18mm 3D-grid (FOV = 288x288mm2) by proprietary software3, based on a previously published algorithm4. The corresponding GNL maps for GRL and GAP were generated from the output distortion fields by taking the spatial derivative along the primary channel axis for distortion added to true grid location. Scanner-specific model GNL maps were also calculated on the same spatial grid using gradient design (spherical harmonics) coefficients1 provided by the MRI vendor.
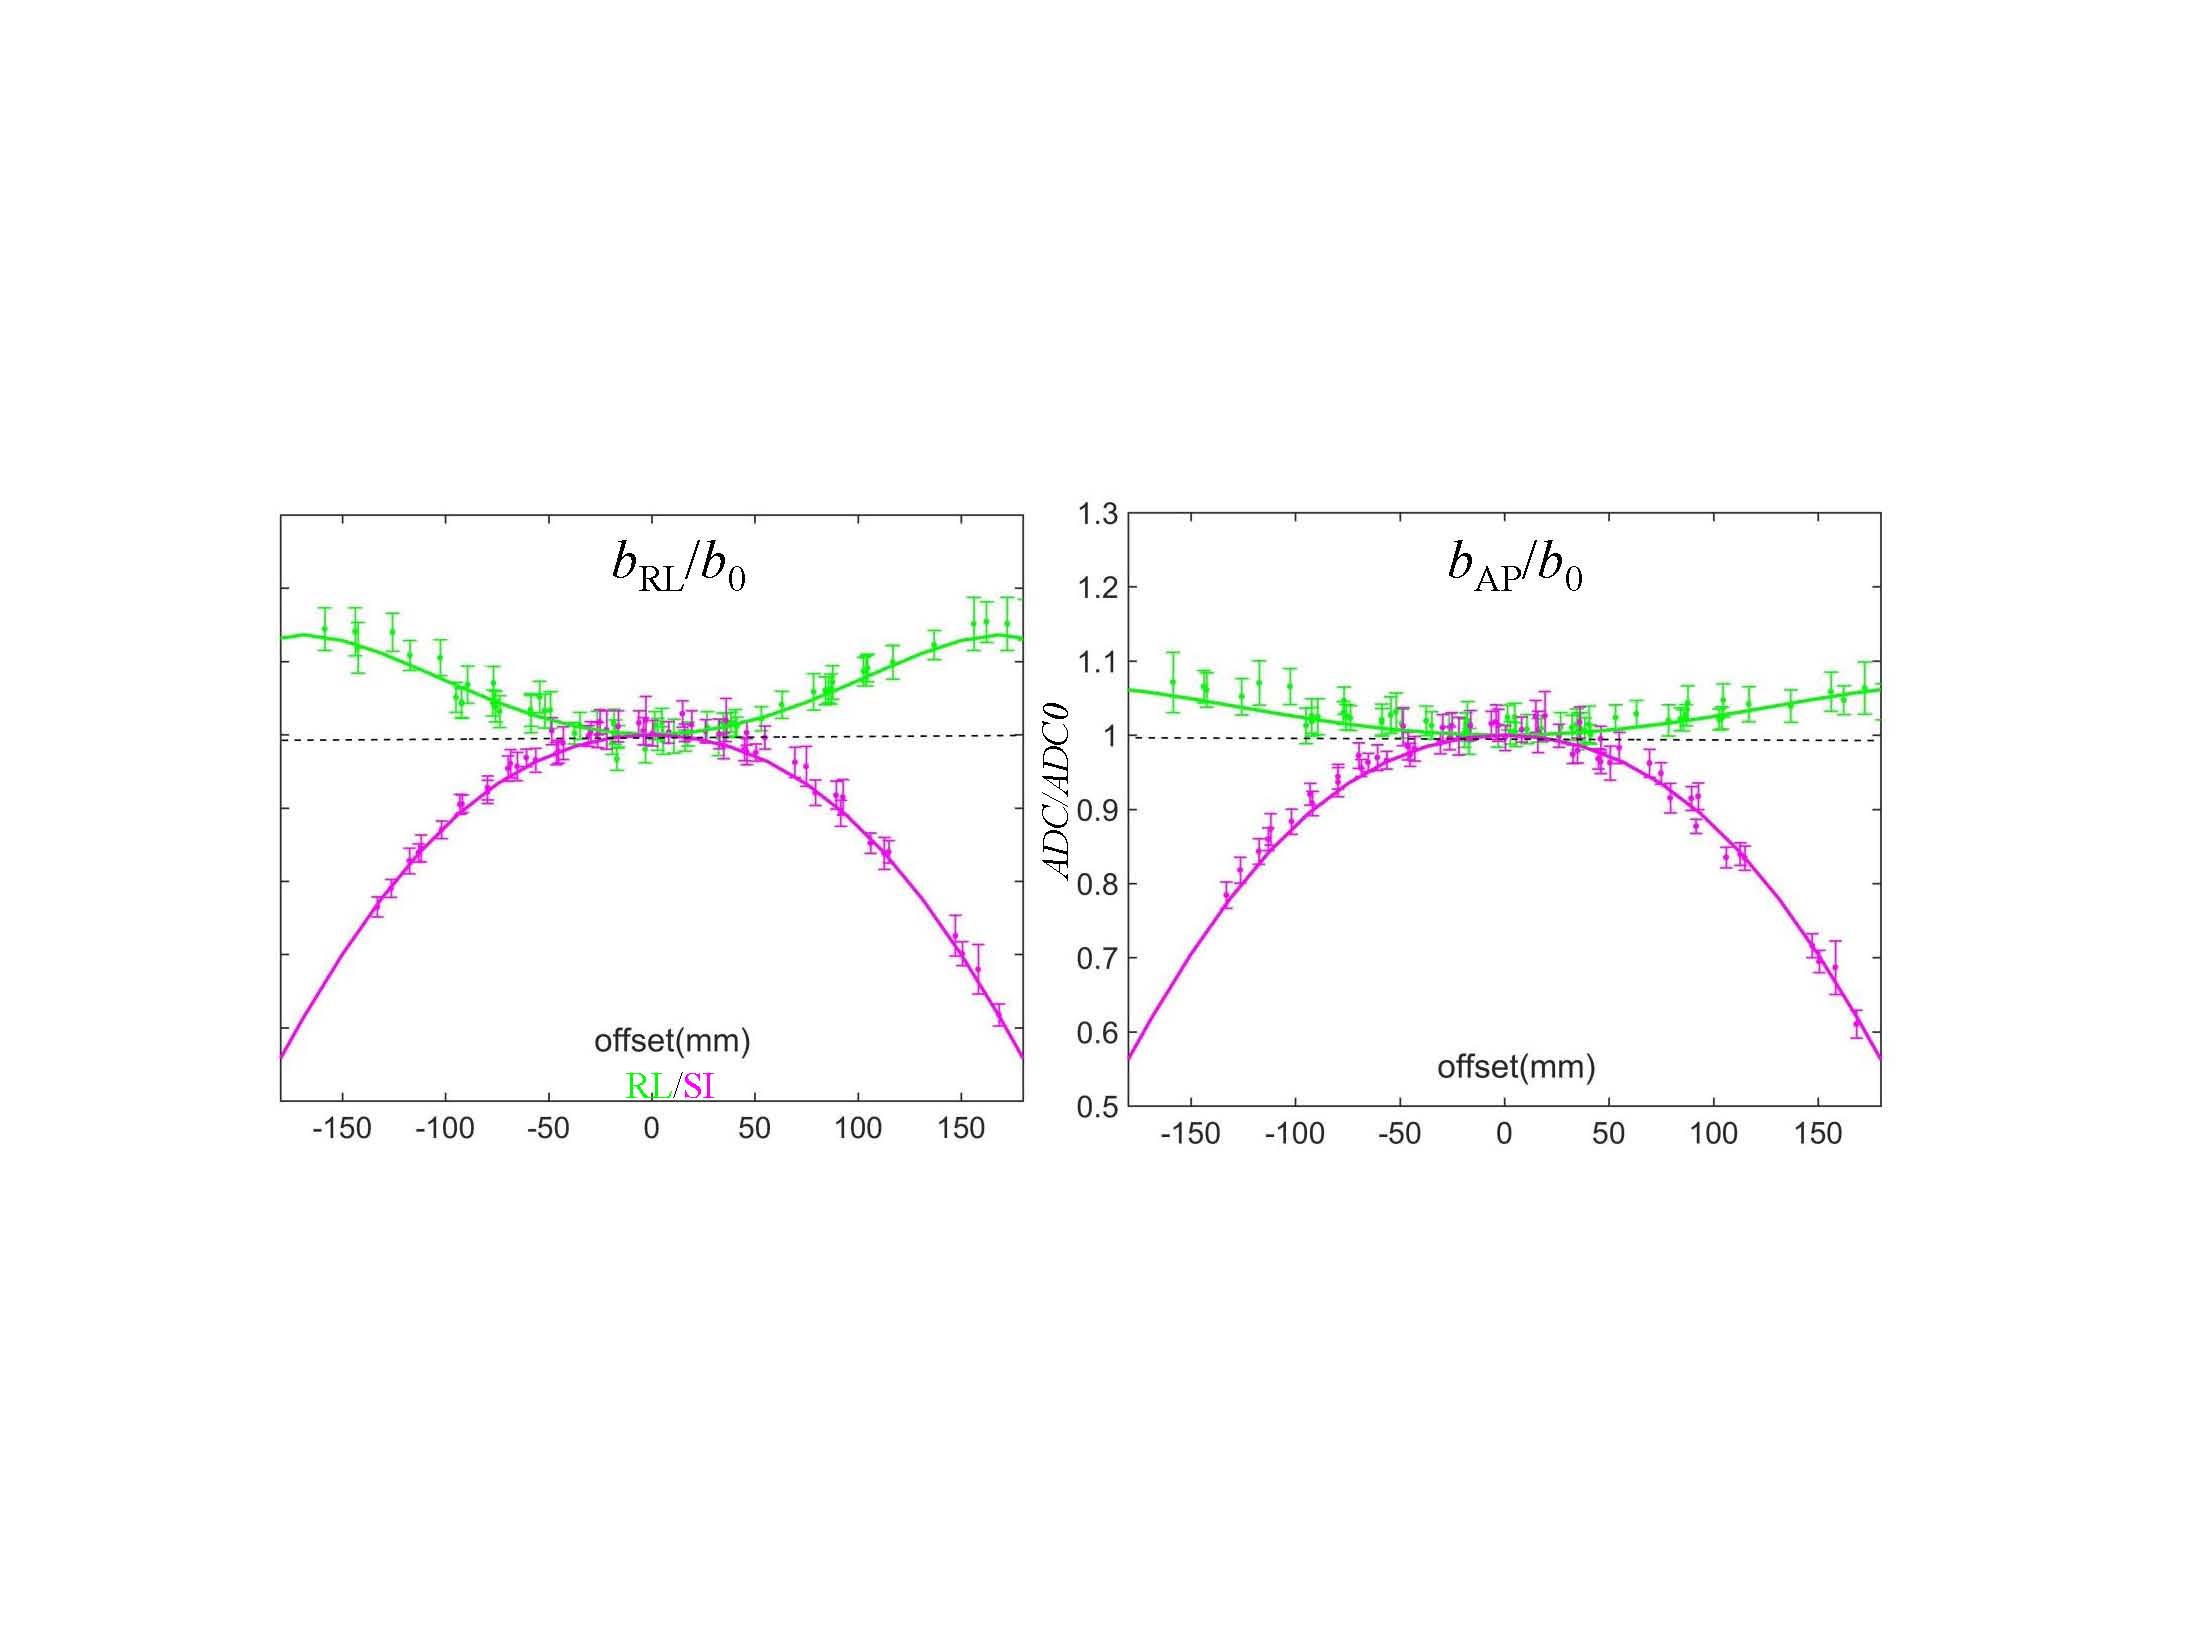
GNL impact on diffusion weighting was independently assessed by sagittal and axial DWI scans2 performed on both scanners using a long-tube ice-water phantom oriented along RL and superior-inferior (SI) axis, respectively. GNL-induced bias in diffusion weighting for GRL and GAP was measured along RL and SI axes from the offset dependence of phantom ADC for DWI gradients along RL and AP directions. The ADC mean and standard-deviation (SD) were measured from 10mm circular regions-of-interest (ROIs) defined on three slices of the phantom tube near zero AP offset for RL/SI locations ranging from -180 to 180 mm. The b-value bias was estimated as a ratio of measured ADC to the true ice-water value ADC0 = 1.1 (x10-3mm2/s)5. The corresponding model GNL profiles for b-value bias were derived as the square of the model map value for GRL and GAP channels taken along RL and SI cross-sections. B0 maps were also generated from multi-echo GRE scans with the same phantom settings as for the DWI to independently characterize chronic shim gradients. Shim-gradient profiles were calculated as spatial derivatives of B0 maps along RL and SI offsets.
Results and Discussion
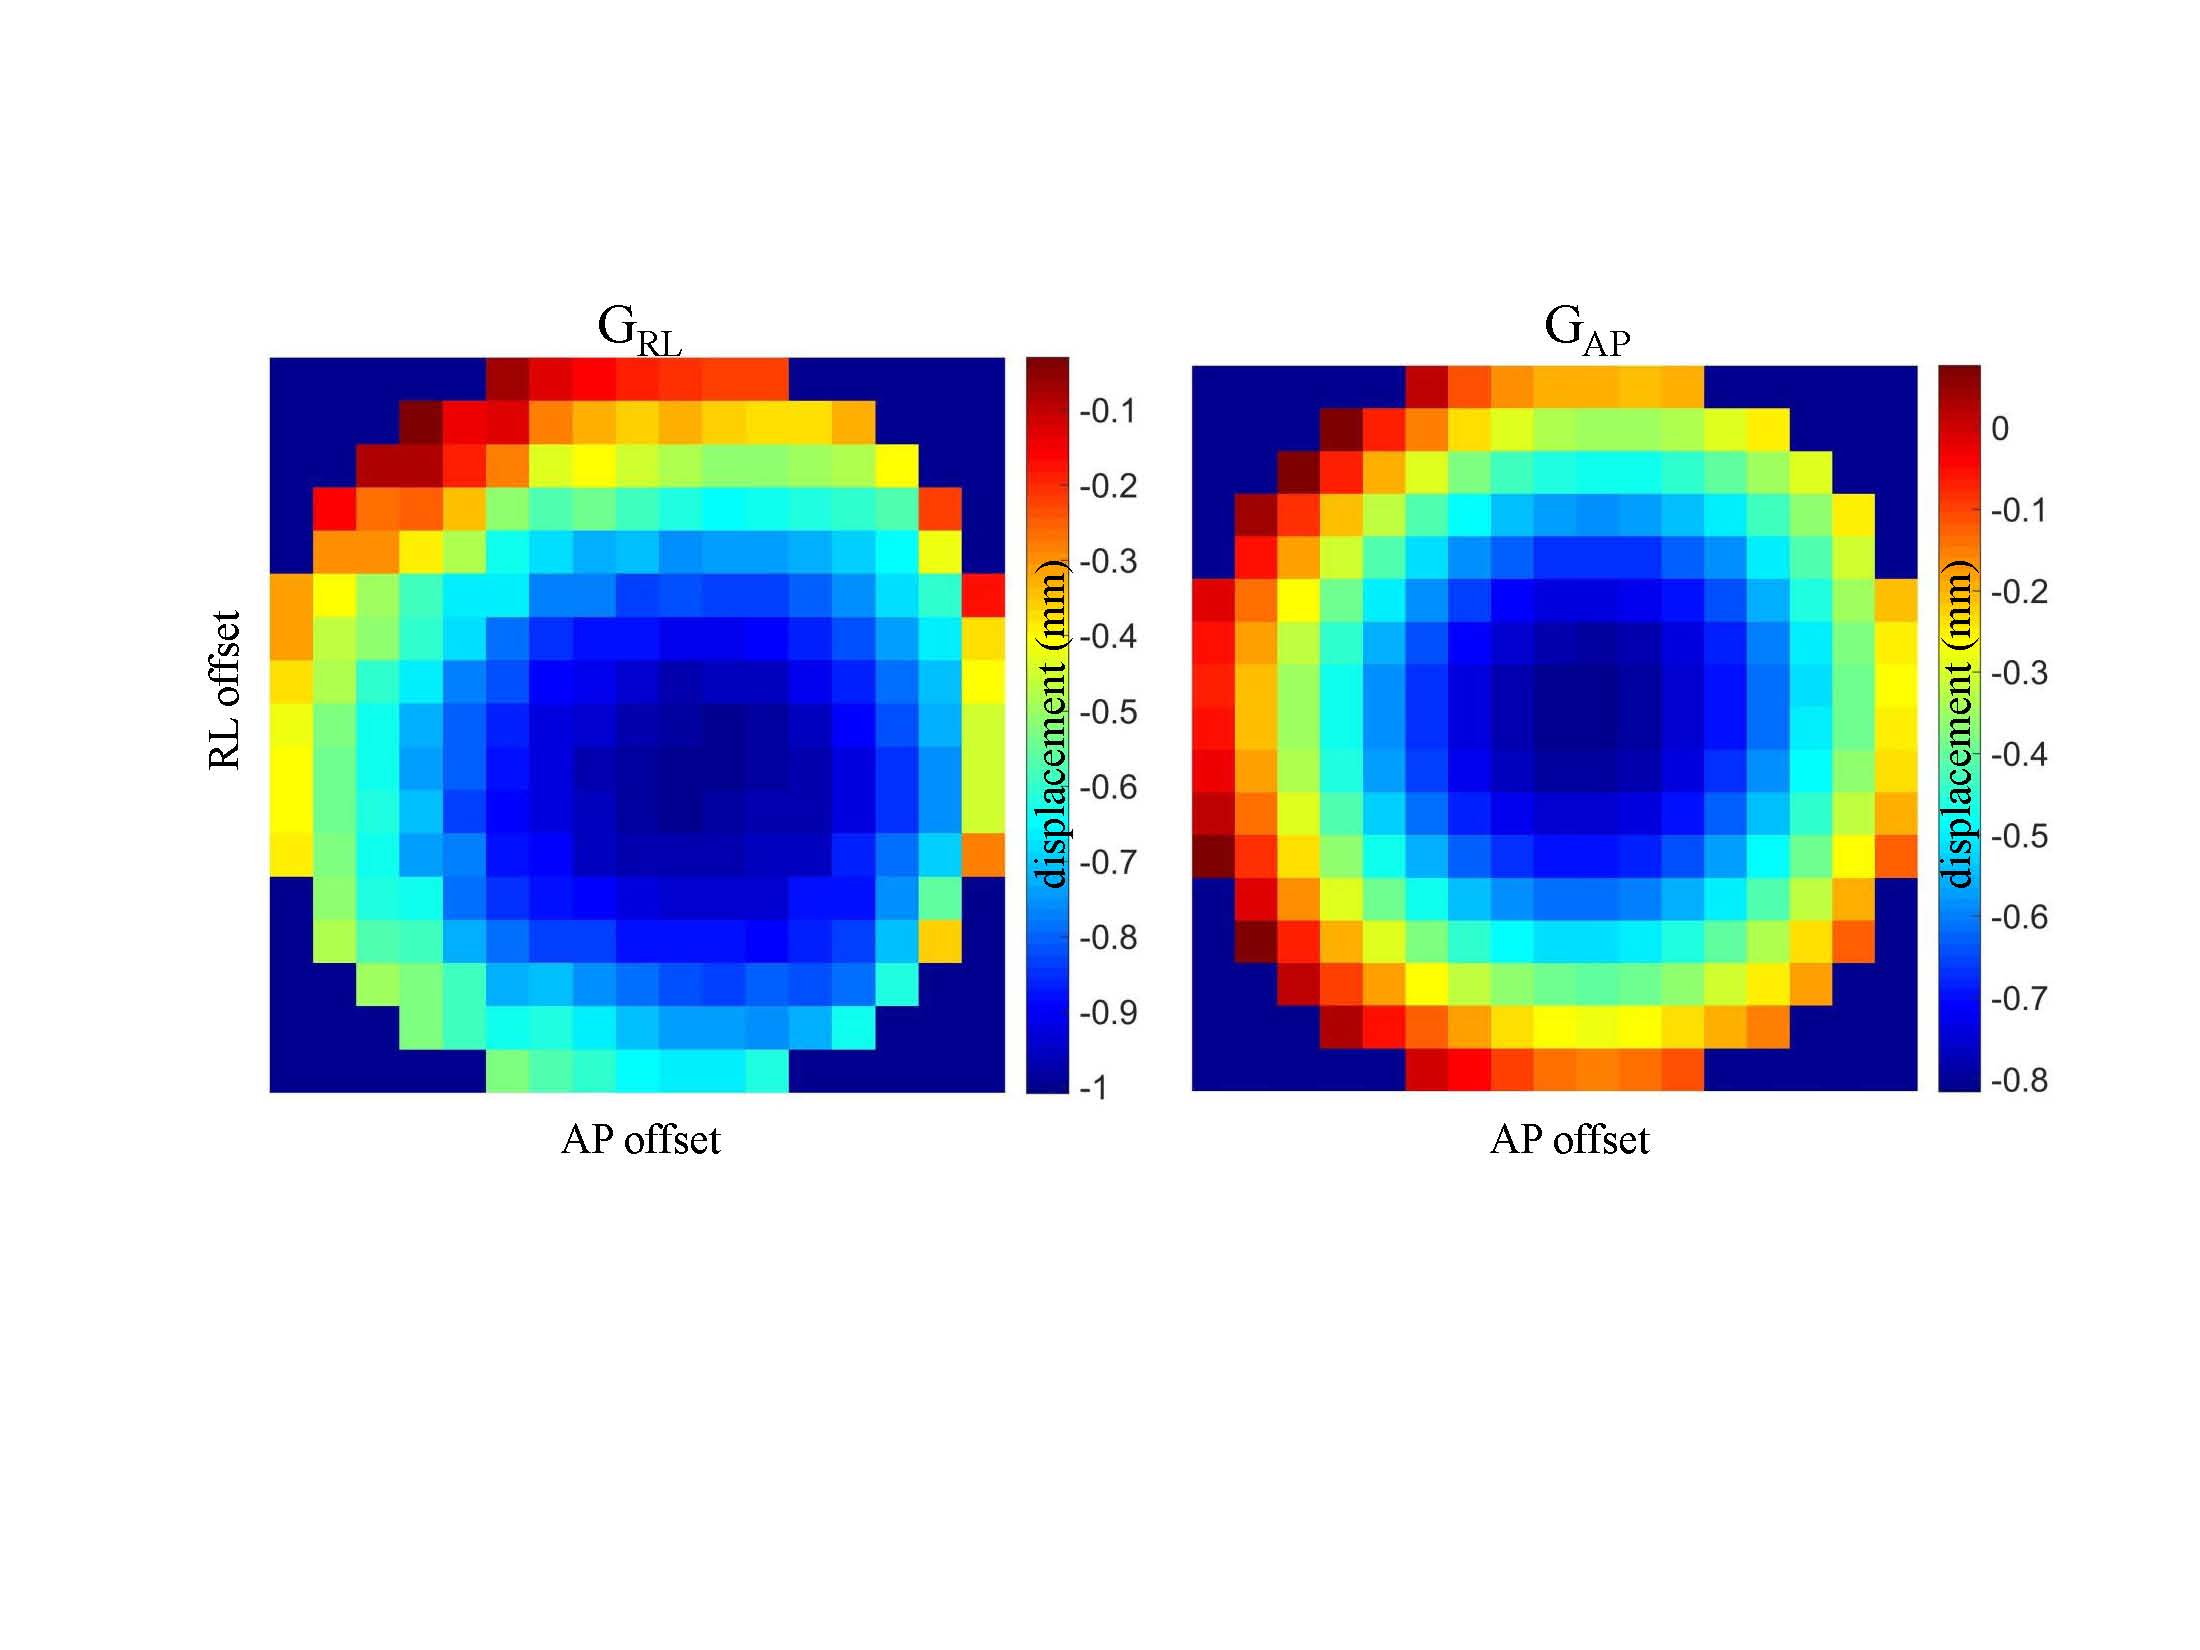
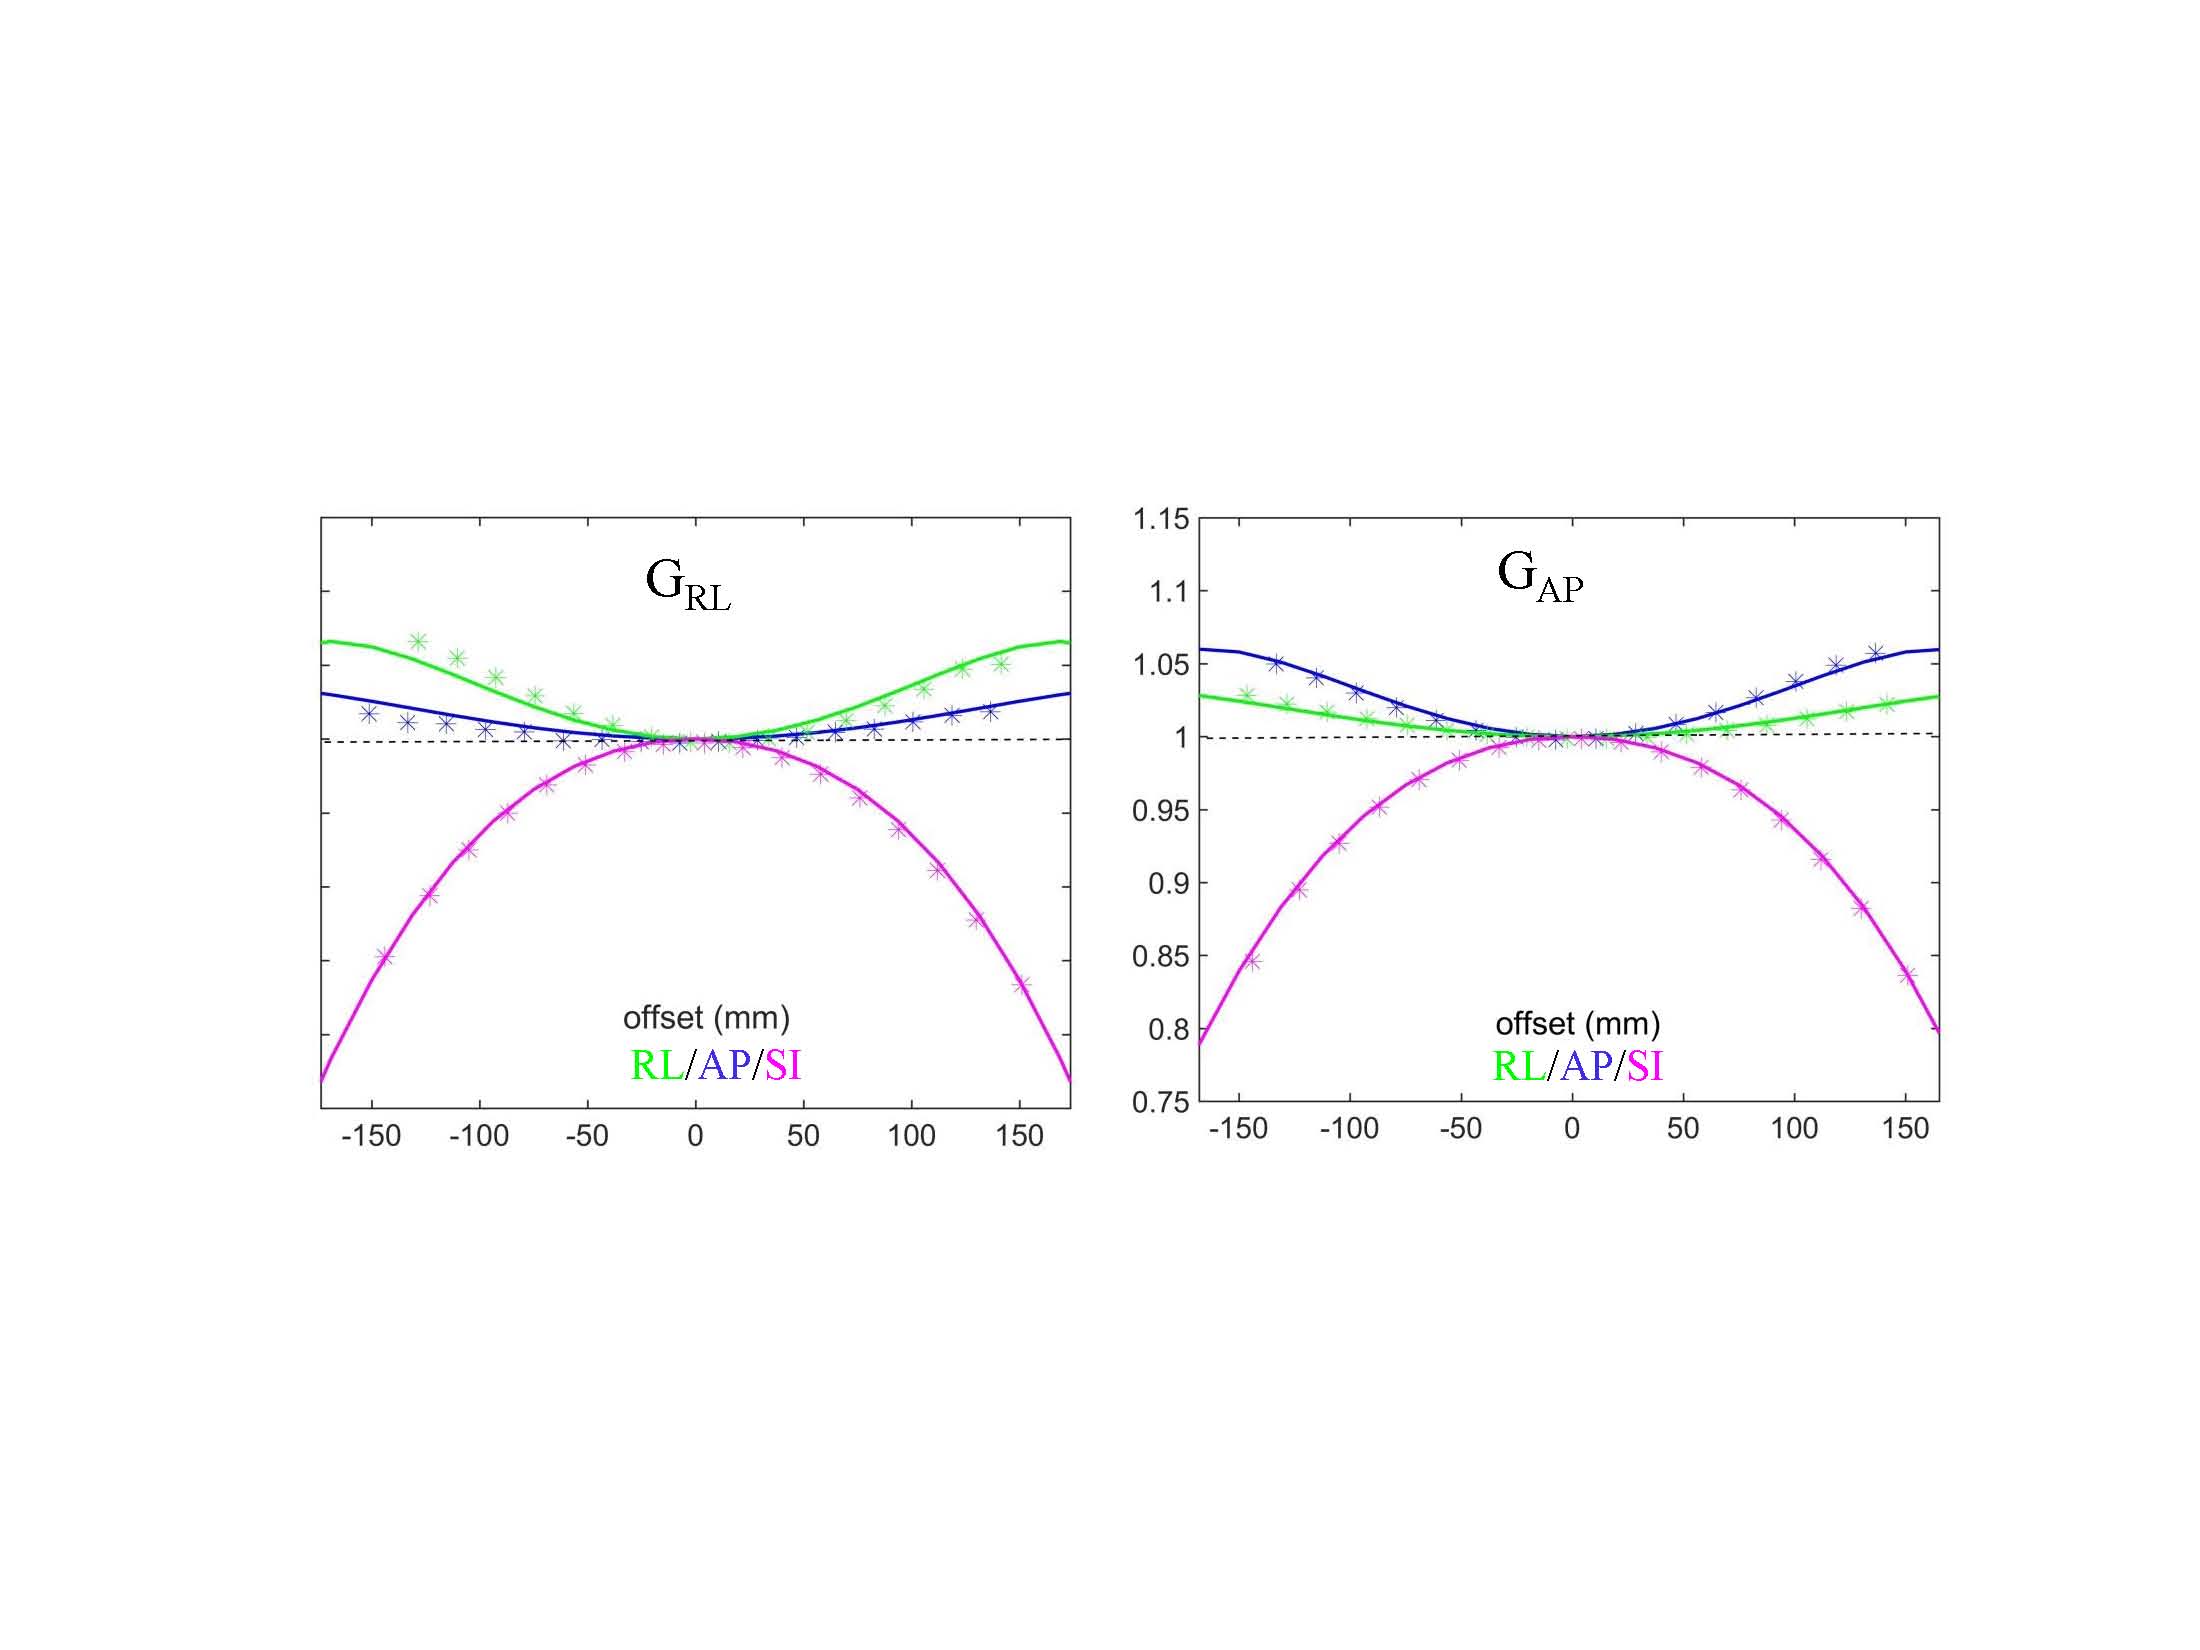
Figure 1 shows an example of 2D distortion maps obtained for GRL and GAP gradients of 1.5T system that reflect channel-specific directional displacement patterns. The utilized distortion measurement protocol was sensitive enough to detect 0.1mm differences between RL and AP channels along their primary directions. Figures 2 and 3 further illustrate good agreement of vendor provided GNL model for this system with both measured displacement fields and diffusion weighting nonuniformity bias along RL and SI directions. Similar results were obtained for the 3T scanner (with lower error bars consistent with higher SNR). Spatial deviation from symmetric GNL design was detected for RL channel on both 1.5T and 3T scanners. Both B0 profile for ice-water phantom and independent displacement measurements from the 3D distortion phantom suggested that shim imperfection (<0.5%) was not the origin of the observed deviation (true origin is unknown).
The notable benefit of independent empiric validation is that the displacement field method provides 3D channel characteristics, while ADC measurements via the long-tube ice-water phantom are inherently 1D. Current limitation is the lack of distortion measurement protocol for GSI gradient characterization and output provided only in the form of displacement fields. The latter allows partial characterization of individual channels producing two diagonal elements of GNL tensor. Providing gradient field output for each of three channels would enable empiric characterization of six cross-channel terms in addition to three diagonal maps yielding all nine components of GNL tensor in 3D.
Conclusion
The vendor-provided gradient channel descriptions adequately reflect systematic GNL-induced displacements and the corresponding b-value nonuniformity bias for GRL and GAP gradients across the two studied clinical scanner platforms. This warrants the use of corresponding gradient design information for implementation of on-scanner correction for quantitative DWI applications. Validation of all nine elements of GNL tensor is desirable for comprehensive correction.Acknowledgements
National Institutes of Health Grants: R01CA190299, U01CA166104; and funding from Princess Margaret Cancer Foundation.References
1Bammer R, Markl M, Barnett A, et.al. Magn. Reson. Med. 2003 50:560-569;
2Malyarenko DI, Newitt D, Wilmes LJ, et.al. Magn Reson Med. 2016;75(3):1312-23;
3QUASARTM MRID3D, ModusQA (2014) https://modusqa.com/mri/mrid3d;
4Tadic T, Jaffray DA, Stanescu T, Med. Phys. 2014; 41(11):1-10;
5Holz M, Heil SR, Sacco A. Phys. Chem. Chem. Phys. 2000;2:4740–4742.
Figures