4200
Comparison of ASL quantification results across 3T scanners with different hardware/software – insight for multisite ASL studies1Feinberg school of medicine, Department of Radiology, Northwestern University, Chicago, IL, United States
Synopsis
Combination of data across different scanner platforms is a major concern for multisite studies. The quantitative nature of arterial spin labeling (ASL) is thought to be free from such concerns, but our results on data collected on the same scanner before and after hardware upgrade demonstrate that ASL is also subject to this confound. Normalization to a reference region greatly reduces variation even for non-quantitative data, and is a recommended approach for removing scanner-related variations.
Introduction
Maturation of arterial spin labeling (ASL) techniques1 and reports of the sensitivity of cerebral blood flow (CBF) for detecting disease states2, 3 have prompted the inclusion of ASL in many multisite protocols. One of the trickiest aspects of multisite studies is combination of data from different scanners and across vendors. Since ASL provides a quantitative measure of CBF, it has been expected to be independent of scanner differences. In this study, we had the unique opportunity to test this theory by comparing ASL data acquired on the same magnet in the same subjects before and after it was upgraded from a TIM Trio to a Prisma. We also collected data on another Prisma at the same facility to determine if scanners from the same vendor with similar hardware have significant differences.Methods
A total of 29 subjects (mean age 25±2years, 21F) were scanned on two 3.0T Siemens scanners. During each visit, subjects were scanned on both scanners, the order of which was randomized. Session 1 scanned 15 subjects before scanner 1 (TIM Trio, 32 channel headcoil) was upgraded to a Prisma and scanner 2 was a Prisma at VD13D. Then 27 subjects (including 13 from session 1) were scanned 6 months later when both scanners were Prismas at the VE11C software level. The 64 channel headcoil was used on the Prismas. Scans relevant for this study included 1) high-resolution 3D MPRAGE4: TR/TE/TI=2300/2.46/900ms, 208 sagittal slices, 1mm isotropic resolution; 2) 2D-pseudocontinuous ASL (2D-pCASL)5: TR/TE=4500/11ms, 25x4mm slices with 1mm gap, in-plane resolution 3.4x3.4mm2, label duration=1500ms, postlabeling delay=1800ms, 40 control/tag pairs; and 3) Siemens product 3D background suppressed PASL (non-quantitative): TR/TE=4000/16ms, 40slices with 20% slice oversampling, resolution 3x3x3mm3, TI1/TI2=700/1800ms, FAIR-QII, 1 control/tag pair.
All data were processed in Matlab. 2D ASL images were motion-corrected and co-registered to the MPRAGE. Perfusion weighted images were generated by pairwise subtraction and data cleaning included Z-threshold outlier removal6, regression of motion parameters and global signal7 and denoising8. The perfusion weighted time-course was averaged and converted to CBF units via a previously published quantification model1. Volxelwise raw signal to noise ratio (rSNR) was calculated by dividing the mean perfusion weighted image by the standard deviation of background noise. Temporal signal to noise ratio (tSNR) maps were calculated by dividing the mean of each voxel by its standard deviation over the time-series. Gray and white matter masks were generated by segmenting the MPRAGE image, down-sampling to the ASL data resolution and thresholding at 0.5. Paired t-tests with Bonferroni correction for multiple comparisons were used to assess differences between scanners.
Results
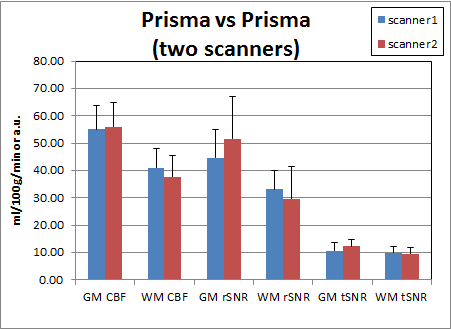
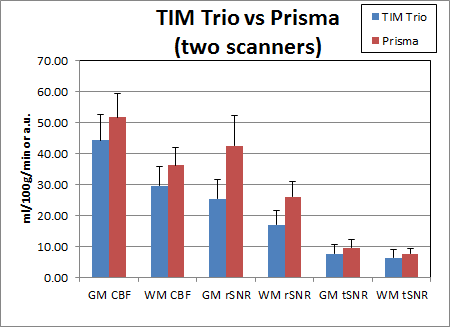
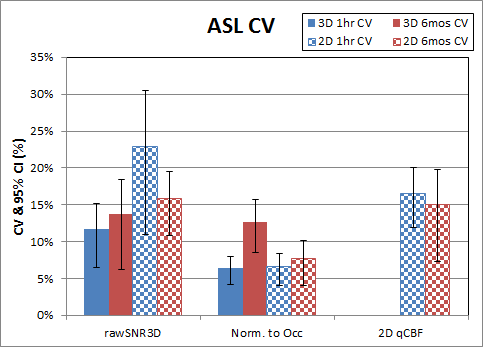
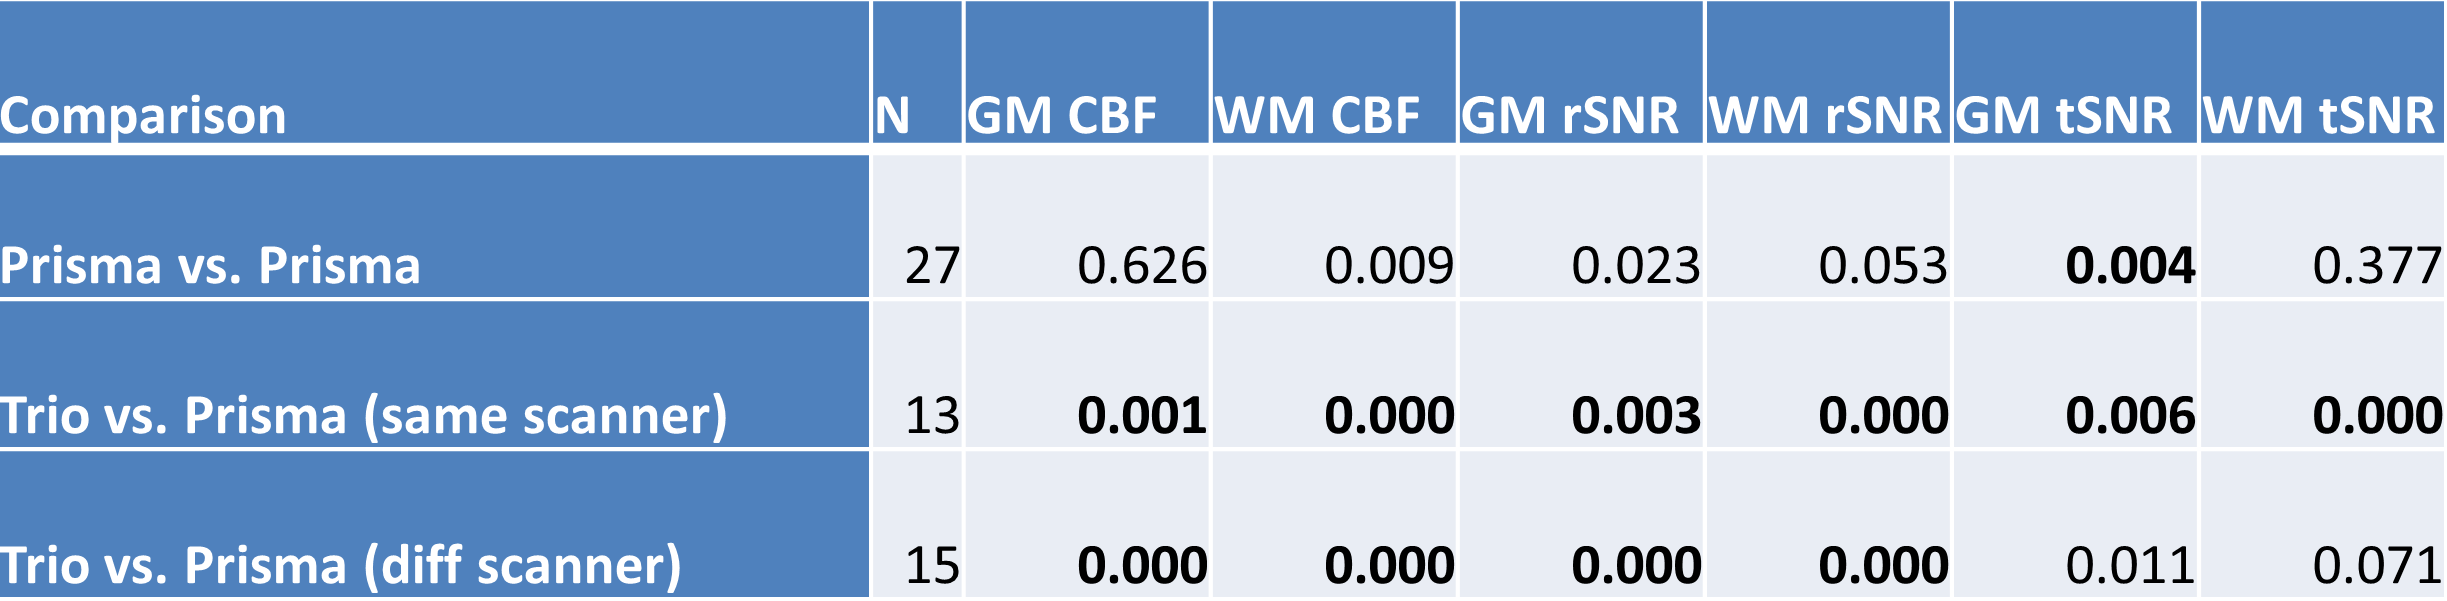
Table 1 shows the p-values of paired t-tests for 2D-pCASL between scanners. Those that exceed the Bonferroni corrected p-value threshold are shown in bold. When both scanners were Prismas, CBF estimates were not statistically different, but tSNRs were significantly different between the two scanners. All metrics, including CBF estimates, were significantly different between Trio and Prisma, regardless of whether it was on the same scanner after 6 months or between two different scanners with an hour. Mean values for these comparisons are shown in Figures 1 & 2, where error bars represent standard deviations. Coefficients of variation (CV) and 95% confidence intervals (CI) for GM rSNR and qCBF from 2D-pCASL and GM rSNR from 3D-PASL are plotted in Figure 3. Normalization to a reference area such as the occipital lobe significantly reduced the CV for both techniques.Discussion
The results from this study demonstrate that while the difference between scanners with similar hardware is comparable to physiological variations, the difference between scanners with different hardware is nontrivial. Although SNR differences between the Trio and the Prisma are expected due to the different hardware and software, the CBF differences are surprising, as systematic differences between scanners were thought to be eliminated by the perfusion quantification process. This hypothesis was not supported by our findings, which suggest that ASL data from different scanners cannot be simply combined without considering the effects of scanner differences, as these will likely be greater than the effect of interest. Care must be taken to remove this confound in order to improve sensitivity to the main effect of interest. Our results also show that normalization to a reference area can reduce CV even more effectively than quantification, and is a viable option to improve sensitivity by minimizing scanner differences.Conclusion
ASL quantification does not remove the confound of scanner differences even in scanners from the same vendor. Care must be taken to account for this when combining data across scanners.Acknowledgements
No acknowledgement found.References
1. Alsop DC, Detre JA, Golay X, et al. Recommended implementation of arterial spin-labeled perfusion MRI for clinical applications: A consensus of the ISMRM perfusion study group and the European consortium for ASL in dementia. Magnetic resonance in medicine 2015;73:102-116.
2. Haller S, Zaharchuk G, Thomas DL, Lovblad KO, Barkhof F, Golay X. Arterial Spin Labeling Perfusion of the Brain: Emerging Clinical Applications. Radiology 2016;281:337-356.
3. Detre JA, Rao H, Wang DJ, Chen YF, Wang Z. Applications of arterial spin labeled MRI in the brain. Journal of magnetic resonance imaging : JMRI 2012;35:1026-1037.
4. Mugler JP, 3rd, Brookeman JR. Three-dimensional magnetization-prepared rapid gradient-echo imaging (3D MP RAGE). Magnetic resonance in medicine : official journal of the Society of Magnetic Resonance in Medicine / Society of Magnetic Resonance in Medicine 1990;15:152-157.
5. Dai W, Garcia D, de Bazelaire C, Alsop DC. Continuous flow-driven inversion for arterial spin labeling using pulsed radio frequency and gradient fields. Magn Reson Med 2008;60:1488-1497.
6. Tan H, Maldjian JA, Pollock JM, et al. A fast, effective filtering method for improving clinical pulsed arterial spin labeling MRI. Journal of magnetic resonance imaging : JMRI 2009;29:1134-1139.
7. Wang Z. Improving cerebral blood flow quantification for arterial spin labeled perfusion MRI by removing residual motion artifacts and global signal fluctuations. Magnetic resonance imaging 2012;30:1409-1415.
8. Liang X, Connelly A, Calamante F. Voxel-Wise Functional Connectomics Using Arterial Spin Labeling Functional Magnetic Resonance Imaging: The Role of Denoising. Brain Connect 2015;5:543-553.
Figures