4199
Variability of B1+ and B0 fields in the human brain at 7T.1Wellcome Centre for Integrative Neuroimaging, FMRIB, Nuffield Department of Clinical Neurosciences, University of Oxford, Oxford, United Kingdom, 2Sir Peter Mansfield Imaging Centre, School of Physics and Astronomy, University of Nottingham, Nottingham, United Kingdom, 3Cardiff University Brain Research Imaging Centre, School of Psychology, Cardiff University, Cardiff, United Kingdom, 4Wolfson Brain Imaging Centre, Department of Clinical Neurosciences, University of Cambridge, Cambridge, United Kingdom, 5Institute of Neuroscience & Psychology, University of Glasgow, Glasgow, United Kingdom
Synopsis
B1+ and B0 whole brain field-maps were collected from three human subjects, on four different 7 tesla scanners. Three different scanner systems from two different vendors were used; all acquisitions used the same RF coil. The data was used to assess the inter-subject and inter-scanner variability, and to calculate typical field values over a range of different brain regions. Systematic difference in B1+ calibration and B0 shimming between scanners were found, necessitating user validated B1+ calibration and B0 shimming for quantitative multi-site studies.
Introduction
Ultra-high field 7 tesla (7T) MRI scanners offer high-resolution, high signal and fast MR imaging.1 However, the transmit RF field (B1+) and static field (B0) homogeneity is reduced compared to lower-field scanners.2 Any quantitative imaging study run across multiple 7T sites, with different scanners, should assess the variation of B1+ and B0 fields.
The UK7T Network is a consortium of UK sites operating 7T human MRI scanners. In a pilot “traveling-heads” study the B1+ and B0 fields produced in three subjects’ brains was measured in four of the network’s scanners. The data will be used to optimize a larger traveling heads study, involving 10 subjects and all five UK7T sites. In this abstract, we use this data to assess: a) the inter-subject variability on each scanner, b) the inter-scanner variability, and c) the range of field values expected at 7T in different brain regions.
Methods
Acquisition
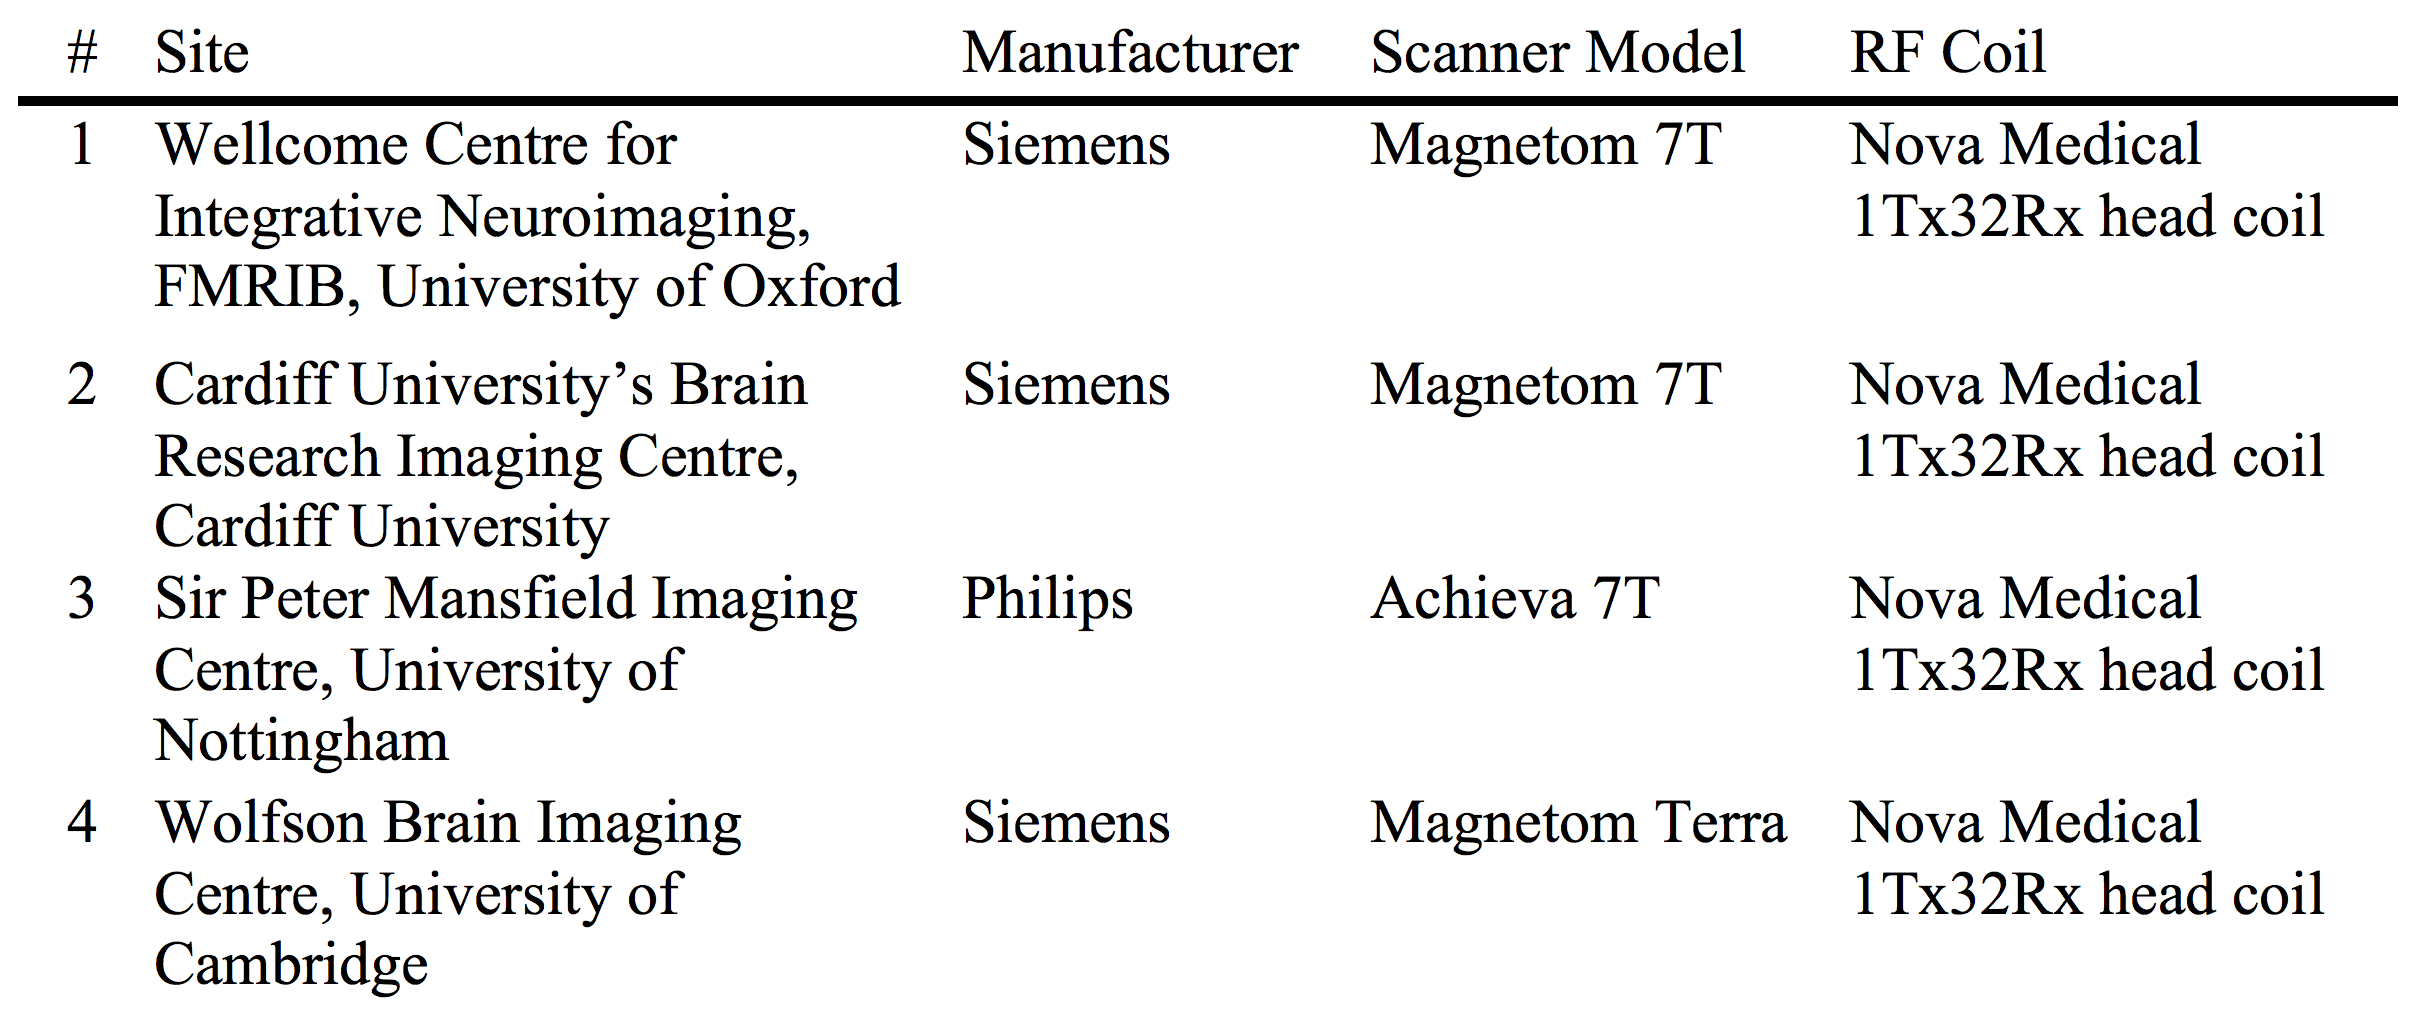
Three subjects (male, 31±4 years, 78±7 kg) were scanned at four sites with 7T MRI scanners (Table 1).
After transmit calibration using the normal on-site method (spin-echo, stimulated-echo based), B1+ fields were measured using a 3DREAM sequence.3,4 The preparation pulse voltage was recorded to allow calculation of the B1+ per unit-drive-voltage.
B0 fields were measured using a dual-echo 2D GRE sequence after vendor-supplied whole-brain shimming.
0.7 mm isotropic MPRAGE data was used for brain masking and image registration.
Analysis
The B1+ and B0 maps from each subject were registered and interpolated to the subject’s MPRAGE scan using FSL’s FLIRT (no search).5 Brain masks were created with FSL BET.6
To assess inter-subject variability, the whole brain distributions of B1+ and B0, in each subject, were calculated and expressed as a mean ± standard deviation (SD). The B1+ and B0 scans of each subject were registered to MNI 2mm space using FSL FLIRT and FNIRT.7-9 The mean voxel-wise SD in MNI space was calculated.
To assess inter-scanner variability, FLIRT (with 12 DOF) was used to register each subject to an average subject space. For each subject, the per-voxel mean and SD of the B1+ and B0 maps across the four scanners was calculated. The all-subject voxel-wise distribution was plotted to check for systematic differences between scanners.
To provide standard range values, the average field values in different anatomical regions of the brain (FSL MNI structural atlas) were calculated from the MNI registered field-maps.10
Results
Inter-subject
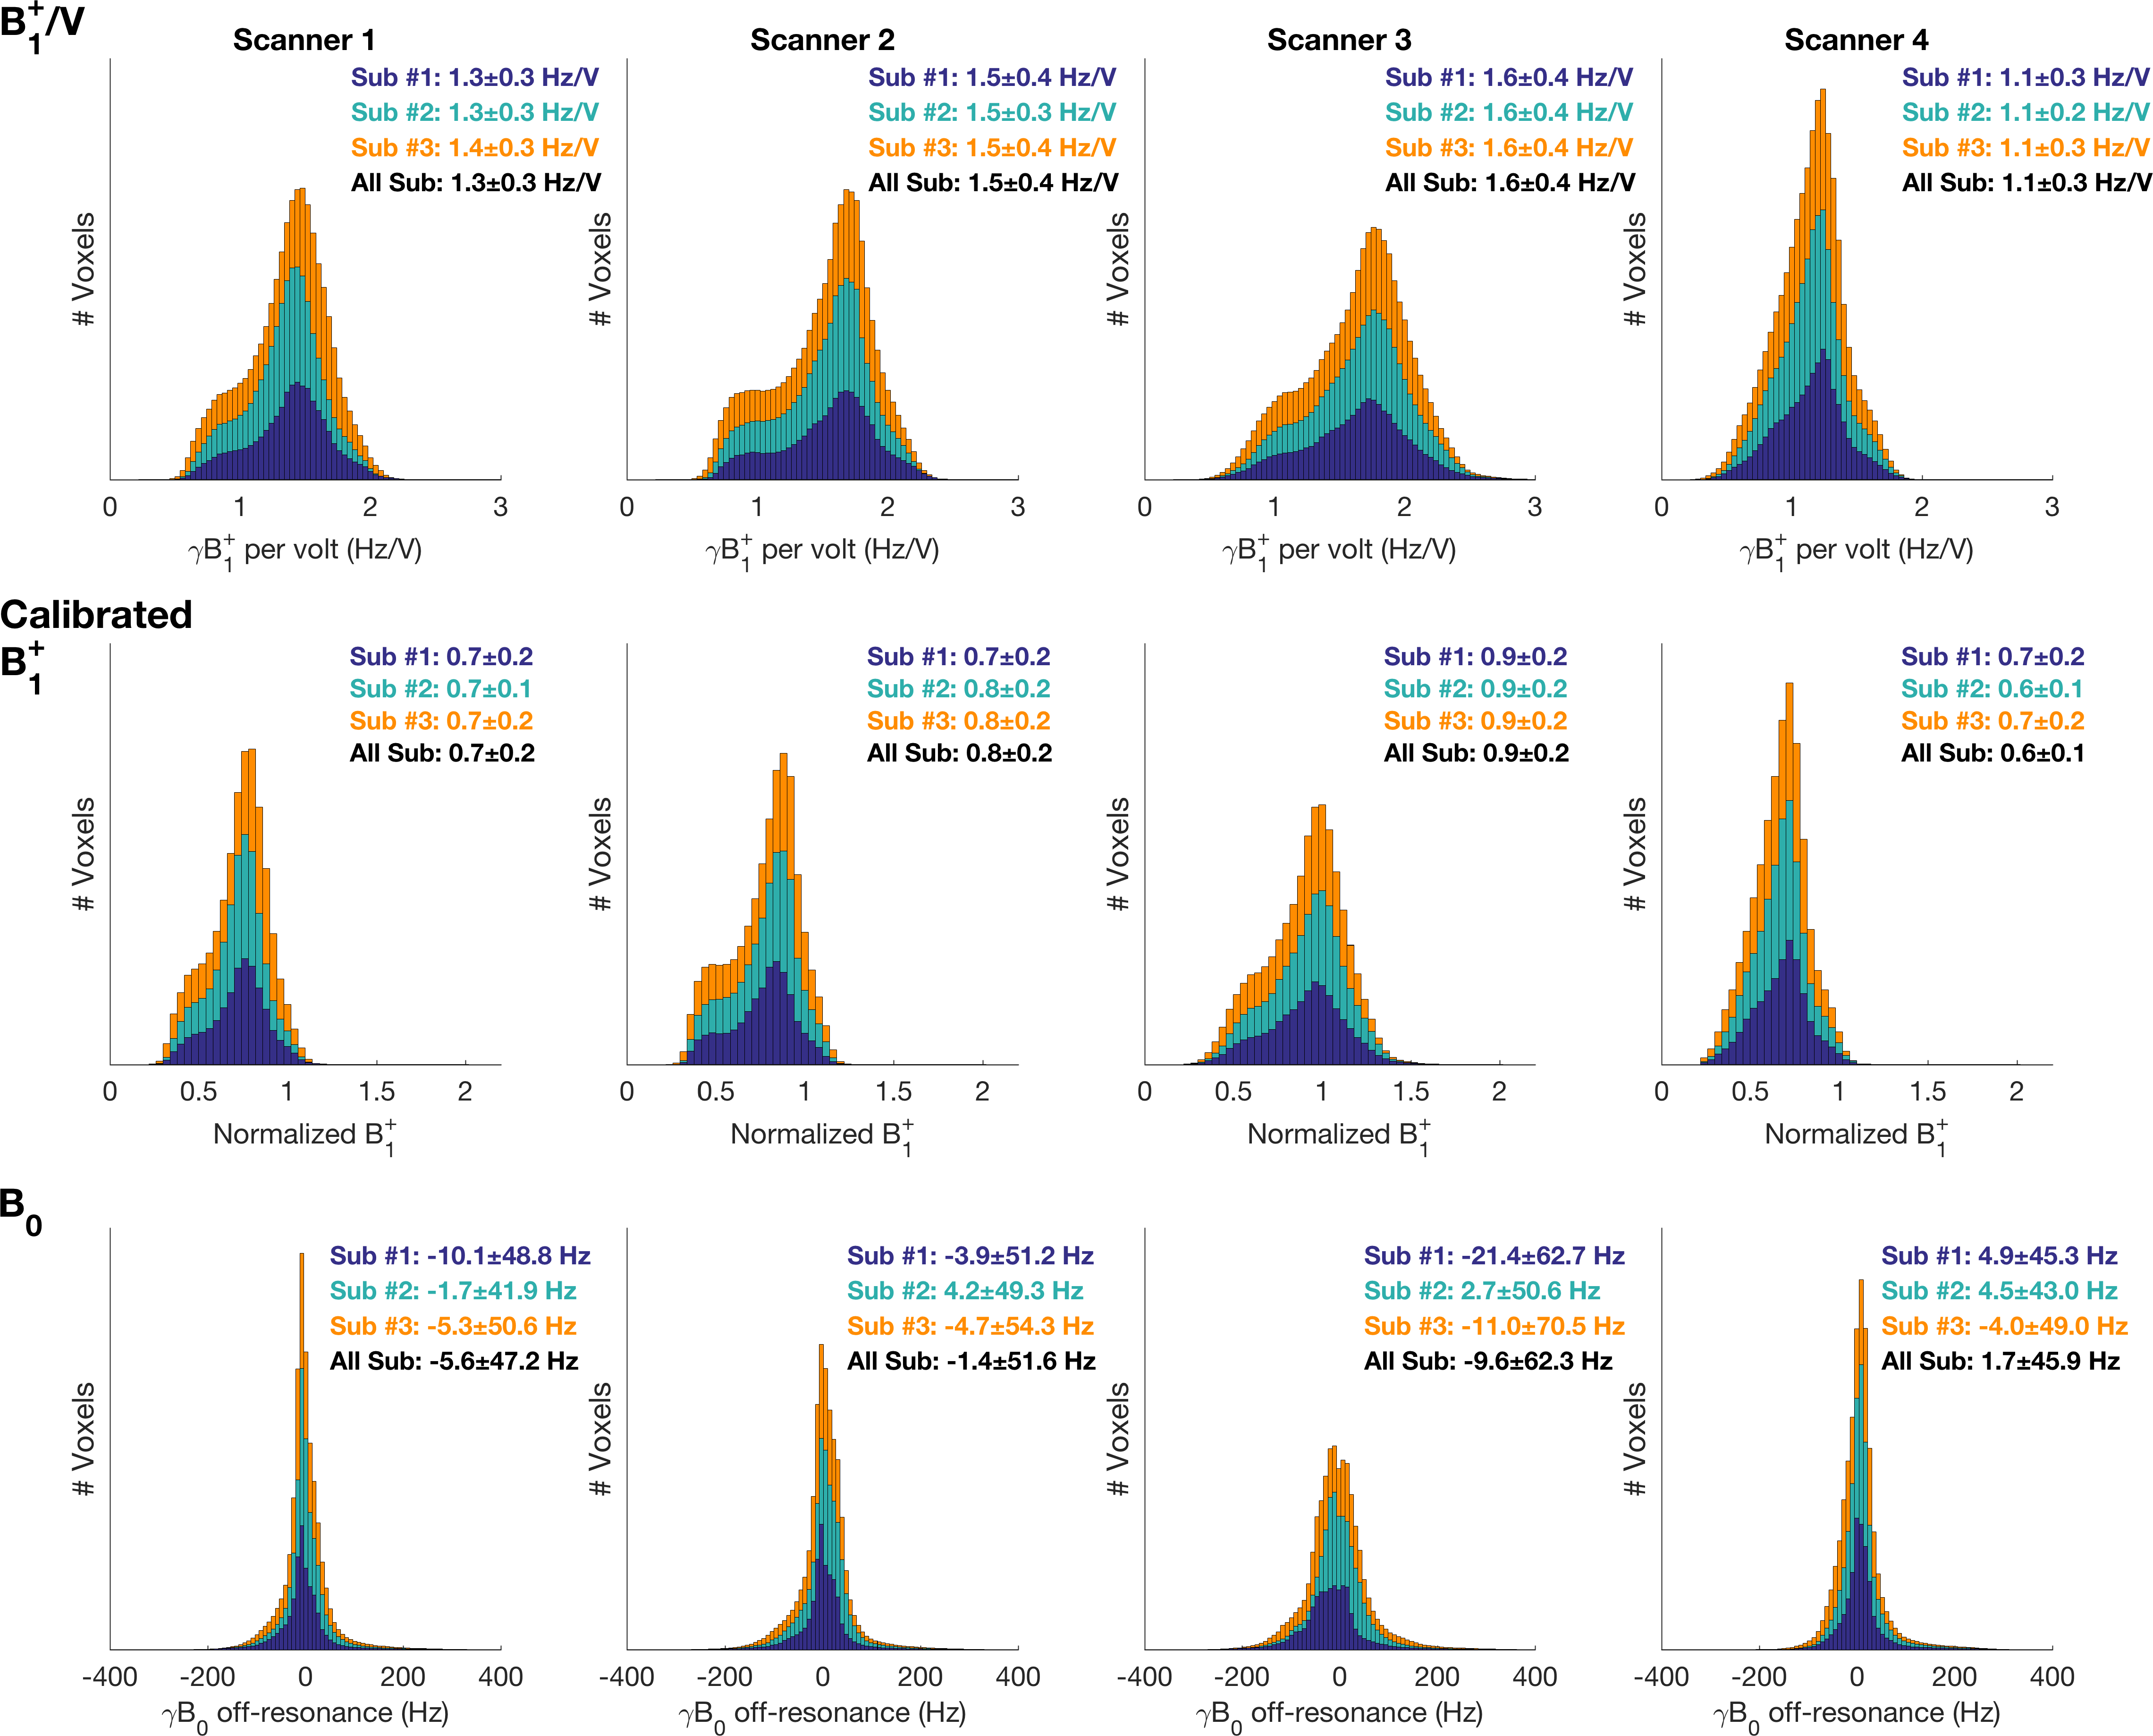
The whole brain distributions of B1+, and B0, of each subject, on each scanner, are shown in Figure 1. The mean B1+ differed by no more than 0.1 Hz/V between subjects across scanners.
The mean voxel-wise B1+/V standard deviation across subjects was 0.09 Hz/V [0.10 (Oxford), 0.10 (Cardiff), 0.11 (Cambridge), 0.06 (Nottingham)]. For B0 the value was 34 Hz [43 (Oxford), 40 (Cardiff), 31 (Cambridge), 22 (Nottingham)].
Inter-scanner
The mean whole brain B1+ values in each scanner were (Figure 1): Oxford 1.3 Hz/V, Cardiff 1.5 Hz/V, Cambridge 1.6 Hz/V, and Nottingham 1.1 Hz/V. After calibration, the normalized values ranged from 0.6 to 0.9. The standard deviation of B0 values were: Oxford 47 Hz, Cardiff: 51 Hz, Cambridge: 62 Hz, and Nottingham 45 Hz.
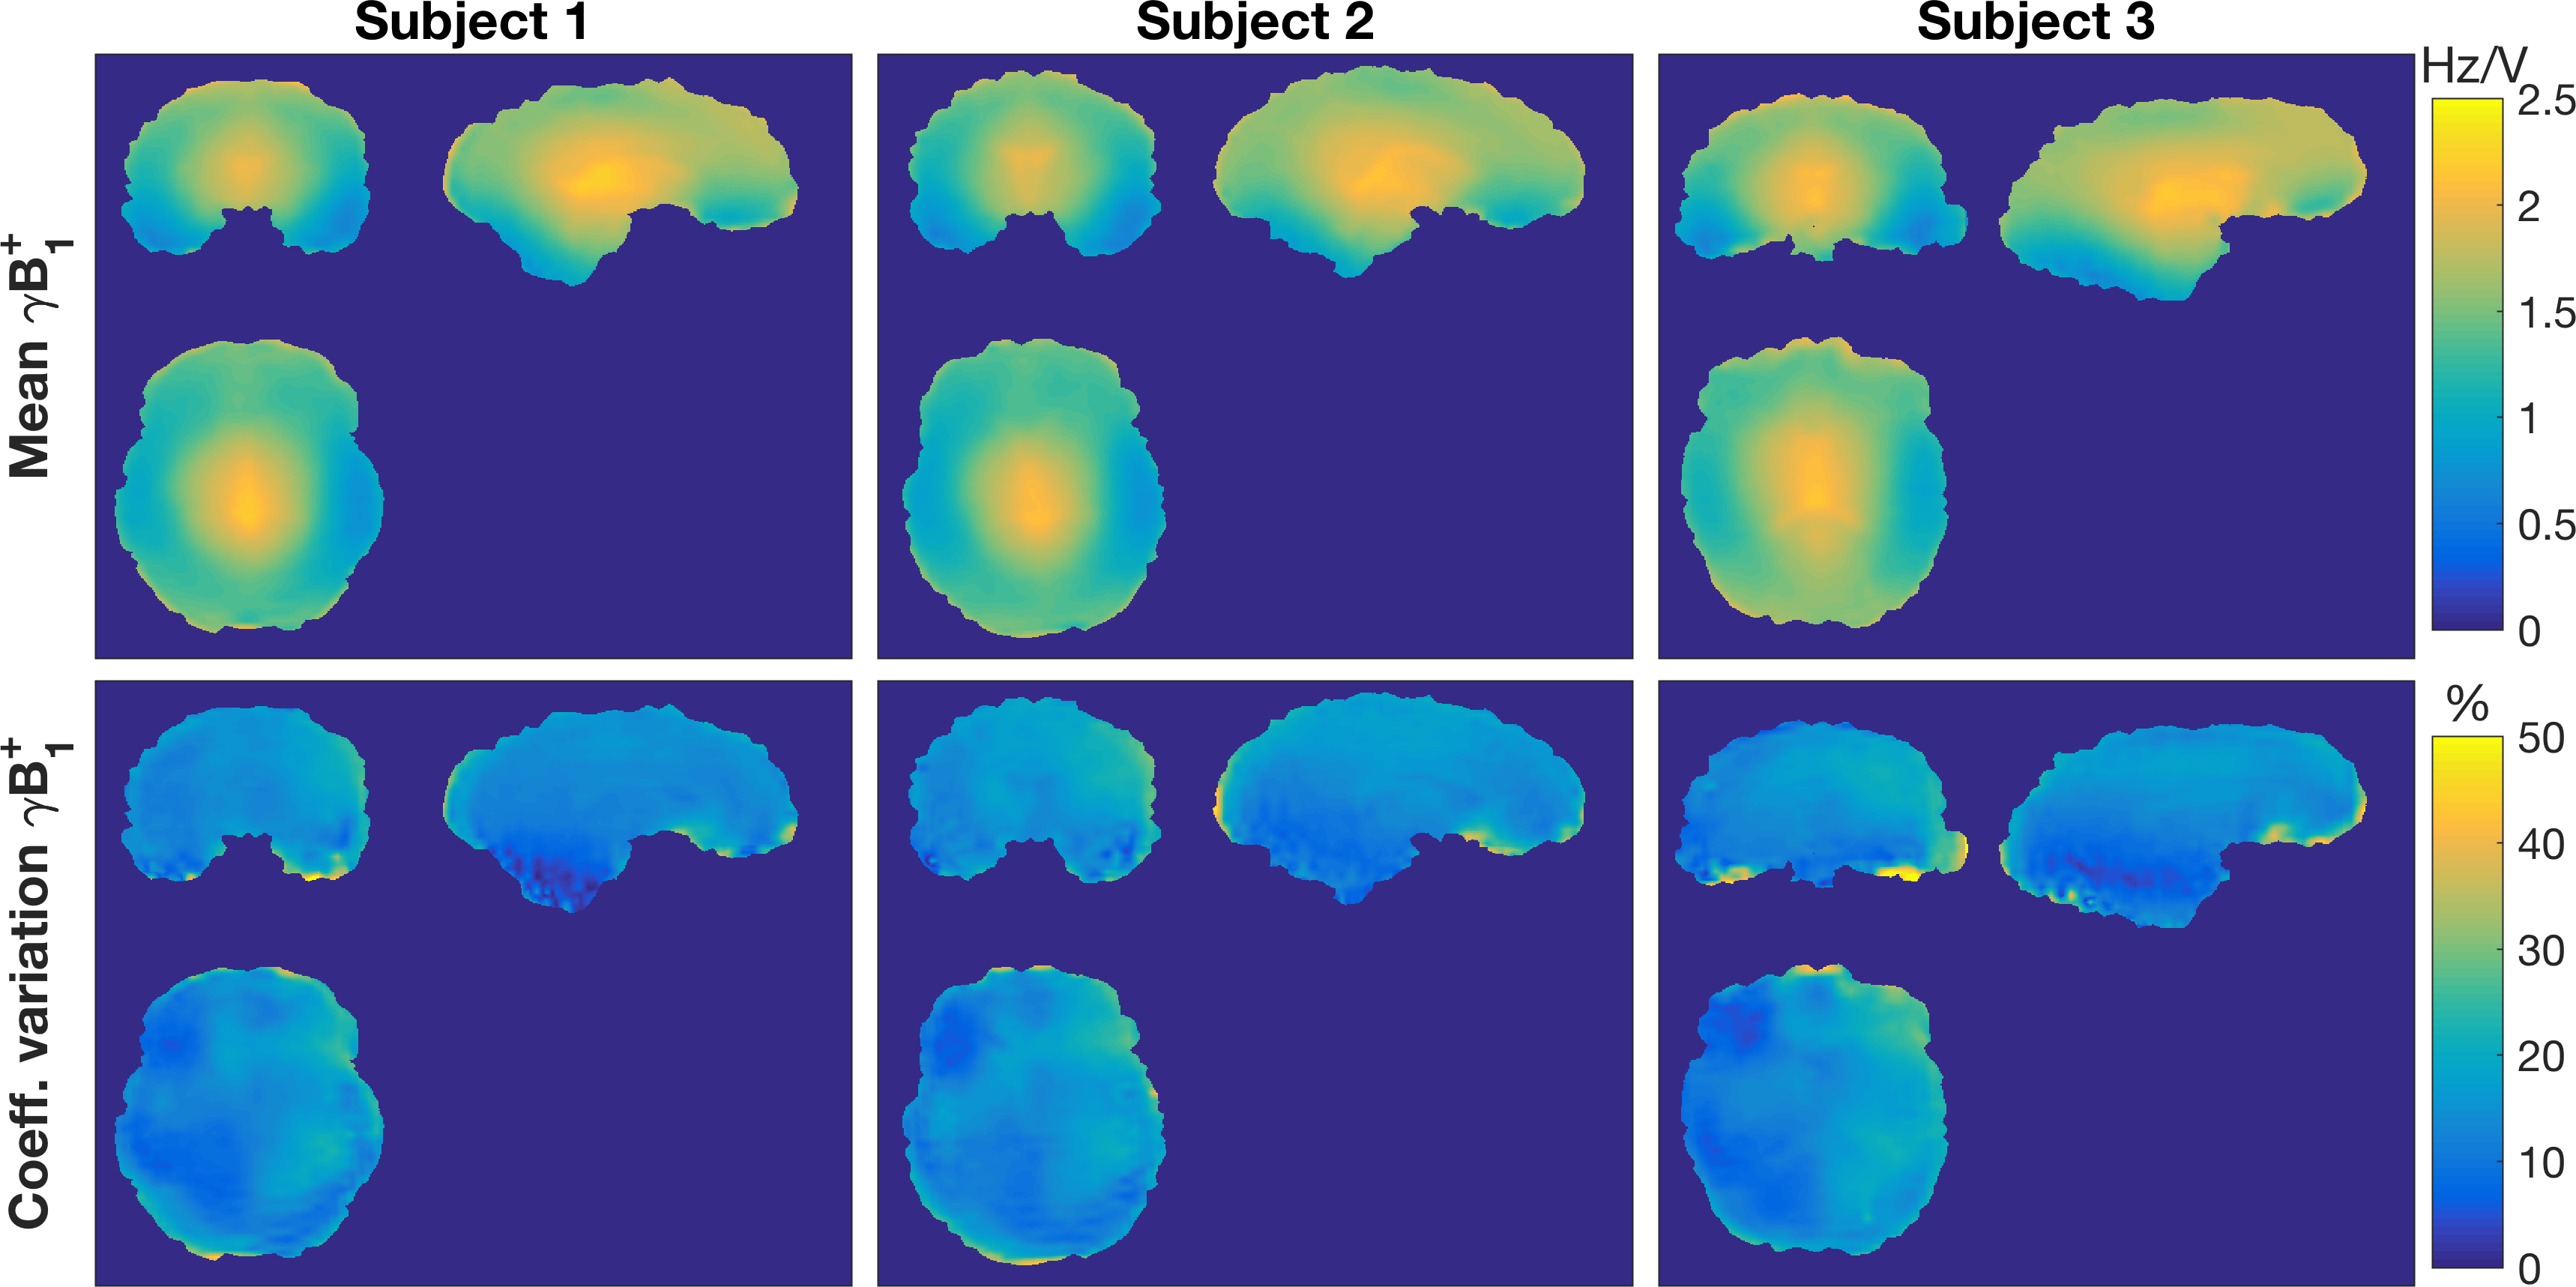
The voxel-wise comparison of B1+ in each subject across scanners (Figure 2), shows a mean 15% coefficient of variation. The mean-value-maps in each subject are qualitatively similar.
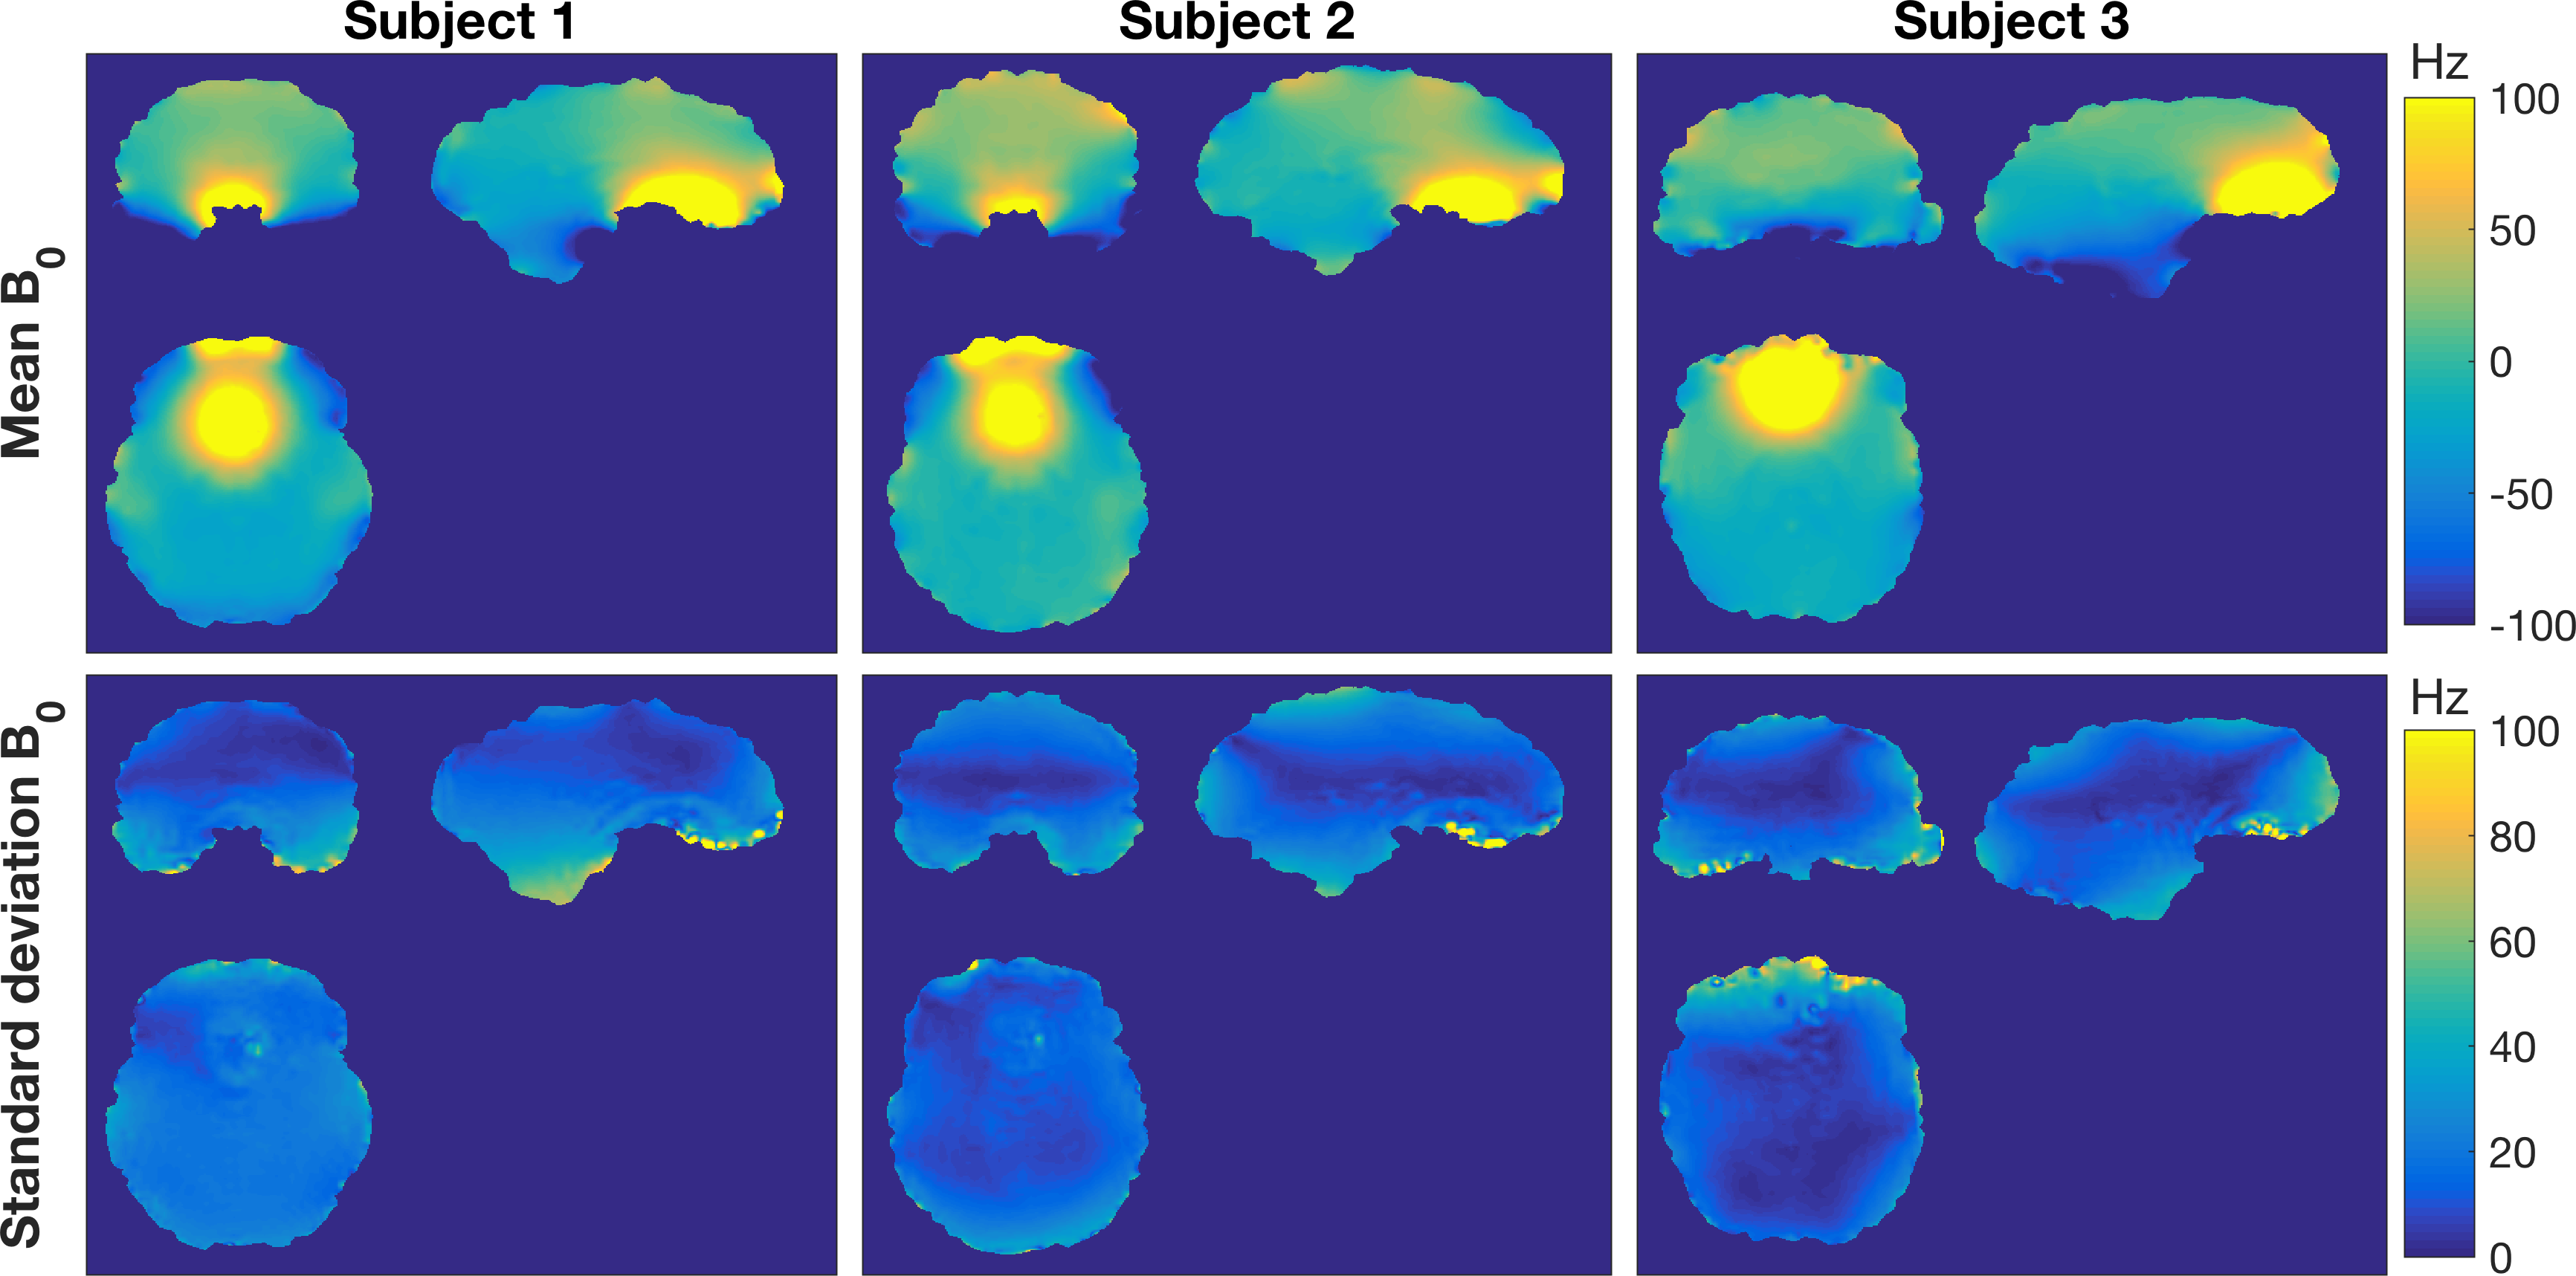
The voxel-wise comparison of B0 (Figure 3) also shows qualitatively similar mean-value-maps. However, whilst the mean voxel SD was low (5 Hz), the SD typically shows variation in off-resonance frequency >20 Hz in the superficial and inferior regions of the brain.
Standard ranges
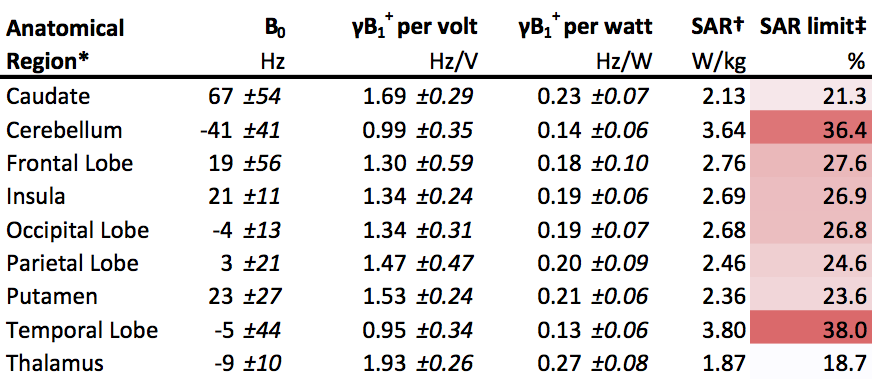
The mean (±SD) B0, B1+ and SAR values for an example pulse, in each atlas defined region of the brain, are given in Table 2.
Discussion
No large systematic differences were found in mean B0 fields measured in this study. Inter-scanner variance was similar, except for the Cambridge site where the vendor shim resulted in a greater range of B0 across the whole brain.
Systematic differences in B1+/V between scanners, of up to 0.5 Hz/V, were observed. After the calibration step, differences remained. It is therefore important to use a user-validated calibration which has been made consistent across scanners.
B1+ field magnitude, as a function of position, is in agreement with previously reported data.11 Central brain regions have the highest B1+, whilst inferior regions (e.g. the cerebellum) and the temporal lobes have the lowest B1+ fields.
Conclusion
The variation of B1+ and B0 fields in the brains of three human volunteers at four 7T sites has been reported. Systematic differences are apparent and user validated calibration should be undertaken for cross-site comparison.Acknowledgements
The UK7T Network is funded by the MRC. [MR/N008537/1]References
1. Kraff O, Quick HH. 7T: Physics, safety, and potential clinical applications. J Magn Reson Imaging. 2017.
2. Vaidya MV, Collins CM, Sodickson DK, Brown R, Wiggins GC, Lattanzi R. Dependence of B1+ and B1- Field Patterns of Surface Coils on the Electrical Properties of the Sample and the MR Operating Frequency. Concepts Magn Reson Part B Magn Reson Eng. 2016;46:25-40.
3. Brenner D, Tse DHY, Pracht ED, Feiweier T, Stirnberg R, Stöcker T: 3DREAM – A Three-Dimensional Variant of the DREAM Sequence. Proceedings of the 22nd Annual Meeting of the International Society for Magnetic Resonance in Medicine; Milan, Italy. 2014: 1455.
4. Nehrke K, Bornert P. DREAM--a novel approach for robust, ultrafast, multislice B(1) mapping. Magn Reson Med. 2012;68:1517-1526.
5. Jenkinson M, Smith S. A global optimisation method for robust affine registration of brain images. Med Image Anal. 2001;5:143-156.
6. Smith SM. Fast robust automated brain extraction. Hum Brain Mapp. 2002;17:143-155.
7. Grabner G, Janke AL, Budge MM, Smith D, Pruessner J, Collins DL. Symmetric atlasing and model based segmentation: an application to the hippocampus in older adults. Med Image Comput Comput Assist Interv. 2006;9:58-66.
8. Jenkinson M, Beckmann CF, Behrens TE, Woolrich MW, Smith SM. Fsl. Neuroimage. 2012;62:782-790.
9. Andersson JLR, Jenkinson M, Smith S. Non-linear registration, aka spatial normalisation. FMRIB technical report TR07JA2. 2010.
10. Mazziotta J, Toga A, Evans A, Fox P, Lancaster J, Zilles K, et al. A probabilistic atlas and reference system for the human brain: International Consortium for Brain Mapping (ICBM). Philos Trans R Soc Lond B Biol Sci. 2001;356:1293-1322.
11. Vaughan, J. T., et al. (2001). 7T vs. 4T: RF power, homogeneity, and signal-to-noise comparison in head images. Magn Reson Med 46(1): 24-30.
Figures