4189
Evaluation of Macrocyclic Gadolinium-Based Contrast Agent Retention in a Longitudinal Multiple Sclerosis Study1CREATIS Laboratory, Université Claude Bernard - Lyon 1, Lyon, France, 2Nehme and Therese Tohme Multiple Sclerosis Center, American University of Beirut, Beirut, Lebanon, 3Centre Hospitalier Lyon-Sud - Service de Radiologie, Hospices Civils de Lyon, Lyon, France, 4Hôpital Neurologique - Service de Neurologie A, Hospices Civils de Lyon, Lyon, France, 5CERMEP - Imagerie du Vivant, Université de Lyon, Lyon, France
Synopsis
Gadolinium-based contrast agents (GBCA) are commonly used to identify blood-brain-barrier disruption. Recent studies reported gadolinium deposition in deep gray matter (GM) structures, following serial injections of linear complexes of GBCA. While it is recognized that linear complexes of GBCA may lead to gadolinium retention in brain, macrocyclic GBCA should also be evaluated. In this study, we investigated the effect of serial macrocyclic GBCA injections in 92 Multiple Sclerosis patients followed during seven years. Our results did not show any significant signal intensity changes in deep GM structures, and particularly in the dentate nuclei and the globus pallidus.
Introduction
Magnetic resonance imaging is a sensitive technique allowing the detection and the characterization of pathological processes occurring in numerous neurological diseases such as multiple sclerosis (MS). The use of gadolinium based contrast agents (GBCA) allows to detect blood brain barrier disruptions since gadolinium decrease the T1 relaxation time. However, several studies showed a gadolinium deposition in brain structures, and particularly in the dentate nuclei (DN) and the globus pallidus (GP), following repeated GBCA injections. The first study reporting a gadolinium deposition in the brain was published in 2014, and pointed out a correlation between the cumulative amount of injected GBCA and the signal intensity in DN and GP. [1] Following this first report, several studies showed gadolinium deposition after serial injections of linear complex of GBCA. [2, 3, 4] In contrast, the analysis performed on patients with injections of macrocyclic GBCA were not able to demonstrate gadolinium deposition. [5, 6, 7] As free gadolinium is cytotoxic, it is crucial to investigate the safety of macrocyclic GBCA injections in longitudinal studies. Therefore, we measured the T1 signal intensity in several deep gray matter (GM) structures of MS patients followed during seven years with repeated injections of macrocyclic GBCA. Material and Methods
Material and Methods
Participants
Ninety-two MS patients (12 Clinical Isolated Syndrome, 30 Relapsing Remitting, 29 Secondary Progressive, and 21 Primary Progressive, mean age = 37.7 [21.0 - 50.1] years) were included in this study. Patients were first examined twice a year during 3 years and then once a year during 4 years. For each examination, patients received a macrocyclic GBCA injection (Dotarem, Guerbet). This study was approved by the local ethics committee (CPP Sud-Est IV) and the French national agency for medicine and health products safety (ANSM).
MRI Acquisitions
MS patients underwent MRI examinations at CERMEP-Imagerie du vivant on a 1.5T Siemens Sonata system (Siemens Medical Solution, Erlangen, Germany) using an 8-channel head-coil. The MR protocol consisted in the acquisition of several conventional (with and without GBCA injection) and advanced MRI sequences. For the purpose of this study we only used the un-enhanced 3D-T1 sequence (1×1×1 mm$$$^{3}$$$, TE/TR/TI = 4/2000/1100ms) oriented in the AC-PC plane.
Image Processing
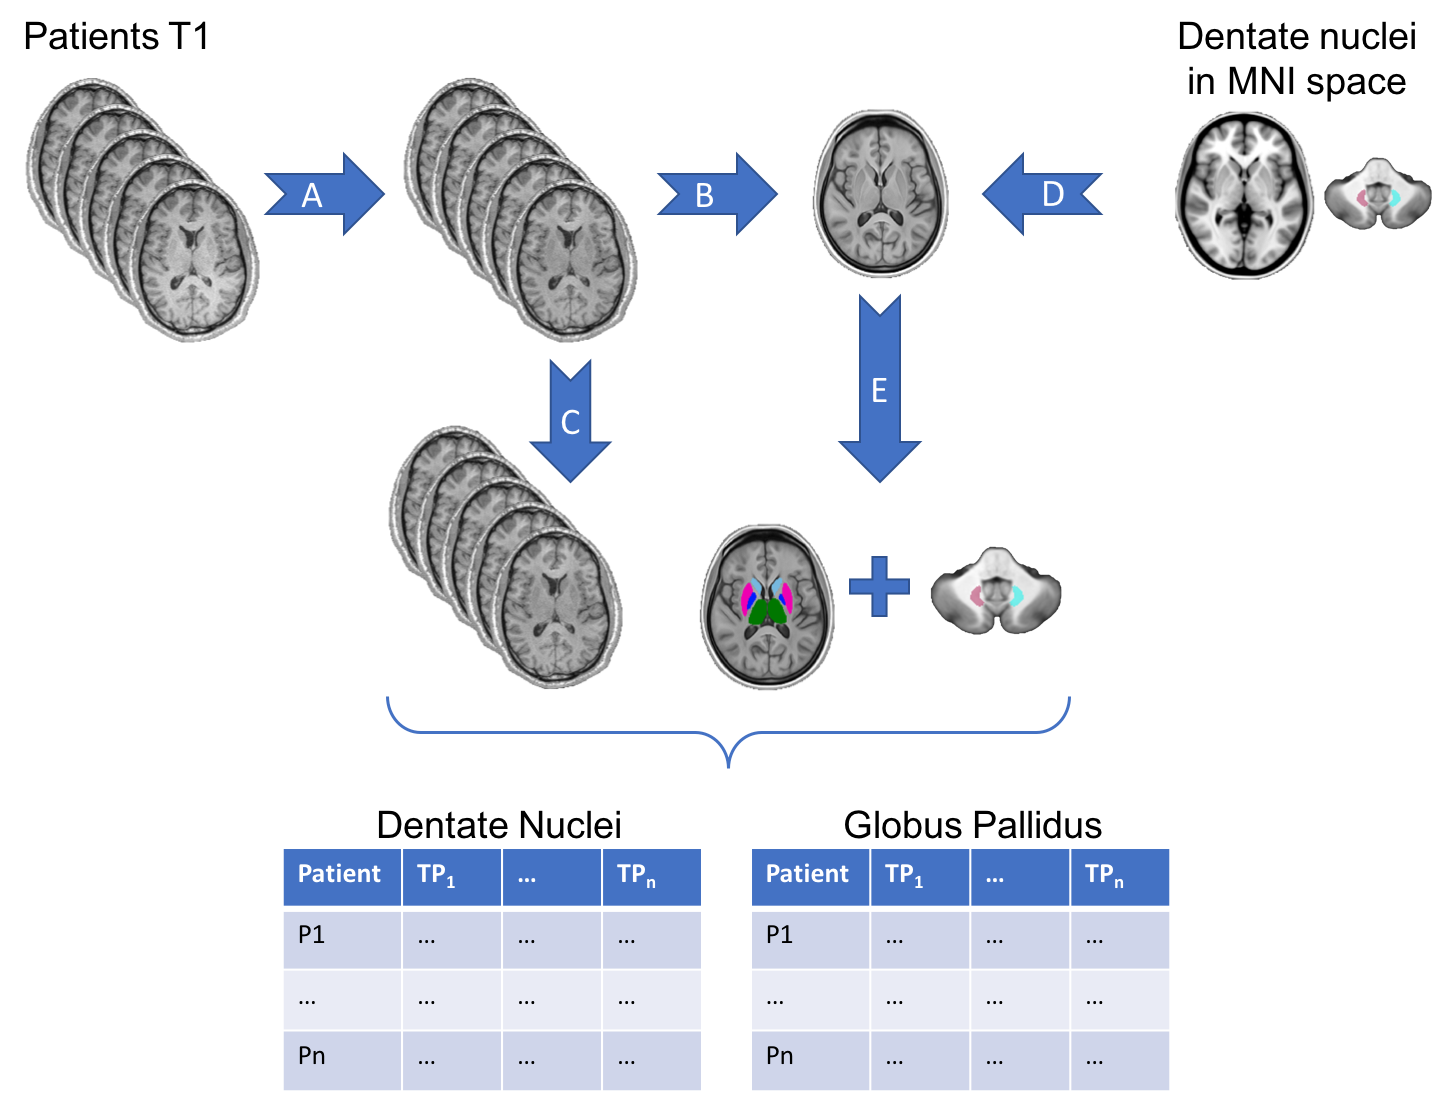
Image processing consisted in six steps as illustrated in figure 1. i.) The T1w images were reoriented in the standard space using FSL. [8] ii.) Each image was corrected for B1 inhomogeneity using ANTs. [9] iii.) The first images of each patient were then used to generate a first patient-specific template using the multivariate template construction script provided in ANTs toolbox. [10] This template was used to generate a second patient-specific template based on all patient’s exams. iv.) The signal intensity of T1w images was normalized using the last template and the “histogram-matching” method included in ANTs. v.) This template was used for the segmentation procedure of deep GM structures using FSL-Anat and for the coregistration of the dentate nuclei map, available in the MNI space. [11] vi.) All brain and cerebellar GM structures were transformed to each patient image space in order to measure the T1 signal intensity.
A region of interest (ROI) was manually delineated in the semi-oval (SO) white matter and in the cerebellar peduncles (CP). Ratios of T1w signal intensity were calculated from the ROIs defined in DN compared to CP and of GP, thalamus, putamen, caudate nucleus, accumbens nucleus, hippocampus, and amygdala compared to SO.
Statistics
A repeated-measures ANOVA was applied to analyze the variation of signal intensity in different GM structures with the longitudinal GBCA injections. As the initial signal intensity may vary between patients, we included in the model a random intercept by participant. Statistical analysis was conducted in R with a significance level of 5%.
Results
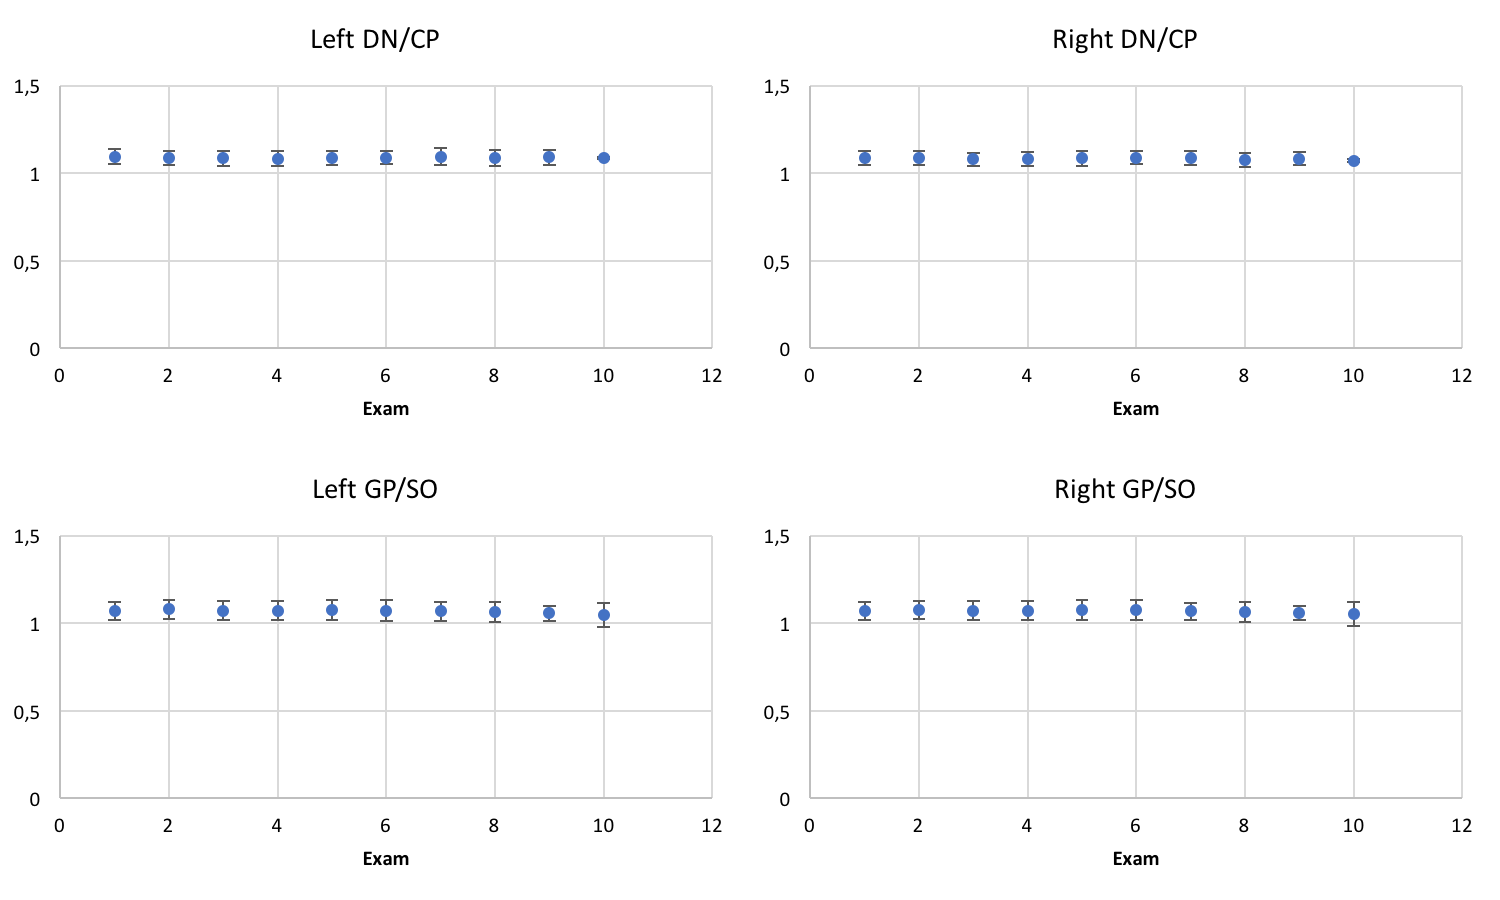
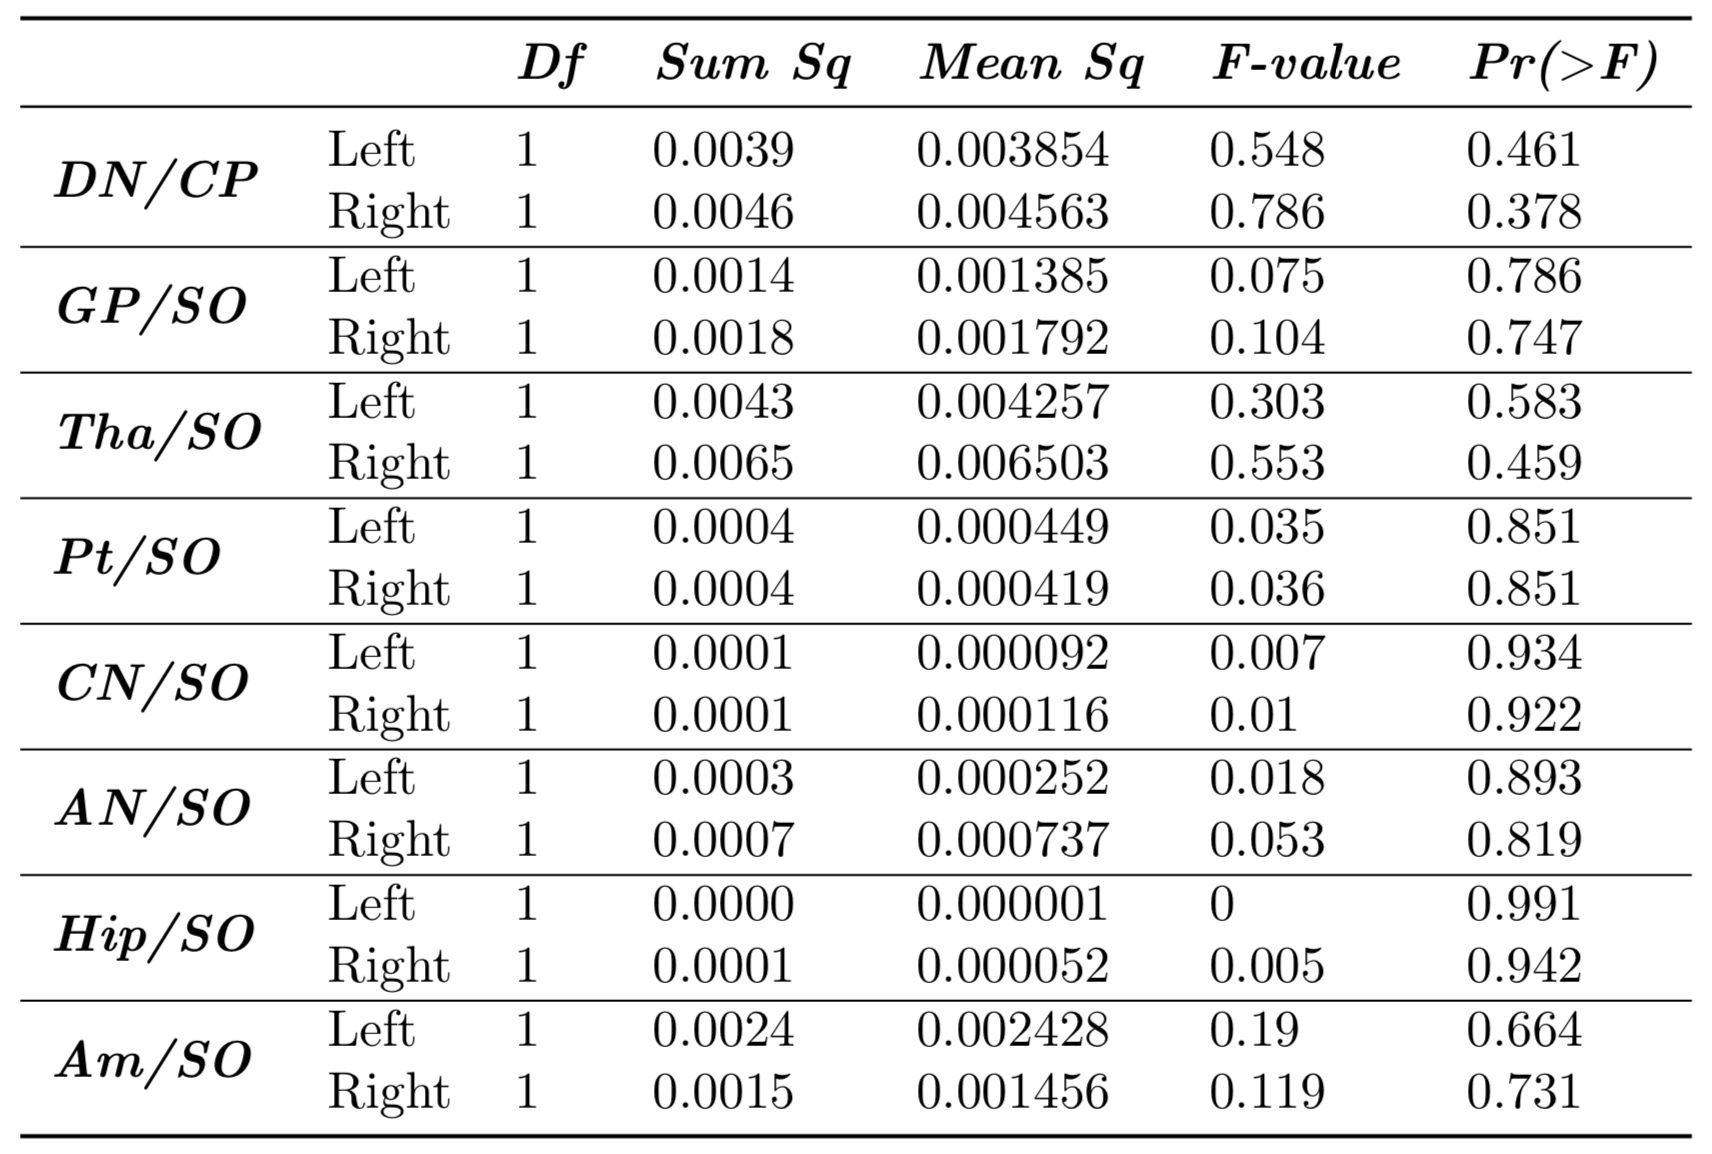
Results of the repeated-measures ANOVA analysis are reported in Table 1. For all regions of interest, there was no significant effect of GBCA injections on T1w image signal intensity. Figure 2 represent the evolution of the left and right DN/CP and GP/SO signal intensity ratios along the seven years of the follow-up.Discussion - Conclusion
The analysis of different brain and cerebellar regions did not show any significant changes in T1 signal intensity with the increased number of macrocyclic GBCA injections. In particular, the cerebellar DN and the brain GP, two structures which have been reported to be sensitive for gadolinium deposition after linear GBCA injection, did not show any T1 signal intensity changes along the seven years of the follow-up. These results support the hypothesis that macrocyclic forms of GBCA do not lead to a gadolinium retention in brain.Acknowledgements
This work was performed within the framework of the LABEX PRIMES (ANR-11-LABX-0063) of Université de Lyon, within the program "Investissements d'Avenir" (ANR-11-IDEX-0007) operated by the French National Research Agency (ANR).References
[1] T. Kanda, K. Ishii, H. Kawaguchi, K. Kitajima, and D. Takenaka, “High Signal Intensity in the Dentate Nucleus and Globus Pallidus on Unenhanced T1-weighted MR Images: Relationship with Increasing Cumulative Dose of a Gadolinium-based Contrast Material,” Radiology, vol. 270, no. 3, pp. 834–841, 2014.
[2] R. J. McDonald, J. S. McDonald, D. F. Kallmes, M. E. Jentoft, D. L. Murray, K. R. Thielen, E. E. Williamson, and L. J. Eckel, “Intracranial Gadolinium Deposition after Contrast-enhanced MR Imaging,” Radiology, vol. 275, no. 3, pp. 772–782, 2015.
[3] Y. Errante, V. Cirimele, C. A. Mallio, V. Di Lazzaro, B. B. Zobel, and C. C. Quattrocchi, “Progressive Increase of T1 Signal Intensity of the Dentate Nucleus on Unenhanced Magnetic Resonance Images Is Associated with Cumulative Doses of Intravenously Administered Gadodiamide in Patients with Normal Renal Function, Suggesting Dechelation.,” Investigative radiology, pp. 1–6, 2014.
[4] J. Ramalho, M. Castillo, M. Al Obaidy, R. H. Nunes, M. Ramalho, B. M. Dale, and R. C. Semelka, “High Signal Intensity in Globus Pallidus and Dentate Nucleus on Unenhanced T1-weighted MR Images: Evaluation of Two Linear Gadolinium-based Contrast Agents.,” Radiology, vol. 276, no. 3, pp. 836–44, 2015.
[5] Y. Cao, D. Q. Huang, G. Shih, and M. R. Prince, “Signal change in the dentate nucleus on T1-weighted MR images after multiple administrations of gadopentetate dimeglumine versus gadobutrol,” American Journal of Roentgenology, vol. 206, no. 2, pp. 414–419, 2016.
[6] A. Radbruch, L. D. Weberling, P. J. Kieslich, J. Hepp, P. Kickingereder, W. Wick, H.-P. Schlemmer, and M. Bendszus, “High-Signal Intensity in the Dentate Nucleus and Globus Pallidus on Unenhanced T1-Weighted Images,” Investigative Radiology, vol. 50, pp. 805–810, dec 2015.
[7] E. Tedeschi, G. Palma, A. Canna, S. Cocozza, C. Russo, P. Borrelli, R. Lanzillo, V. Angelini, E. Postiglione, V. B. Morra, M. Salvatore, A. Brunetti, and M. Quarantelli, “In vivo dentate nucleus MRI relaxometry correlates with previous administration of Gadolinium-based contrast agents,” European Radiology, vol. 26, no. 12, pp. 4577–4584, 2016.
[8] M. Jenkinson, C. F. Beckmann, T. E. Behrens, M. W. Woolrich, and S. M. Smith, “Fsl,” NeuroImage, vol. 62, no. 2, pp. 782–790, 2012.
[9] N. J. Tustison, B. B. Avants, P. A. Cook, Y. Zheng, A. Egan, P. A. Yushkevich, and J. C. Gee, “N4ITK: Improved N3 Bias Correction,” IEEE Transactions on Medical Imaging, vol. 29, no. 6, pp. 1310–1320, 2010.
[10] B. B. Avants, N. J. Tustison, G. Song, P. A. Cook, A. Klein, and J. C. Gee, “A reproducible evaluation of ANTs similarity metric performance in brain image registration,” NeuroImage, vol. 54, no. 3, pp. 2033–2044, 2011.
[11] J. Diedrichsen, J. H. Balsters, J. Flavell, E. Cussans, and N. Ramnani, “A probabilistic MR atlas of the human cerebellum,” NeuroImage, vol. 46, no. 1, pp. 39–46, 2009.
Figures