4186
B1+ and Temperature Analysis in Two UHF RF Coils1Bioengineering, University of Pittsburgh, Cranberry Twp, PA, United States, 2Bioengineering, University of Pittsburgh, Pittsburgh, PA, United States, 3University of Pittsburgh, Pittsburgh, PA, United States, 4Radiology, University of Pittsburgh, Pittsburgh, PA, United States
Synopsis
Our work makes a comparison of the RF performance of a TEM resonator and a TTT coil on a 2-compartment agar phantom. While the results show lower B1+/RF power efficiency for the TTT coil when compared to the TEM coil, the temperature rise in the TEM coil is higher (resulting in lower B1+/SAR efficiency) for a fixed average B1+ intensity across the volume of the coil load.
Synopsis
Our work makes a comparison of the RF performance of a TEM resonator and a TTT coil on a 2-compartment agar phantom. While the results show lower B1+/RF power efficiency for the TTT coil when compared to the TEM coil, the temperature rise in the TEM coil is higher (resulting in lower B1+/SAR efficiency) for a fixed average B1+ intensity across the volume of the coil load.Introduction
In this work, we assess the temperature rise of a dual water-doped rectangular-shaped phantom in two RF head coils. A 16-strut TEM resonator1 and a Tic-Tac-Toe2 RF coils are used at 7T to assess the RF temperature rise as well as the average B1+ field intensity. The experimental temperature rise is measured in each phantom using fiber optic probes while the B1+ field intensity/distribution is assessed using B1+ mapping sequence.Methods
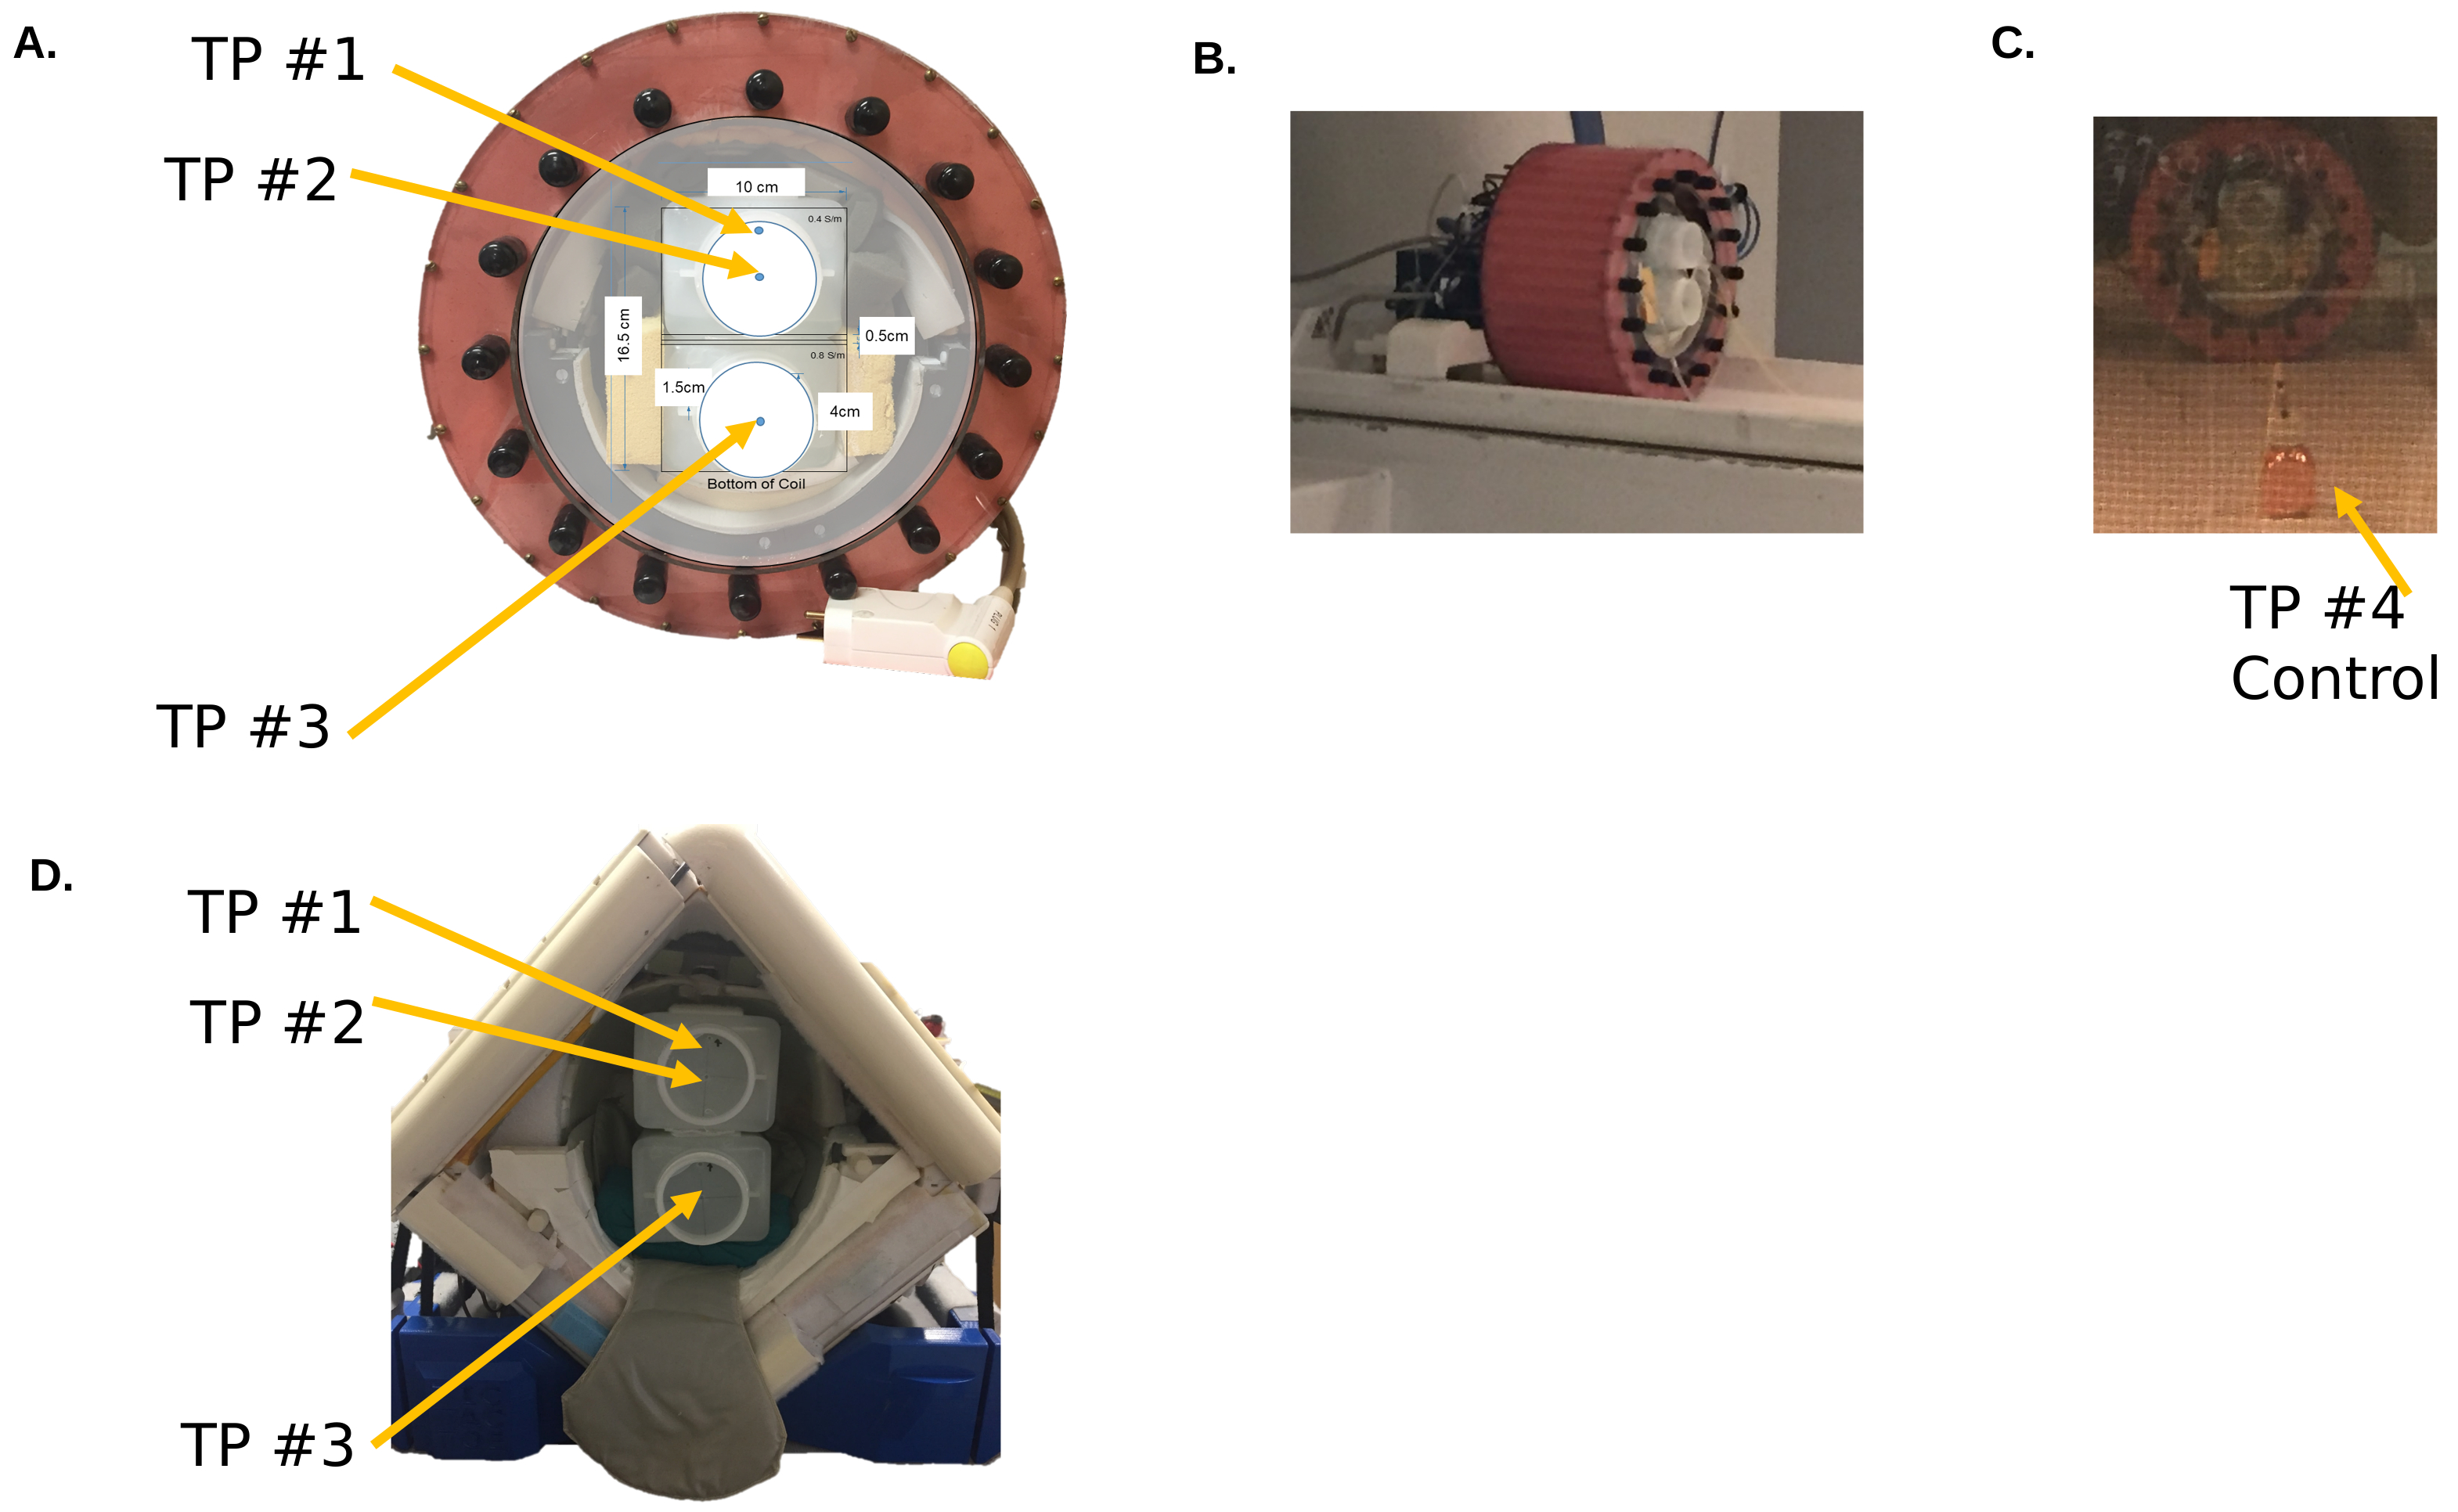
Rectangular-shaped water phantoms were made with concentrations of NaCl, H20 and agar (dielectric constant = 79.0, σ = 0.4 S/m & σ = 0.8 S/m in separate bottles). The temperature rise within the phantoms were observed. A control phantom (shown in Figure 1C) was made with the same materials (constant = 79.0, σ = 0.4 S/m). All dielectric measurements (both dielectric constant and conductivity were taken using the DAK measurement probe (AG SPE, Zurich, Switzerland) calibrated at 297.2 MHz with a 3 MHz span and 0.1 resolution.
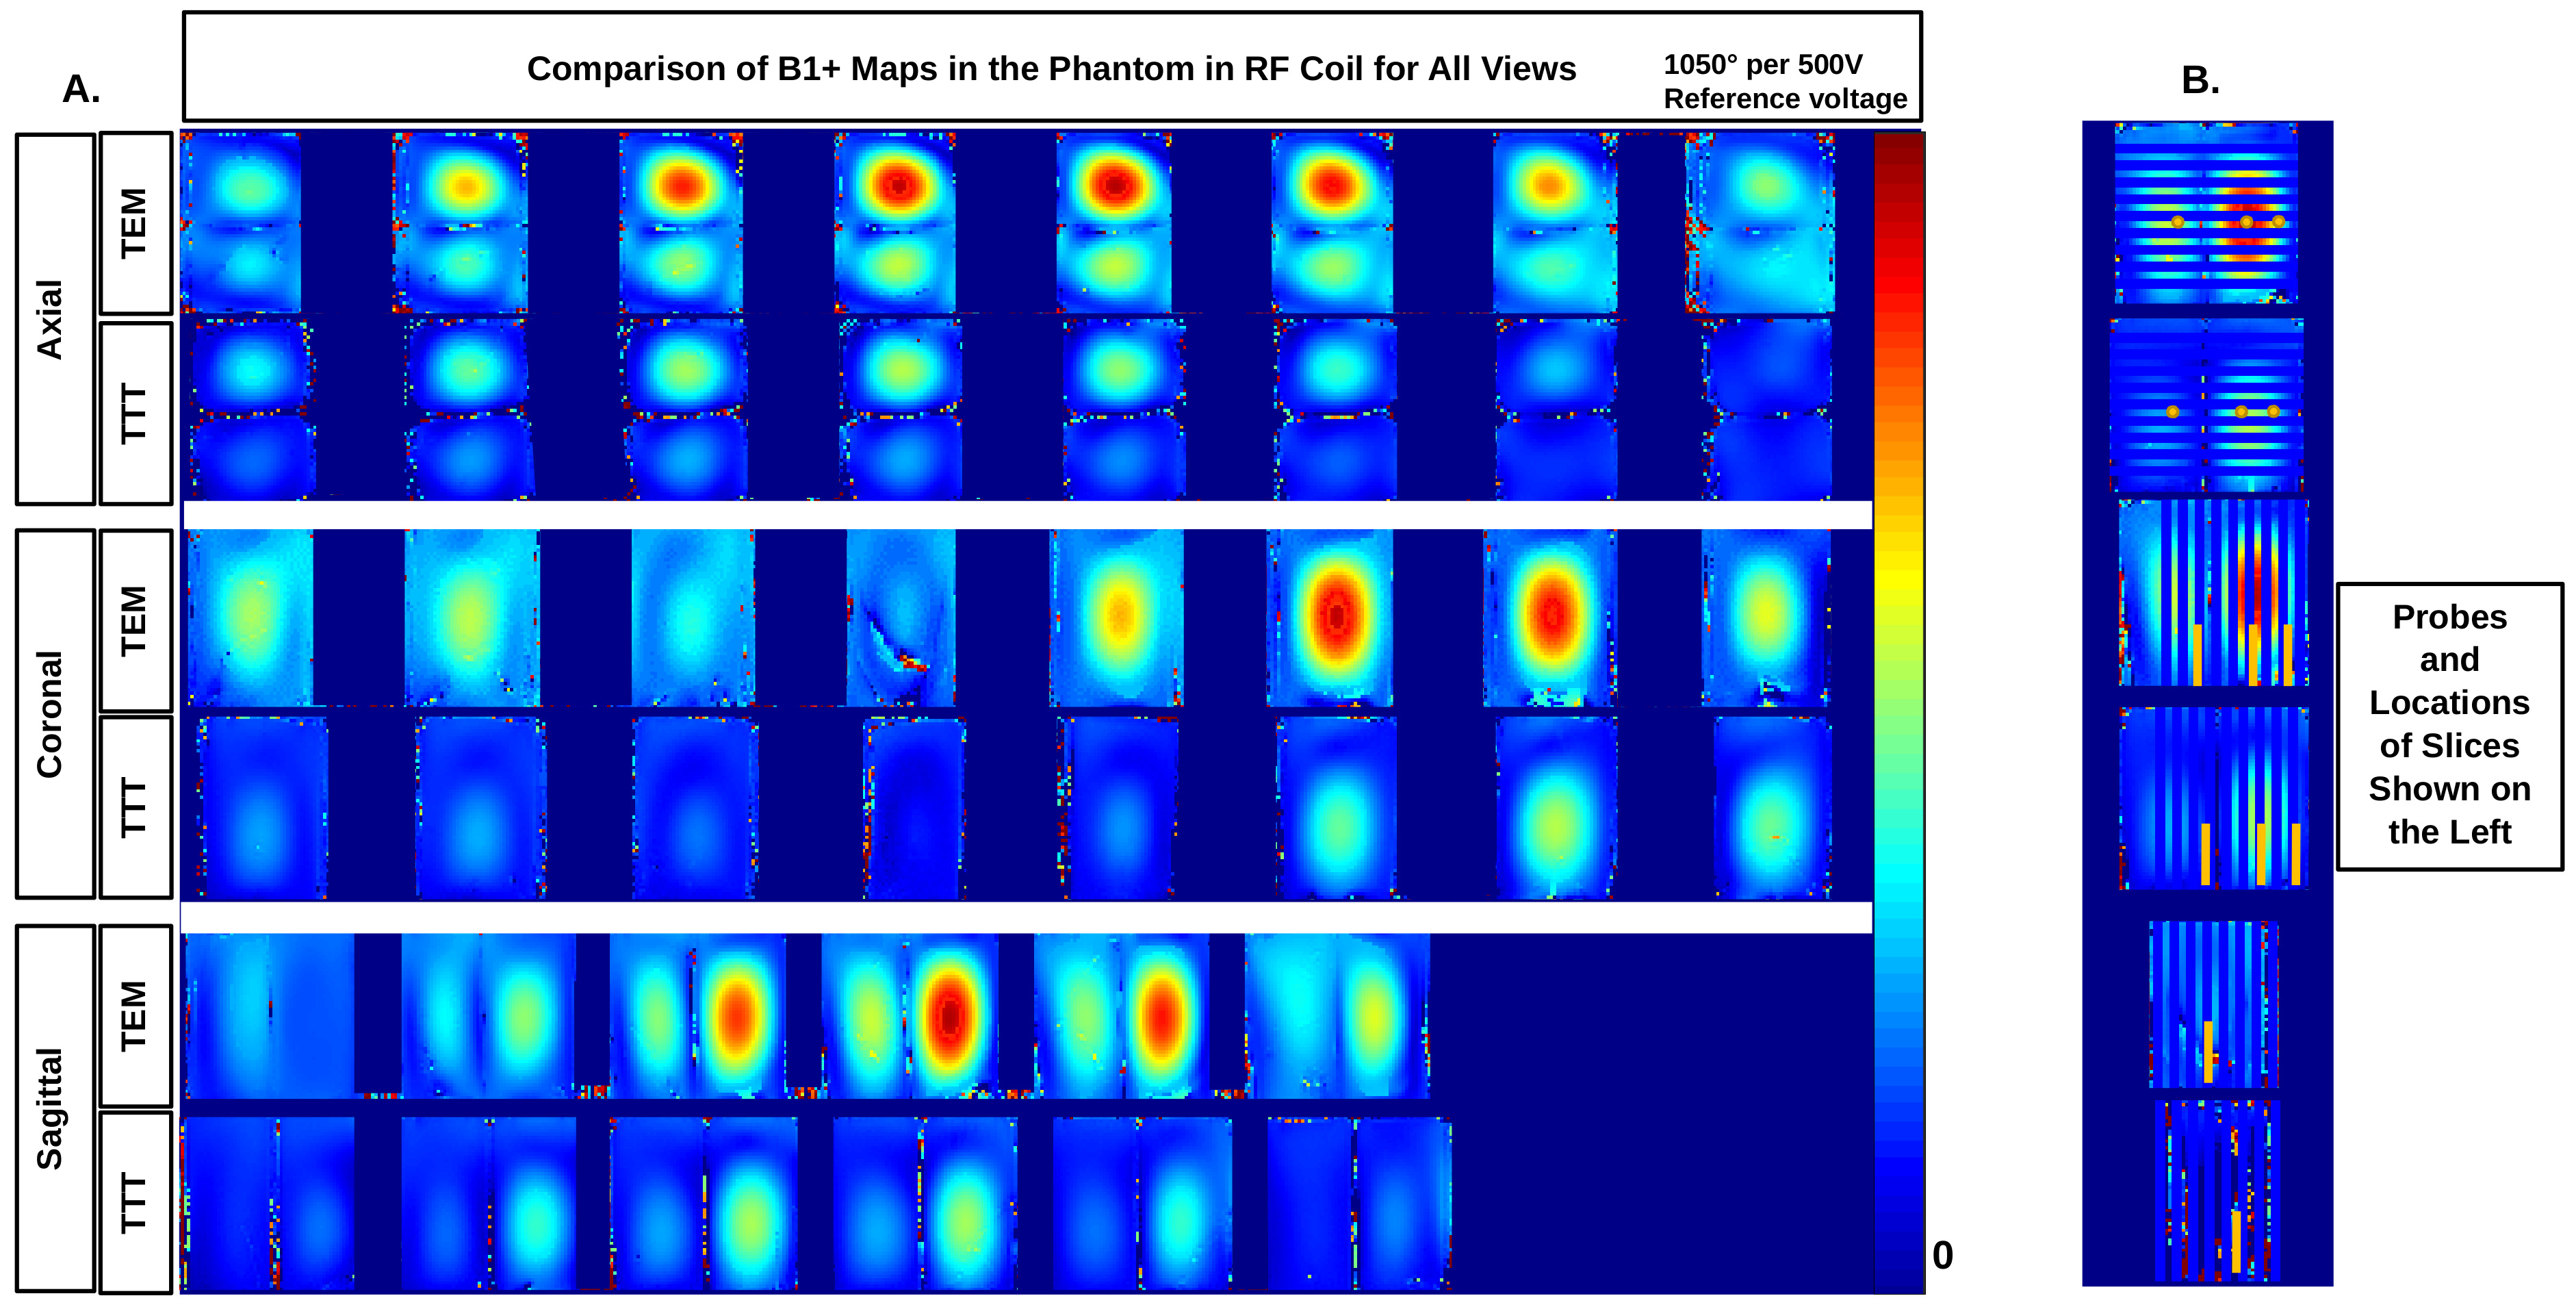
B1+ mapping was done using experimental 3D B1 maps using the saturated TurboFLASH (SatTFL) MR sequence with a 1 ms rectangular RF pulse per 500V. The MR protocol image parameters are: FOV = 64 x 64 mm2, TE = 1.16 ms, TR = 2000 ms, FA = 6⁰, BW = 1502 Hz/pixel, resolution = 3.1 x 3.1 x 2.0 mm3.
Experimental Study. All temperature measurements acquired using a Siemens MAGNETOM® (Siemens Healthcare, Erlangen, Germany) 7T whole-body scanner and a 16-strut TEM resonator with a 14-ch receive insert and a 16-ch TTT coil with 32-ch receive only insert. While turning the gradient coils off, the experiment was designed to measure the temperature rise due to RF power absorption alone in the dual-compartment rectangular phantom. The reference voltage delivered in each coil was based on achieving the same mean B1+ intensity in the phantom for each coil (measured using B1+ mapping prior –Figure 2.) A reference voltage of 400V was used for the TTT coil and 240V for the TEM coil (see Figure 2). The location of the NeoptixTM T1 temperature probes are shown in Figures 1 and 2.
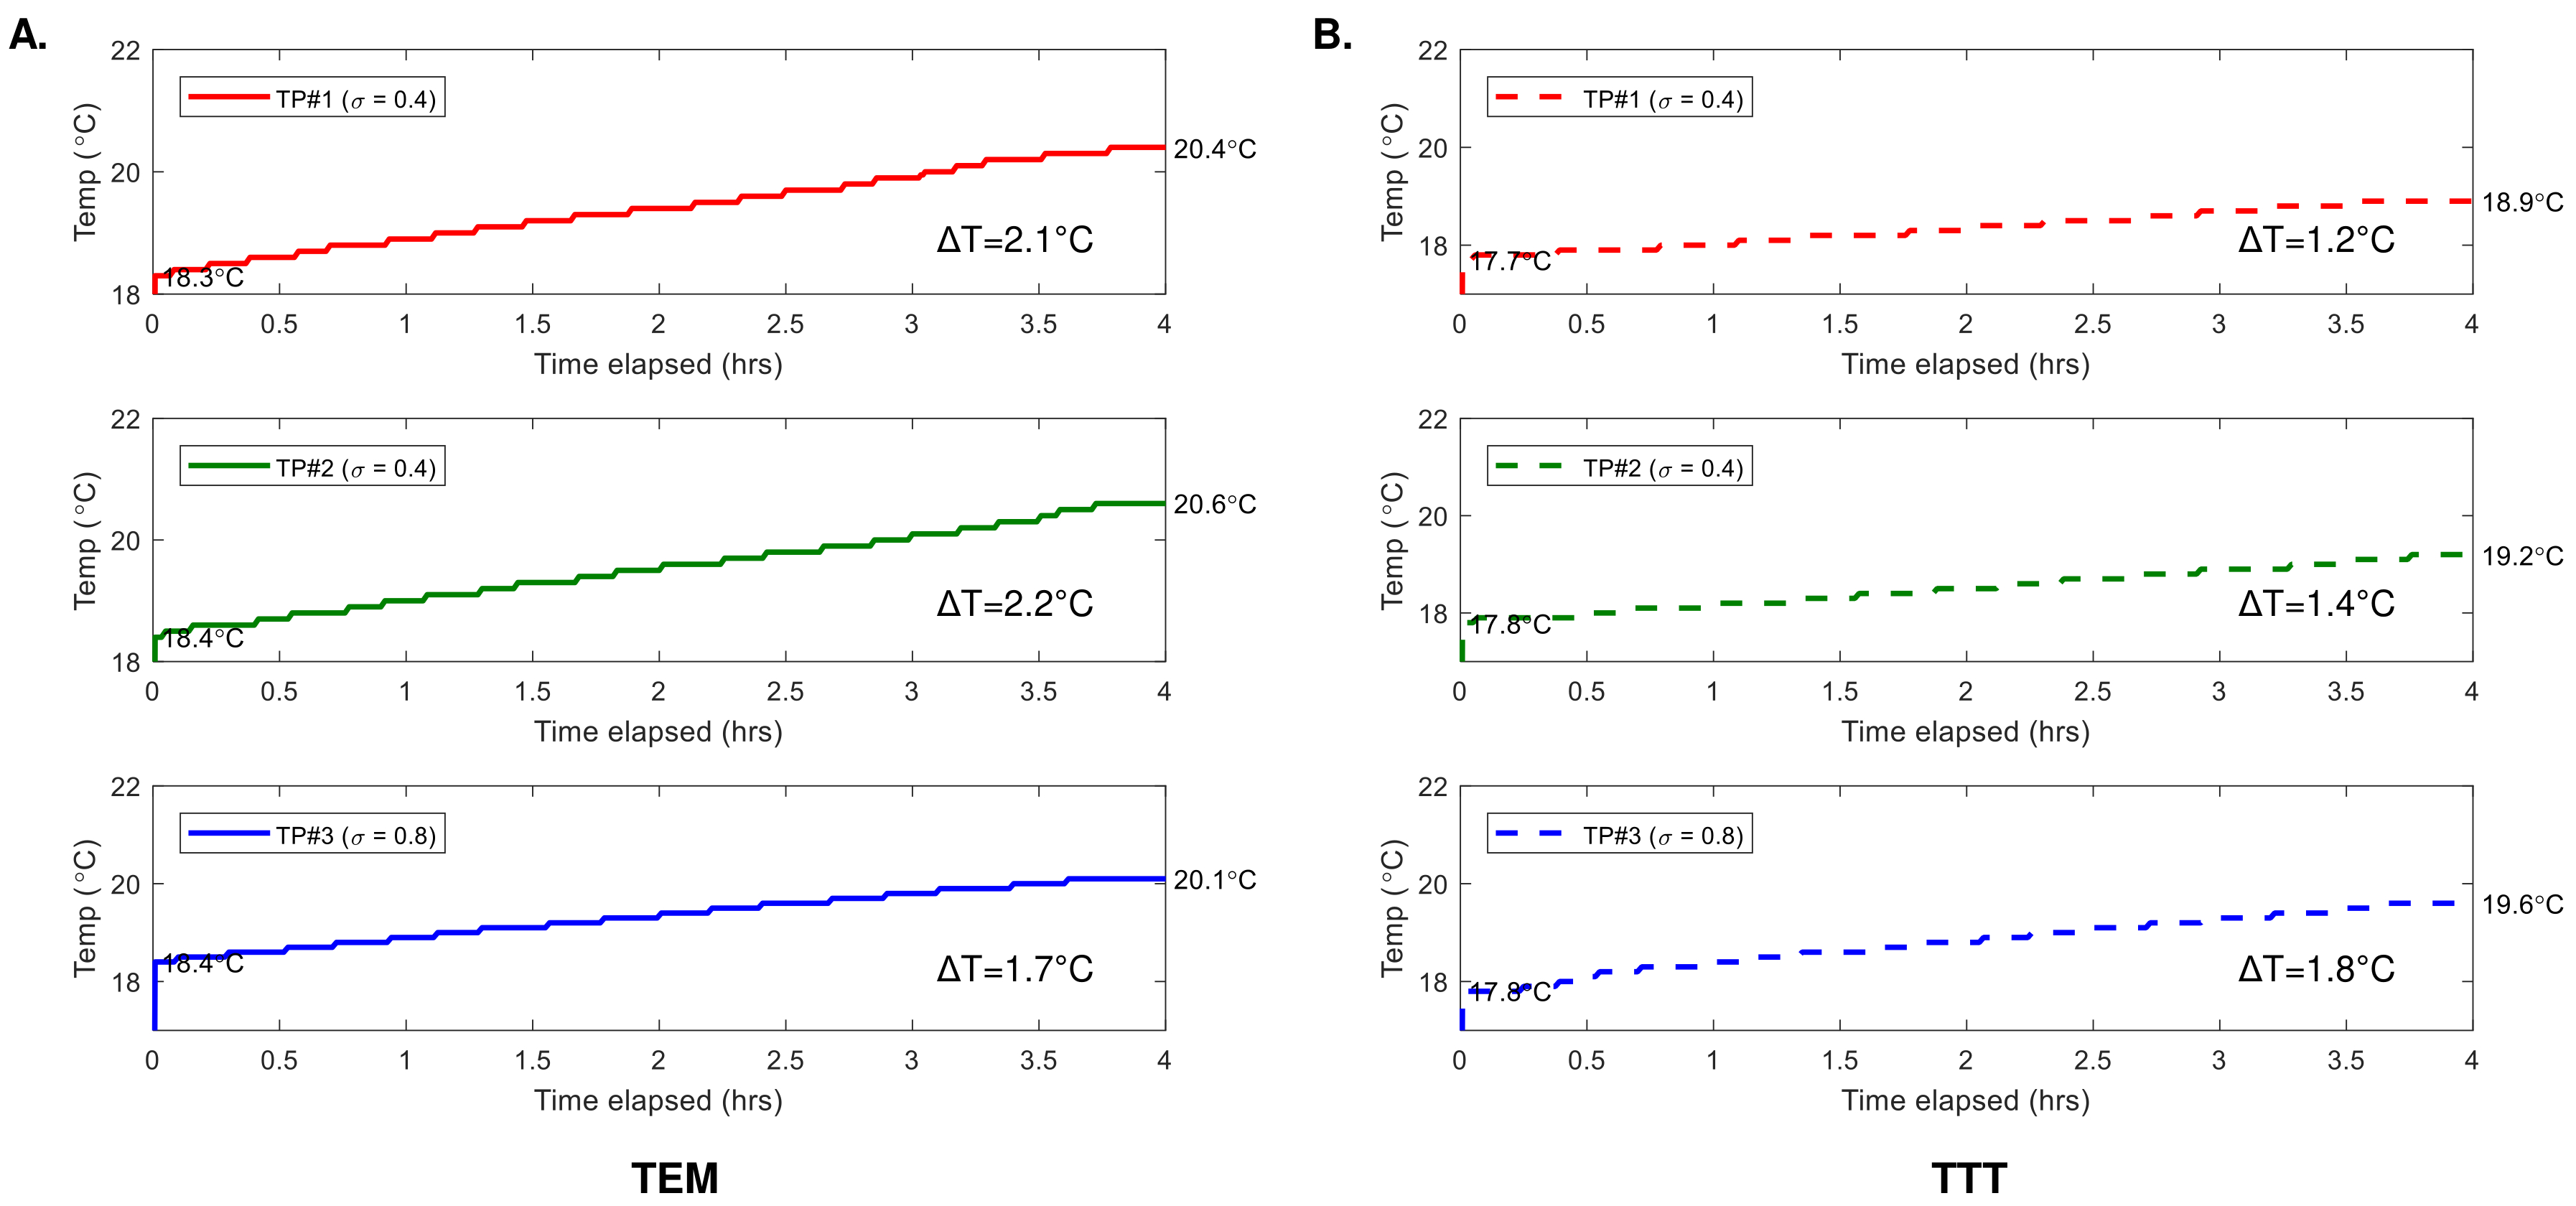
Before capturing temperature measurements, the coil and phantoms remained in the scanner room to set the temperature to equilibrium. An RF heating sequence was run while turning off the gradient coils for 4 hours (as shown in Figure 3). Three fiber optic cables were used in the phantom (2 in σ = 0.4 S/m compartment & 1 in σ = 0.8 S/m compartment) and one fiber optic cable is placed in the control phantom.
Results and Discussion
The baseline temperature was measured inside of the bore for 12 hrs prior to running the experiment. The TEM coil began with an equilibrium of 18.4°C and the TTT 17.8°C. The temperature rise of the TEM coil (using 240V as the reference voltage) in σ = 0.4 S/m compartment was 2.1°C in TP#1 and 2.2°C in TP#2 in Figure 3. The rise is in the TTT coil (using 400V as the reference voltage) was 1.2°C in TP#1 and 1.4°C in TP#2. This medium’s conductivity is relatively similar to the brain and brainstem, although the permittivity differs from these tissues. Also, the temperature rise in the σ = 0.8 S/m compartment was 1.7°C in the TEM coil and 1.8°C in the TTT coil.Conclusion
The results show that lower B1+/RF power efficiency does not necessarily result in lower B1+/temperature (or SAR) efficiency. Future work will include the assessment of temperature rises due to RF heating in anthropomorphic heterogeneous human head phantom.Acknowledgements
This work is partially supported by the National Institutes of Health under grants 1R01MH111265-01 and F31EB019872.References
1. Vaughan JT, Hetherington HP, Otu JO, Pan JW, Pohost GM. High frequency volume coils for clinical NMR imaging and spectroscopy. Magn Reson Med. 1994;32:206-218.
2. Ibrahim TS, Krishnamurthy N, Santini T, et al. 7T RF Coil System with Non-Subject Specific RF Fields & Extended Coverage into the Cerebellum & Temporal Lobe. ISMRM Workshop on Ultra High Field MRI: Technological Advances & Clinical Applications, Heidelberg, Germany. March 2016.
Figures