4181
Simple transmission antenna resonance Q value measurement method using RF power monitors1Hitachi, Ltd. Healthcare Business Unit, Tokyo, Japan
Synopsis
In MRI system it is important that whole body SAR is controlled accurately to obtain good scanning images and to keep patients' safety. A simple transmission antenna resonance Q value measurement system has been developed using conventional RF power monitors. The system has been validated comparing with the network analyzer measurements. Based on this validation, whole-body SAR management system was integrated. Using the integrated system, accurate whole-body SAR management has been made possible.
INTRODUCTION
It is important to manage accurately the whole-body SAR in the scanning of MR imaging system for patient's safety and obtaining good images. To obtain accurate whole-body SAR, it is demanded to know accurate power distribution ratio between human body and the transmission antenna. The power distribution ratio can be derived from the antenna resonance Q values1. To measure the Q value of the antenna, conventionally the network analyzer is used. However, it is not easy to implement the function of the network analyzer into the MR imaging system. We developed a simple Q measurement and whole-body SAR management system using RF forward and reflection power monitors. Most high field MR imaging systems have such RF power monitors.METHODS
The antenna loss coefficient alpha is defined as; $$\alpha=\frac{Q_{loaded}}{Q_{unloaded}}$$ Total input power $$$P_{tot}$$$ is divided mainly into two parts; human body loss ($$$P_{obj}$$$) and antenna loss ($$$P_{coil}$$$). This relationship is expressed using $$$\alpha$$$ as; $$$P_{tot}=P_{obj}+P_{coil}=P_{tot}\times(1-\alpha)+P_{tot}\times\alpha$$$. The whole-body SAR is described using $$$P_{tot,ch}$$$ and $$$\alpha_{ch}$$$ as; $$WBSAR=\sum_{ch}^{}P_{tot,ch}(1-\alpha_{ch})/Weight$$ The curves of the absolute antenna reflection coefficient |S| differs with various loading conditions as described in figure 1. Using this different characteristics, the Q values can be calculated without information of phases of the reflection S parameters. The absolute antenna reflection coefficient |S| can be measured with forward power ($$$P_{fwd}$$$) and reflection power ($$$P_{ref}$$$) monitoring using following equation; $$|S|=\sqrt{\frac{P_{ref}}{P_{fwd}}}$$ The reflection coefficient |S| is fitted using LCR resonance circuit model impedance Z and S-Z conversion; $$Z=\frac{\frac{1}{2\pi f C i}(2\pi f L i+R)}{\frac{1}{2\pi f C i}+2\pi f L i+R}$$
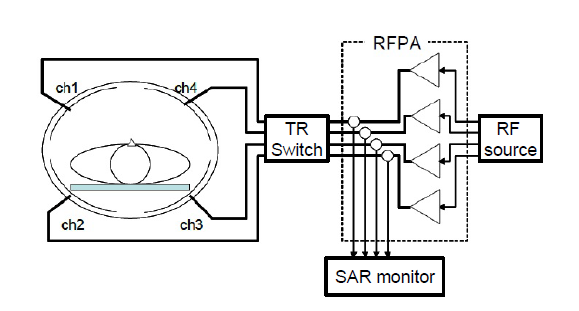
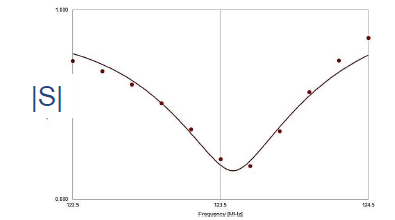
After obtaining L, C, and R values by fitting, the Q was calculated using equation; $$$Q=\frac{1}{R}\sqrt{\frac{L}{C}}$$$. The $$$\frac{L}{C}$$$ values are fixed for each channel for specific values to stabilize the fitting process. Three Tesla whole body MRI system (Hitachi, Ltd., Tokyo, Japan) with four channel transmission antenna2 is used for system integration. The RF configuration detail is described in figure 2. Finally, the software and the system was integrated. The eleven |S| point data for each four channel could be measured in four seconds. The measurement frequency span was set to be 2 MHz. Influences from long cables, transmit receive switching circuits, and the directional coupling circuits (figure 3) were compensated with calibration matrix3. The data fitting result example is shown in figure 4.
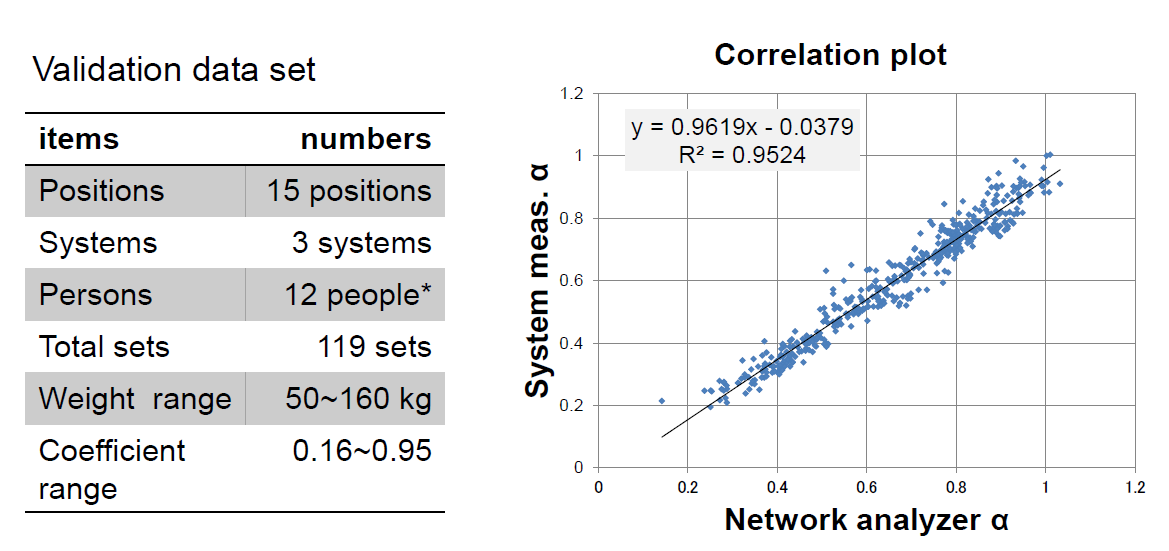
Validation of the system was made by comparing $$$\alpha$$$ measured using a network analyzer and those using the developed system. We assumed $$$\alpha$$$ obtained using the network analyzer has the correct value. Data from volunteers were obtained after receipt of written informed consent. This study was approved by the ethics committee of Hitachi group headquarters. With twelve volunteers, fifteen scanning positions, and total 119 data sets for each four channels were measured for validation (table in figure 5). The scanning positions include off-centered positions and lateral positions in which patient body is very close to one of the four channels of the transmission antenna. The fifteen-scanning position were head, C-spine, CT-spine, chest, liver, abdomen, pelvis, hip joint, long bone, shoulder, elbow, wrist, knee, ankle, and breast.
RESULTS
Measured Q values range from 47 to 271. The $$$\alpha$$$ measured by the network analyzer ranges from 0.142 to 1.033. The four channel transmission antenna has a slight mutual coupling between channels. The coupling leads $$$\alpha$$$ value greater than unity in some cases. The heaviest loaded condition was $$$\alpha=0.142$$$. The comparison plot of $$$\alpha$$$ is shown in figure 5. Good correlation coefficient (R=0.9524) is obtained between network analyzer measurements and the system measurements. Based on this correlation, whole body SAR management system was integrated. Using this integrated system, accurate whole body SAR management has been made possible.
DISCUSSION
The origin of the difference between the network analyzer measurements and the system measurements would be patient movements, the limited accuracy of the RF power monitors, narrow band characteristics of transmission RF source, power amplifier and power circulator. This system also has other merits besides SAR monitoring. Measuring Q of the transmitter antenna, the antenna condition is able to be monitored. The antenna malfunction or failure will be detected. Large coupling between the transmitter antenna and the receive coils can be detected. The large coupling results in low Q values of transmission antenna. The detection of the receive coil coupling leads avoiding over heating of the receive coils and keeping patients safe.CONCLUSION
A simple transmission antenna resonance Q value measurement system has been developed. The system uses conventional RF power monitors. The system has been validated comparing with the network analyzer measurements.
Acknowledgements
We thank Hitachi R&D group members - Yoshihisa Soutome and others - for useful discussions.References
[1] P. Mansfield, et. al., "NMR imaging in biomedicine", Academic Press, (1982) p313.
[2] Y. Soutome, et. al., "Simulation Study of a 4-Channel Ladder-shape Body Coil at 3T", Proc. ISMRM 21 (2013) p2750.
[3] A. Ferrero, et. al., "Multiport Vector Network Analyzer Calibration: A General Formulation", IEEE Trans. microw. theory tech., vol. 42, 2455 (1994).
Figures
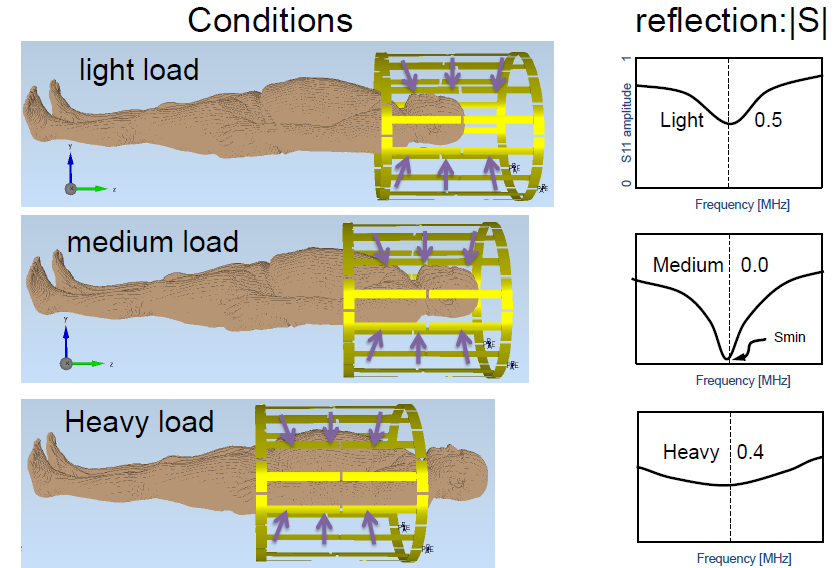
Figure 1: Various loading conditions and reflection coefficient |S| curve characteristics. The difference is used for fitting without phase information of |S|.