4179
Effects of Respiration on B1+ and SAR in Whole-Body Imaging at 7 Tesla1Sir Peter Mansfield Imaging Centre, University of Nottingham, Nottingham, United Kingdom
Synopsis
The work aimed to quantify the effect of the phase of respiration on calculated local SAR and B1+ excitation fields using electromagnetic simulations using XFDTD software and to verify these results by comparing with B1+ maps acquired in vivo. The results show that the variation in local SAR was greater for the anterior elements due to the movement of the chest between inhale and exhale breath holds. The change in B1+ in the abdominal organs and in regions of interest under each transmit element was not significant.
Purpose
This study investigates the effects of respiration on simulated B1+ fields and SAR using XFDTD software (REMCOM) and B1+ maps from in vivo scans. 7T abdominal imaging using multi-transmit systems has the potential to cause local SAR hot spots and highly variable B1+ fields [1]. These fields may change due to changes in body position during scanning, and respiration-induced variations in B1+ have been shown to be significant in multi-transmit systems at 3T [2]. Previous work has considered inter-subject variability in SAR [3, 4], but less work has been done on intra-subject variability, and in particular with respect to respiratory motion which is required to provide an appropriate level of confidence in SAR predictions and the robustness of RF shimming and pulse design.Methods
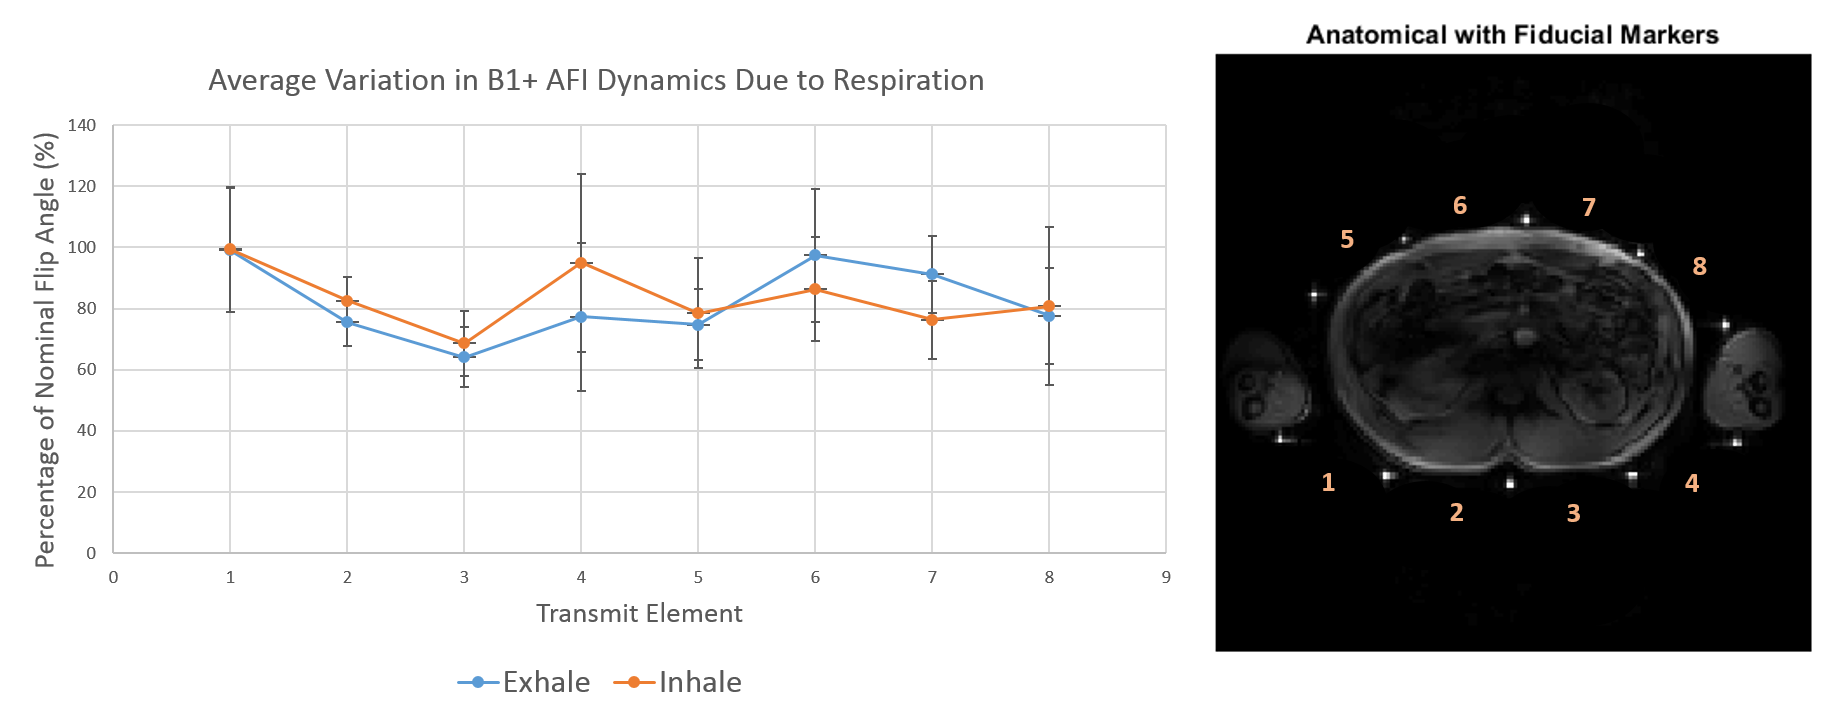
In vivo experiment: All scans were acquired on a Philips 7T Achieva 8-channel multi-transmit system (Best, Netherlands). Abdominal B1+ maps were acquired on 7 subjects using an MRCoils 8 TX/32 RX fractionated dipole array coil (Utrecht, Netherlands). B1+ mapping was performed using AFI (see Table 1) [5]. B1+ maps were acquired for both inhale and exhale breath-holds and on one subject scans were repeated on another occasion to assess repeatability. B1+ was measured in regions of interest (ROIs) located directly under each transmit element.
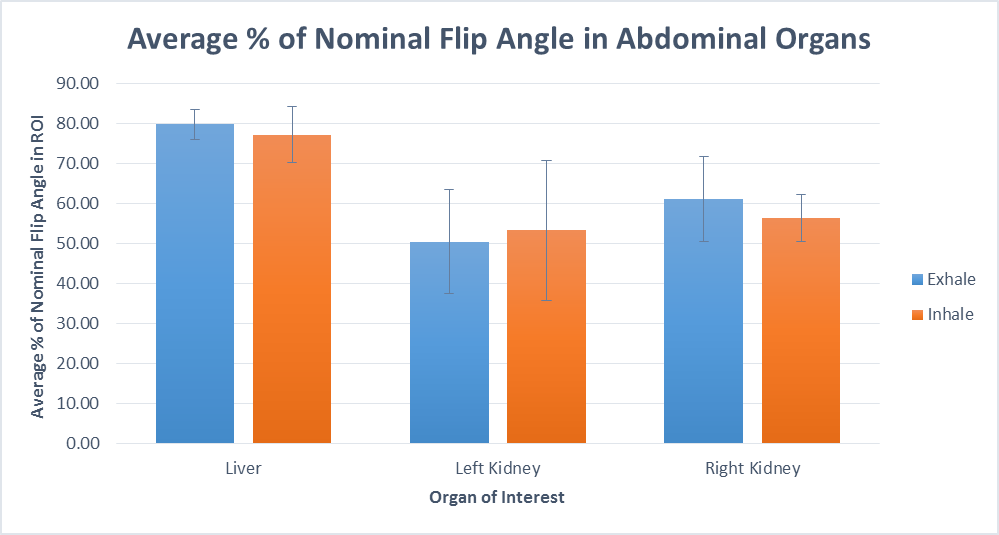
B1+ maps were also acquired with all transmit channels using the same AFI parameters to study the change in B1+ in the liver and kidneys in 3 of the subjects. The change in B1+ was averaged over 3 ROIs in each organ. ROIs in each organ were selected using the underlying gradient echo images from the AFI scans. Fiducial markers were fixed to each coil element’s housing to accurately assess the position of the coil during each respiratory phase.
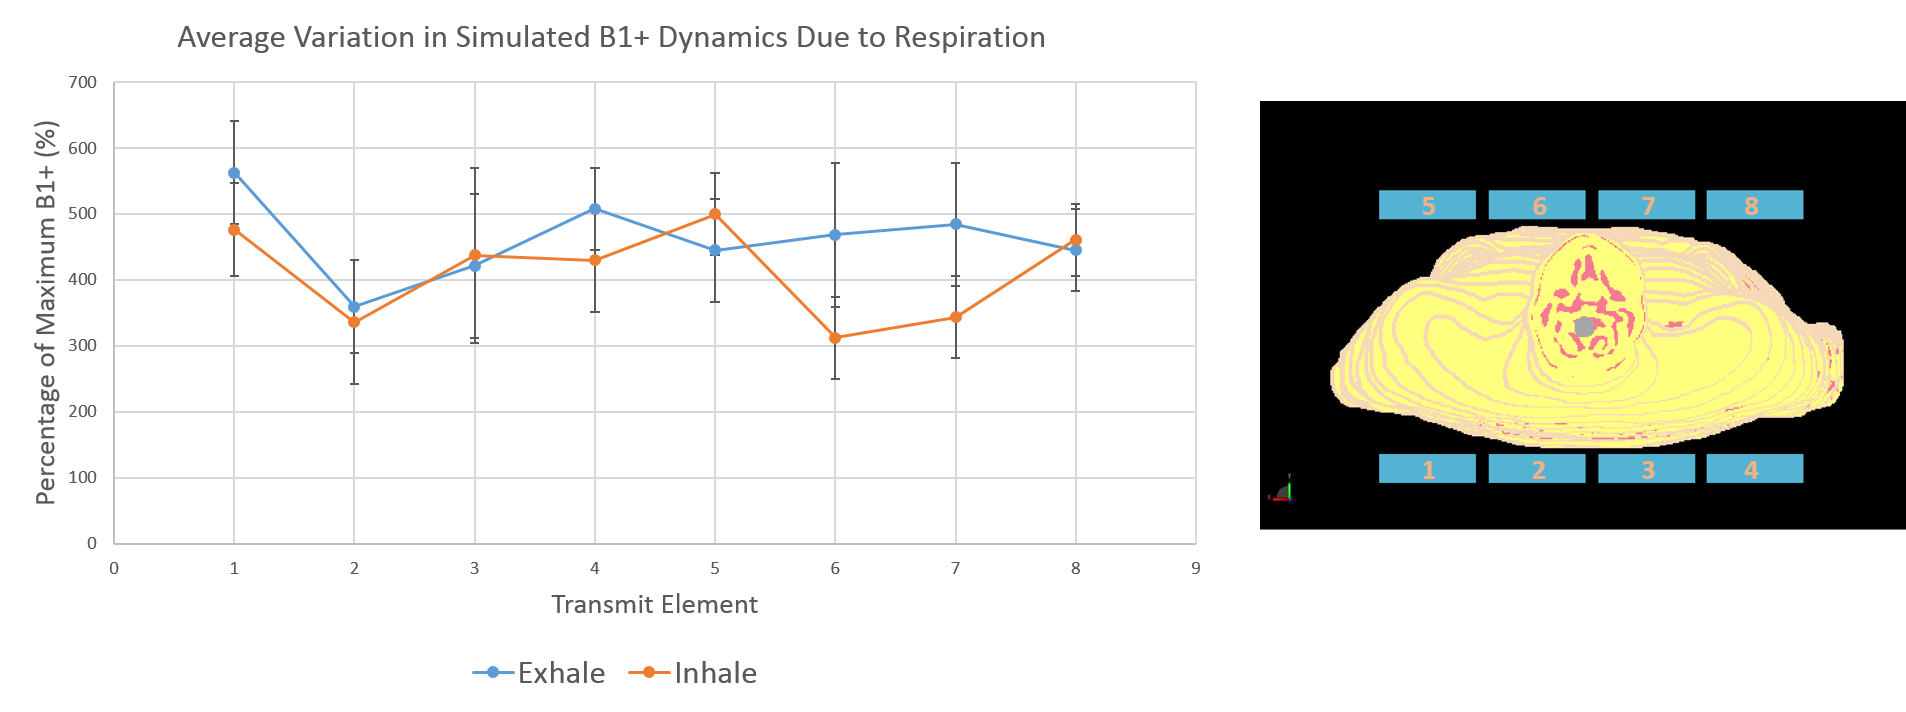
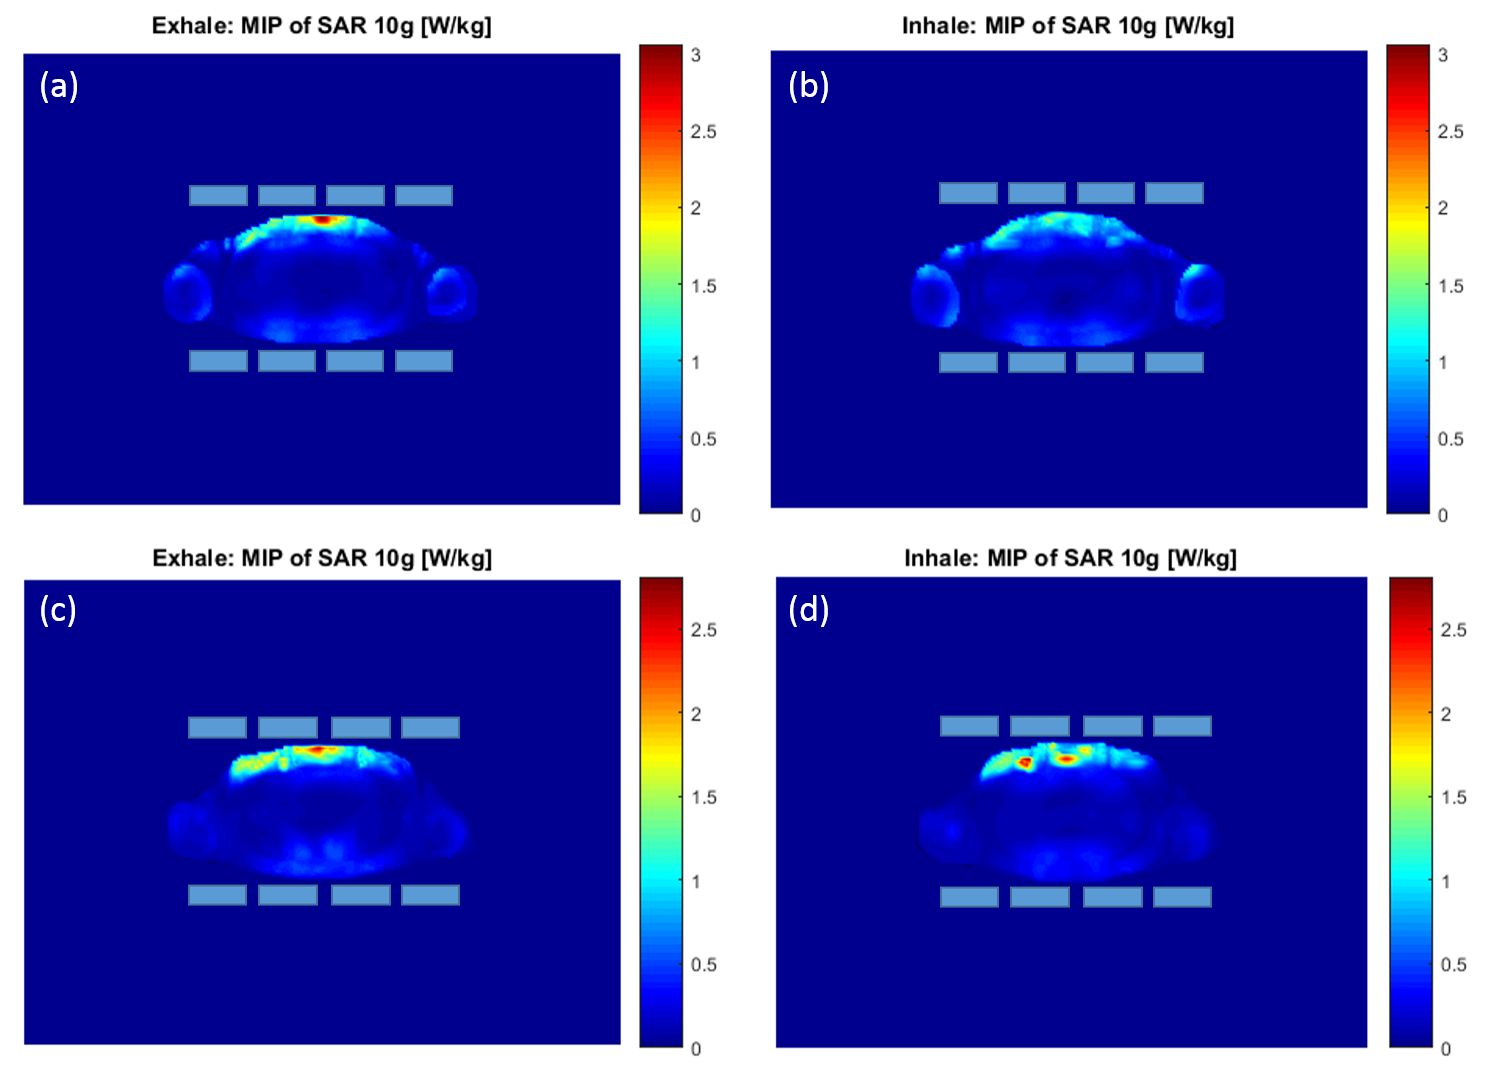
Simulations: mDIXON scans were acquired on the torso of 2 subjects at both inhale and exhale on a 3T Philips Ingenia scanner. Images were segmented into different tissue types using Analyze software and used to produce full tissue models in XFDTD software for EM simulation. Simulations were driven at 1W per element and tuned to 300MHz. E and B1+ fields were simulated for each dipole for the two body models and respiration phases. E-fields were exported to MATLAB software for calculation of the 10g average SAR (SARAV,10g) for each simulation [6], and the simulated B1+ maps were exported and scaled to match the 3W average power per channel used for the 7T in vivo scans.
Results
In vivo: Figure 1 shows the average variation in B1+ under each transmit element on inhale and exhale breath-holds. The inhale-exhale difference, ∆B1+, ranges from 0.2– 18% of the nominal flip angle. There is a noticeable change in B1+ between breath-hold positions in both the anterior elements and the lateral-posterior elements. Figure 2 shows the ∆B1+ in the liver and kidneys. There is minimal difference in the B1+ within the organs between inhale and exhale breath-holds, (∆B1+ is 2.2, 2.8 and 4.7% for liver, left kidney and right kidney respectively). Repeatability scans gave an average ∆B1+ of 20 and 12% of the nominal flip angle for the two separate scans of one individual.
Simulation: Figure 3 presents the results from the B1+ maps generated in REMCOM. The average B1+ in an ROI under each transmit element in the model is quoted in terms of percentage of maximum generated B1+ (μT). The change in B1+ ranges from 2.5-25% which corresponds to a variation of between 0.1-1μT. There is an increased variation in the B1+ for the anterior elements, and the lateral-posterior elements. Figure 4 shows the SARAV,10g maps for both of the body models simulated for inhale and exhale breath-holds. The maximum SARAV,10g calculated for the inhale breath-holds were 3.1 and 2.8 W/kg respectively for the two different body models simulated. The corresponding exhale breath-hold SARAV,10g values were 1.6 and 2.8 W/kg.
Discussion and Conclusion
The in vivo and simulation variation in B1+ agree for ROIs under each transmit element. The change with respiration was greater for the anterior elements due to the movement of the chest between inhale and exhale breath-hold positions. The change in B1+ in the abdominal organs was not significant, providing confidence that RF shimming and pulse design calculations will be robust to changes in position due to respiration. The simulated change in SAR with respiration was not significant, but more simulations are planned to verify this finding.Acknowledgements
This work was supported by funding from the Engineering and Physical Sciences Research Council (EPSRC) and Medical Research Council (MRC) [grant number EP/L016052/1].References
1. Parallel transmission for ultrahigh-field imaging. Padormo F, Beqiri A, Hajnal JV, Malik SJ. NMR Biomed. 2016 Sep;29(9):1145-61
2. Assessing and Correcting Respiration Induced Variation of B1 in the Liver. Padormo et al. Proc. Intl. Soc. Mag. Reson. Med. 17 (2009), p 754
3. SAR Comparison for Multiple Human Body Models at 1.5T and 3.0T. Wang et al. Proc. Intl. Soc. Mag. Reson. Med. 18 (2010), p 3880
4. The effect of body size and shape on RF safety and B1 field homogeneity at 3T. Bergen et al. Proc. Intl. Soc. Mag. Reson. Med. 14 (2006), p 2040
5. Actual flip-angle imaging in the pulsed steady state: a method for rapid three-dimensional mapping of the transmitted radiofrequency field. Yarnykh VL. Magn Reson Med. 2007 Jan;57(1):192-200.
6. System and SAR characterization in parallel RF transmission. Zhu Y, Alon L, Deniz CM, Brown R, Sodickson DK. Magn Reson Med. 2012 May;67(5):1367-78.
Figures