4178
Impact of Constant BMI and Variable Lean-Body-Mass on B1+ and SARMatthew Tarasek1, Yihe Hua1, Desmond Yeo1, and Thomas Foo1
1MRI, GE Global Research, Niskayuna, NY, United States
Synopsis
Magnetic resonance imaging (MRI) uses radiofrequency energy which is absorbed by the patient. This energy is expressed in terms of specific absorption rate (SAR). Here we analyze the EM and thermal effects of increased lean-body-mass proportions with constant body-mass-index (BMI). We use a combination of techniques to achieve morphed expansion of lean-body-mass (LBM muscle) of non-head skeletal muscle tissue in a computational anatomical human body model. Results indicate that LBM may be a worthwhile anatomical descriptor to consider for impact on thermal risk assessment.
Purpose:
Magnetic resonance imaging (MRI) is a non-invasive imaging technique that uses high-power radiofrequency (RF) energy for spin excitation. The RF energy absorbed by the patient is expressed in terms of specific absorption rate (SAR). SAR distributions can be predicted with full-wave electromagnetic (EM) simulations, and subsequent predictions of RF-induced temperature changes can be computed using SAR maps as input to a time-dependent bioheat equation, e.g., Penne’s bioheat equation (PBHE)1. Much work has gone into analyzing the correlation of gross anatomical descriptors with SAR2-4, but to our knowledge there have been no previous reports studying the EM effects of increased lean-body-mass proportions with constant body-mass-index (BMI). Such results would be applicable to any member of the general population or athlete who has been involved in weight-training exercise for 1+ years, as their BMI will fall outside the standard population distribution5 and thus potentially pose unforeseen issues in MRI regarding EM fields and SAR. Here, we use a combination of techniques to achieve morphed expansion of lean-body-mass (LBM muscle) tissue in a computational human body model (HBM). Preliminary results indicate decreased B1+ efficiency and potentially higher risks for global SAR deposition in high-LBM patients. However, there is a potentially decreased risk of critical temperature rise due to increased thermal conductivity and blood perfusion.Methods:
We utilize the extended cardiac-torso (XCAT) computational anatomical phantom formed from segmentation of multiple patient datasets and scaled to the proper anthropometric dimensions categorized for the 99th weight percentile for US adult males.6 Keeping the BMI constant, the XCAT phantom was morphed to yield 10 HBMs with different LBM. Fig. 1 shows three examples of LBM variation. Morphing was accomplished by growing pixel layers into the neighboring visceral and subcutaneous fat regions as depicted in Fig. 2, constrained by the proximity of nearby rigid structures, organs, and blood vessels. Cross-section of all HBMs was kept constant, with the only other modifications being length in the z-direction (to preserve BMI). Morphing was limited to non-head skeletal muscle regions as these are typically shown to be affected by weight training, i.e., we exclude heart smooth muscle, and jaw muscle tissue hypertrophy. An EM model of a 3T 16-rung 2-port whole body high-pass birdcage coil with a HBM was simulated in the FDTD software Sim4Life (ZMT, Zurich, Switzerland). The coil was firstly tuned and matched at unloaded condition (127MHz, quadrature mode), and then the centre frequency of the excitation was chosen to the best match point after the human body model is inserted. EM field distributions from various simulations were extracted and post processed in Matlab (Mathworks, Natick, MA). The nominal values of permittivity (ε) and electrical conductivity (σ) for all tissues were assigned.8Results:
Results show decreased B1+ efficiency with increasing LBM through the sternum landmark region. Overall, average B1+ decreases by ~40% as LBM increases (see Fig. 3). This is likely due to a much higher σ closer to outer body regions, and hence greater energy absorption close to the HBM surface. In general, SAR is linearly proportional to average σ for a given set of E fields, and here we see global SAR increases by over 2 times as LBM increases by approximately a factor of 2.3. Fig. 4 plots results for relative average B1+ and average (global) SAR for all HBMs. Although global SAR increases substantially with increased LBM, extension to thermal simulations shows potential for decreased risk of critical temperature rise due to increased thermal conductivity and much greater blood perfusion in LBM.Conclusions:
Results indicate that LBM may be a worthwhile anatomical descriptor to consider for impact on thermal risk assessment. In particular, a LBM metric could provide a means to derive a single basic patient-specific descriptor for setting standard RF exposure scanner limitations. This could be easily measured with a Dixon-based water-fat separation sequence, and could potentially allow faster scan times for patients with very high BMI but lower LBM proportions.Acknowledgements
No acknowledgement found.References
[1] Pennes HH. J Appl Physiol. 1948;1(2):93–122. [2] Murbach M, et al. Magn Reson Med 2014;71:839–845. [3] Szczerba D, et al. 30th URSI General Assembly and Scientific Symposium, URSIGASS 2011 2011. [4] Lloyd BA. IntWorkshop on Simulation and Synthesis in Medical Imaging. Springer International Publishing. 2016. [5]. ICRP Publication 89 (International Commission on Radiological Protection, New York, NY, 2002). [6] Segars WP, et al. Med Phys. 2010;37(9):4902-15. [7] Vaughan JT, et al. Wiley, 2012. [8] Gabriel S, et al. Phys Med Biol 1996;41:2271-93.Figures
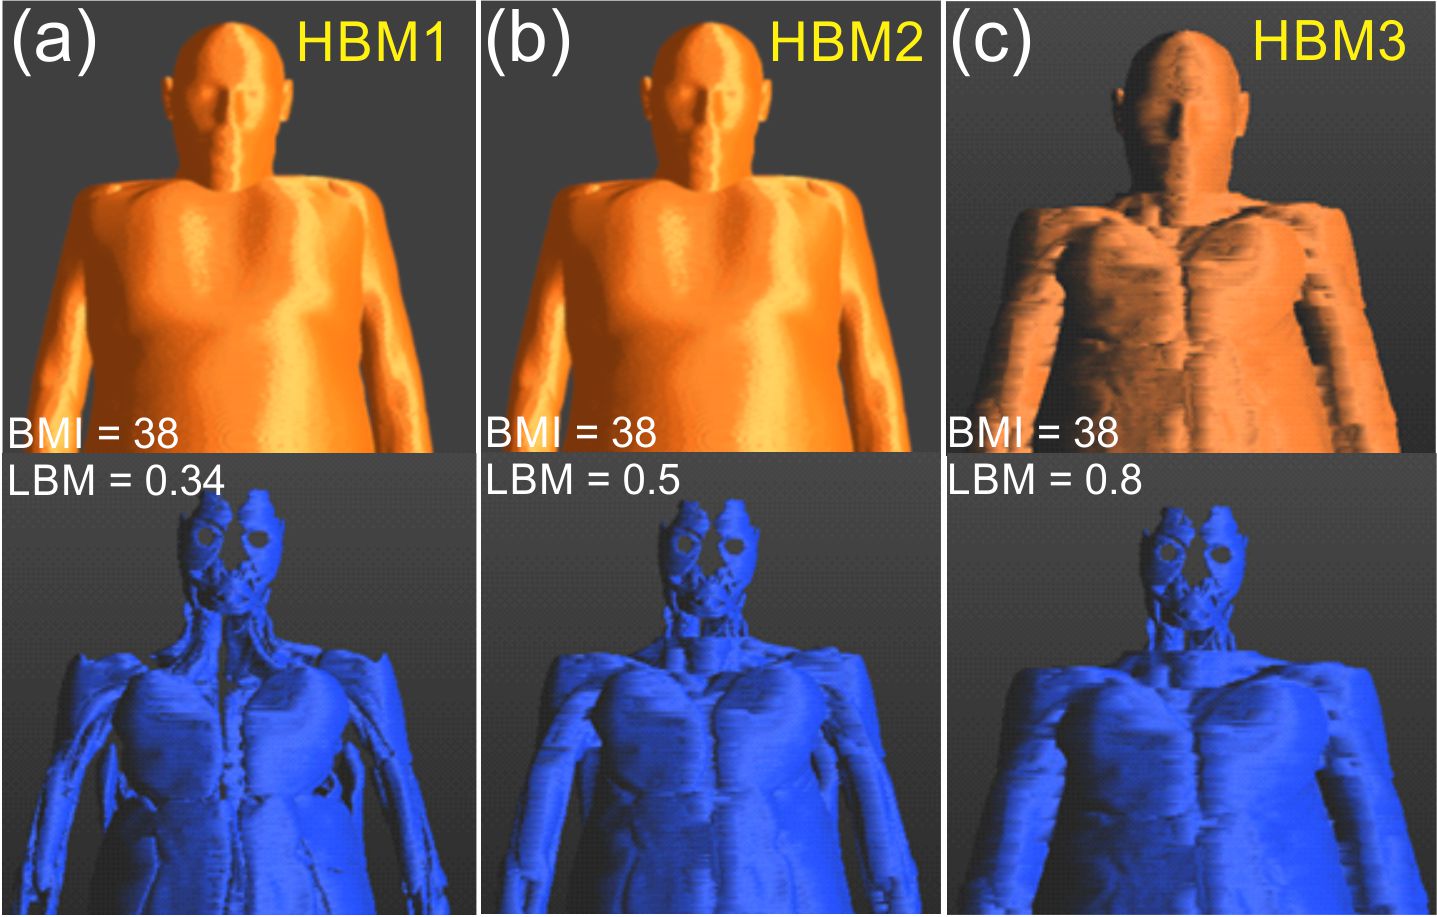
Fig. 1 Morphing of HBM to
obtain variable lean body mass with same BMI. Top row: all tissues and skin,
bottom row: LBM only. Percentages of LBM are indicated (e.g. HBM1 has
BMI = 38, LBM = 34%)
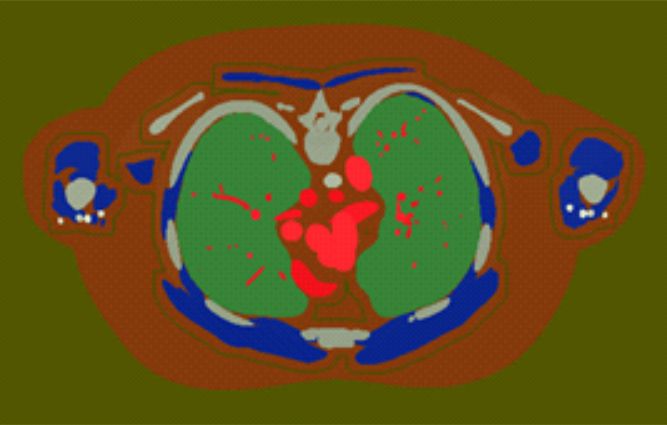
Fig. 2 Axial slice example of LBM morphing into
visceral and subcutaneous fat regions. For reference the lungs are colored green.
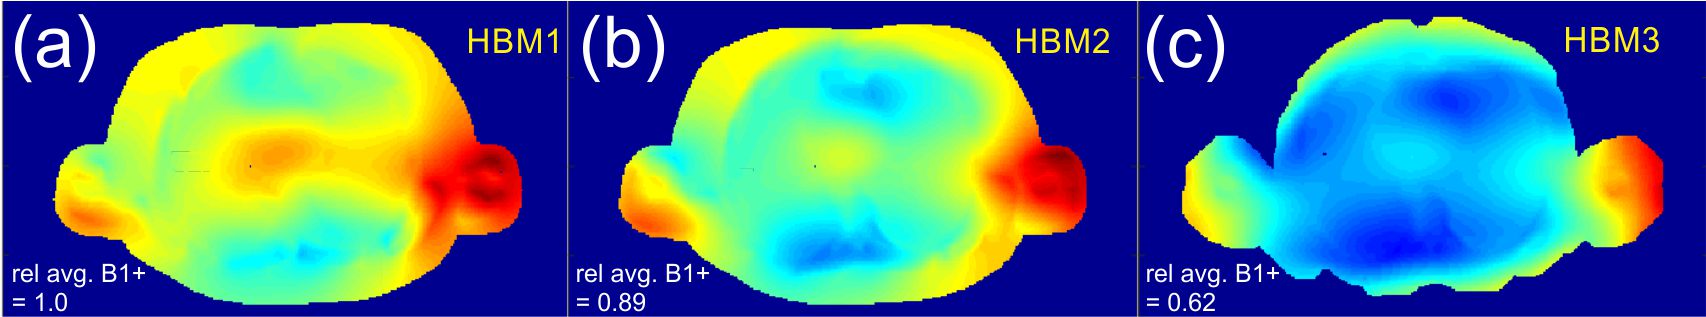
Fig. 3 B1+ maps scaled to 1W input power for sternum landmark region and increasing LBM in HBM1, HBM2, and HBM3 respectively. Results indicate a decreased B1+ efficiency as LBM increases. Relative average B1+ is indicated on figure.
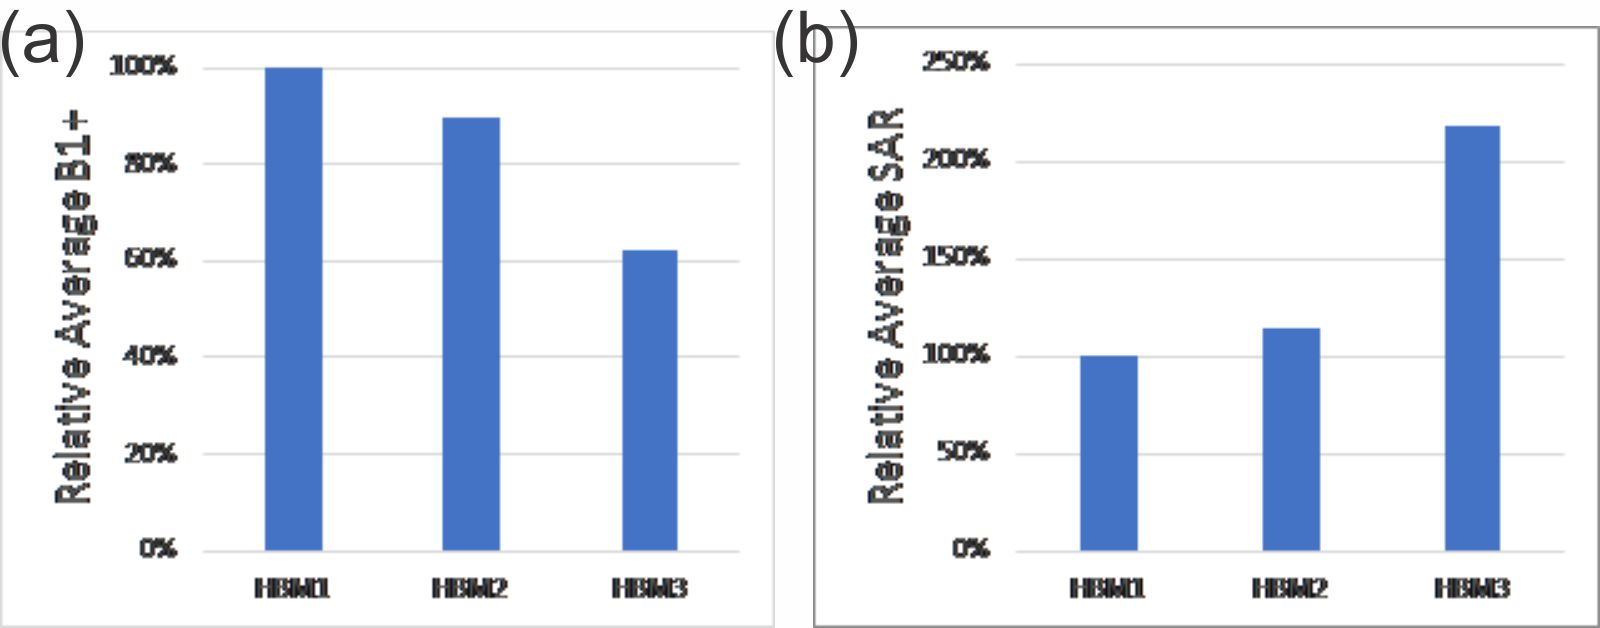
Fig. 4 (a) Relative
average B1+ and (b) relative average SAR for HBM1, HBM2, and HBM3. See text for more details.