4177
Optimization of the order and spacing of the sequences in an MRI examination to minimize the thermal dose1Radiology, Center for Advanced Imaging Innovation and Research (CAI2R), New York, NY, United States, 2Radiology, Bernard and Irene Schwartz Center for Biomedical Imaging, New York, NY, United States
Synopsis
Thermal dose is a parameter to evaluate the potential to damage tissues by exposure to high temperatures. In case of SAR-induced heating, we show that the maximum thermal dose can be reduced by changing the order of the sequences and delays between sequences without increasing the total exam duration. Using numerical simulations, we have optimized the order of the sequences of a comprehensive spine exam, and the optimized sequence has a maximum thermal dose equal to 0.80 cumulative equivalent minutes at 43 °C (CEM43), while the original exam had a maximum thermal dose equal to 1.72 CEM43.
Purpose
To reduce the maximum thermal dose accumulated during an MRI exam by rearranging the sequences and optimizing the time gaps between each sequence.Introduction
Absorption of RF power in MRI causes heating in tissues, which can cause discomfort in the patient and even tissue damage. For this reason, absorbed RF power and maximum temperature are limited during the exam, and the concept of thermal dose has been introduced to estimate the likelihood of tissue damage due to the effect of prolonged high temperatures on tissues1. The order of the sequences affects temperature: in fact, temperature increases at a faster rate in sequences with higher SAR, while it can decrease when sequences have lower SAR or in time gaps between sequences due to the effect of thermal conduction and blood perfusion. Hence, it was recently demonstrated in simulations that the maximum temperature can be reduced by properly sorting the sequences and optimizing the time gaps between the sequences with the constraint to not exceed the original duration of the exam2. In this work we extend the method to minimize the maximum thermal dose in the MRI examination.Methods
Temperature was estimated with a revised version of the Pennes' bioheat equation
$$$\rho c\frac{\partial T}{\partial t}=\nabla\cdot(k\nabla T)-W\rho_{bl}c_{bl}(T-T_{bl})+Q+\rho SAR$$$ (1)
where T is temperature, W is blood perfusion rate, k is thermal conductivity, rho is material density, c is heat capacity, Q is heat metabolic rate, and the subscript bl denotes values for blood. Core body temperature was allowed to depend on many parameters such as Whole-body SAR, respiration, perspiration, heat lost by radiation, conduction and convection3. Blood perfusion was allowed to vary according to local temperature4.
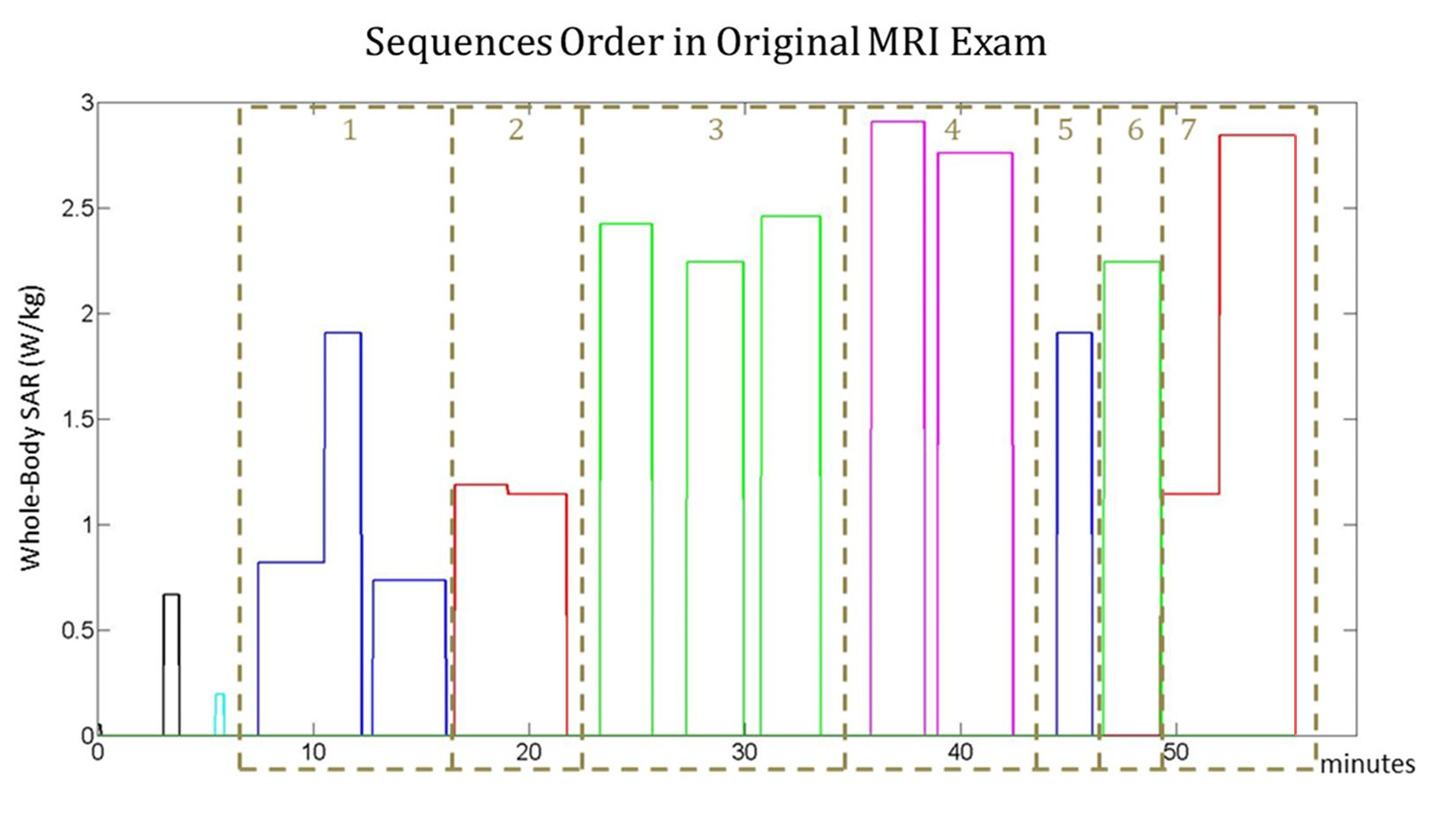
The possibility to minimize the thermal dose was evaluated for the same sequences used in the work where maximum temperature is minimized by changing the arrangement of the sequences2. Similarly, the sequences were assigned to 7 groups where, except the first low-SAR localizers, each group is composed of successive sequences performed with the patient table in the same position.
The 7 groups were ordered according to all the possible permutations, and for each combination the temperature and thermal dose were computed.
Temperature simulations were performed with a revised version of a fast method to compute temperatures5, where temperature is computed by summing the thermal responses $$$T_{on}$$$ of each single group. The responses are shifted to the time position of each group ($$$t_n$$$), and the temperature is given by:
$$$T(r,t) = \sum_{n=1}^{7} T_{on}(r, t-t_n)$$$ (2)
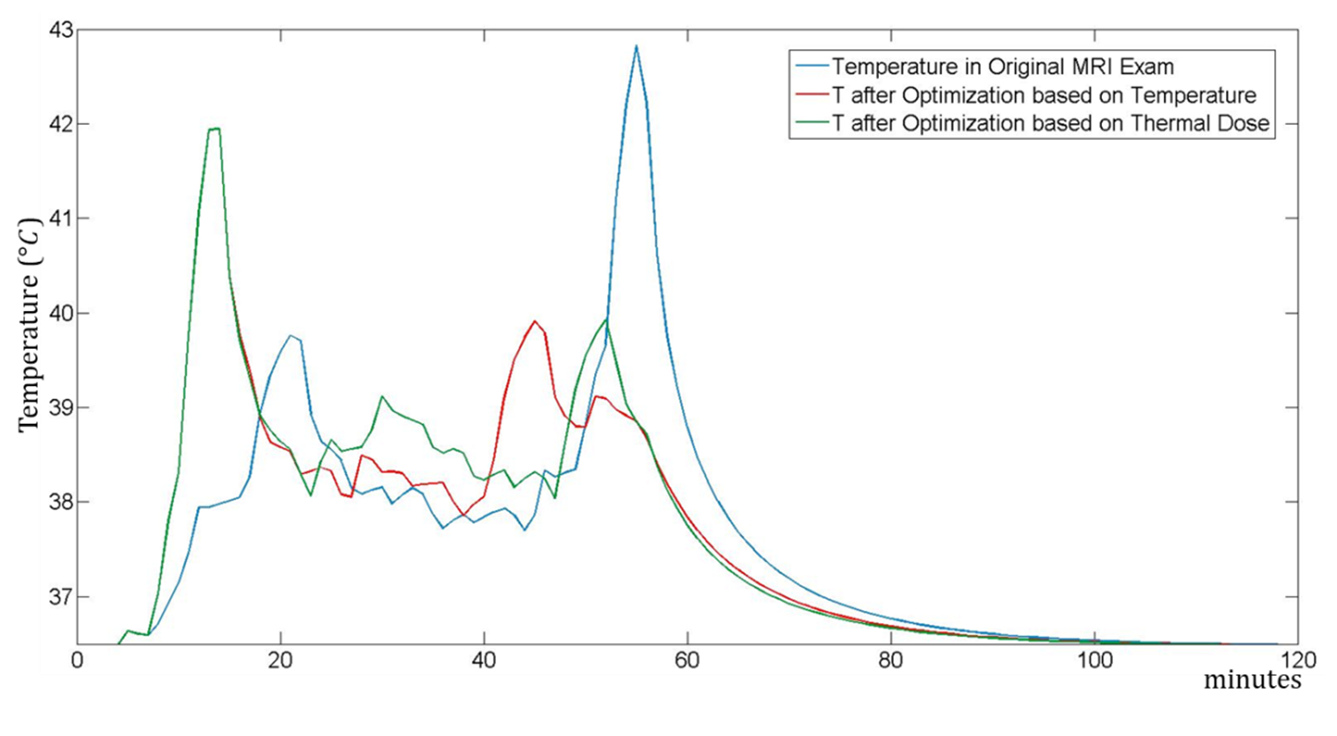
The nonlinear effects are computed with the help of a fast digital spatial filter5. Even though the duration of the exam was less than one hour, the temperature was computed considering a 2 hour period to include the contribution of the cooling period in the thermal dose computation .
The thermal dose $$$CEM_{43}$$$ (Cumulative Effective Minutes at 43 °C) was computed with the equation.
$$$CEM_{43}(r) = \sum_{m=1}^{72}R^{43-T_m(r)}$$$ (3)
where $$$m$$$ denotes the time (minutes), $$$T_m$$$ the temperature at the $$$m^{th}$$$ minute, and R is a parameter equal to 0.5 for $$$T_m$$$ > 43 $$$^{\circ}C$$$ and 0.25 for $$$T_m$$$ < 43 $$$^{\circ}C$$$ 6.
The combination that provides the minimum thermal dose is further optimized by adjusting the time delays between each sequence without increasing the total exam duration.
Results and Discussion
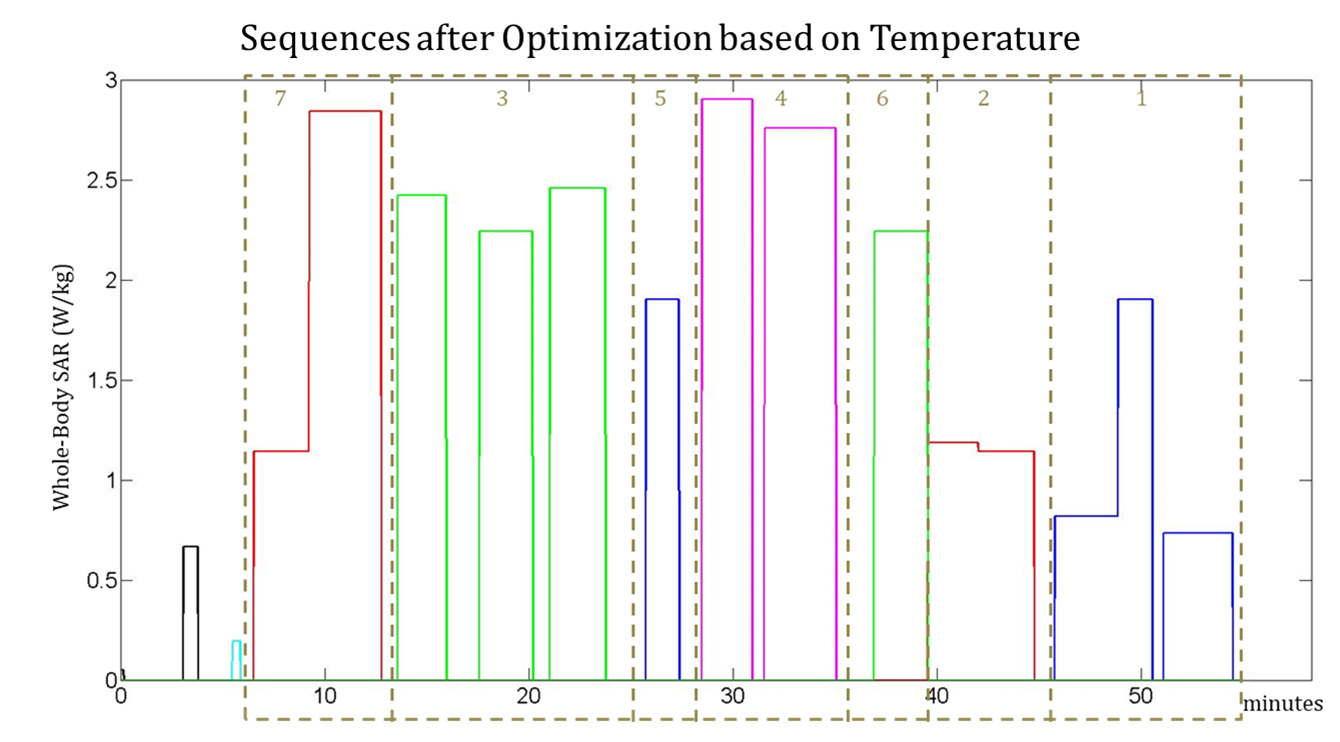
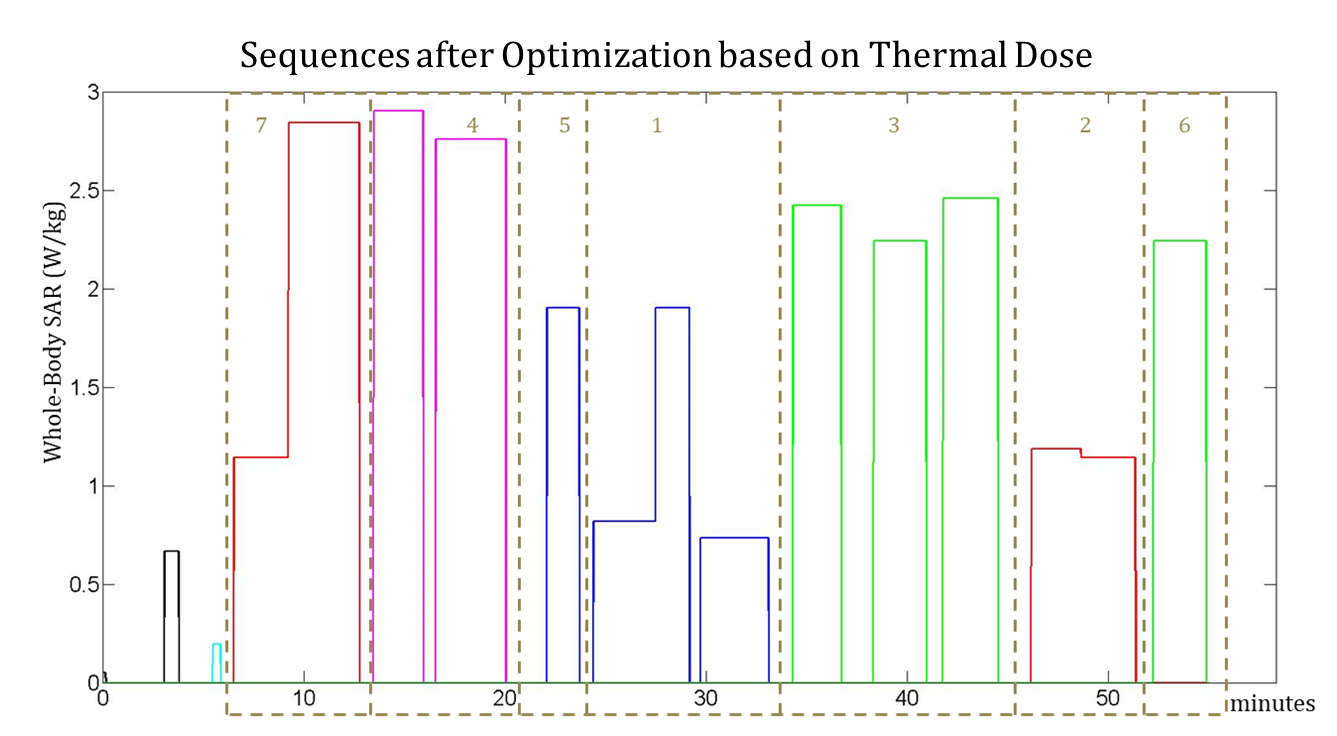
Fig. 1, Fig. 2 and Fig. 3 show the original order of the sequences, the order of the sequences after the optimization to minimize the maximum temperature, and the order of the sequences after the optimization to minimize the thermal dose, respectively. The maximum temperature and thermal dose are respectively equal to 42.83 °C and 1.72 equivalent minutes in the original exam, 41.94 °C and 1.09 equivalent minutes when the order is optimized to minimize the maximum temperature, 41.94 °C and 0.80 equivalent minutes when the order is optimized to minimize the maximum thermal dose. The order of the sequences has a more significant impact on the maximum temperature and maximum thermal dose than does the optimization of the time gaps between the sequences. The timecourse of temperature for the three considered cases is reported in Fig. 4.
The results obtained in this work and in the one where temperature was minimized are promising and encourage the use of temperature and thermal dose to improve safety in MRI: in fact, since temperature is both more relevant than SAR to safety and is affected by numerous parameters, it is possible to develop solutions to reduce temperature and thermal dose that safety assessment methods based on SAR would not allow.
Acknowledgements
No acknowledgement found.References
1. Yarmolenko PS, Jung Moon E, Landon C, Manzoor A, Hochman DW, Viglianti B, Dewhirst MW Thresholds for thermal damage to normal tissues: an update. International Journal of Hyperthermia, 2011; 27(4), 320-343.
2. Carluccio G, Collins CM. Optimization of the Order and Spacing of the Sequences to Reduce the Maximum SAR-Induced Temperature Reached During an MRI Examination. In Proceedings of the 25th Annual Meeting of ISMRM, Honolulu, HI, USA, 2017, p. 5580.
3. Adair ER, Berglund LG. On the thermoregulatory consequences of NMR imaging. Magnetic resonance imaging. 1986 Jan 1;4(4):321-33.
4. Wang Z, Lin JC, Vaughan JT, Collins CM. Consideration of physiological response in numerical models of temperature during MRI of the human head. Journal of Magnetic Resonance Imaging. 2008 Nov 1;28(5):1303-8.
5. Carluccio
G, Bruno M, Collins CM. Predicting long‐term temperature increase for
time‐dependent SAR levels with a single short‐term temperature response.
Magnetic resonance in medicine. 2016 May 1;75(5):2195-203.
6. Van Rhoon GC, Samaras T, Yarmolenko PS, Dewhirst MW, Neufeld E, Kuster N. CEM43° C thermal dose thresholds: a potential guide for magnetic resonance radiofrequency exposure levels? European radiology, 2013, 23(8):2215-27.
Figures