4171
Assessment of Immediate Response to Irreversible Electroporation for Targeted Ablation of Liver Tissues Using Dynamic Contrast Enhancement in a Rabbit ModelJunjie Shangguan1,2, Matteo Figini1, Chong Sun1,3, Liang Pan1,4, Bin Wang1,5, Quanhong Ma1, Kang Zhou1,6, Na Shang1, and Zhuoli Zhang1
1Department of Radiology, Northwestern University, Chicago, IL, United States, 2Driskill Graduate Program, Northwestern University, Chicago, IL, United States, 3Orthopedics, Qilu Hospital, Shandong University, Jinan, China, 4Radiology, The Third Affiliated Hospital of Soochow University, Changzhou, China, 5General Surgery, Nanfang Hospital, Southern Medical University, Guangzhou, China, 6Peking Union Medical College Hospital, Chinese Academy of Medical Science and Peking Union Medical College, Beijing, China
Synopsis
Irreversible electroporation (IRE) may be visualized by MRI immediately post-procedure to monitor and assess tissue response peri-operatively. Dynamic contrast-enhanced MRI (DCE-MRI) allows measurement of tissue perfusion. We will demonstrate that DCE-MRI allows early visualization of IRE ablated tissue margins for prediction of the ablated region and quantification of tissue response. 6 rabbits underwent IRE ablation of the liver and pre-IRE and post-IRE DCE-MRI. A decrease in post-IRE apparent diffusion coefficients in the ablated region compared with baseline indicates tissue damage. Post-IRE AUC is decreased compared with baseline, suggesting decreased but still present blood perfusion in the ablated region post-IRE.
Introduction
Irreversible electroporation (IRE) is electroporation at high voltages to cause permanent pores in the cell membrane and eventually cell death in the irreversibly ablated zone (irreversible zones), surrounded by a penumbra of tissue where pore formation in cells are reversible (reversible zones).1 Treatment area may be visualized by MRI immediately post-IRE to allow peri-operative monitoring of treatment.2 Therefore, assessment of tissue response to IRE may be critical. Dynamic contrast enhanced MRI (DCE-MRI) allows measurement of tissue perfusion, vascular blood flow, and permeability. In this study, we hypothesized that DCE-MRI will permit early quantification of IRE ablation response. We will demonstrate that DCE-MRI can visualize the IRE ablated tissue margin (differentiating reversible / irreversible zones) to provide an accurate prediction of the ablated tissue region.Methods
All experiments were approved by institutional animal care and use committee. 6 healthy rabbits (New Zealand White, Covance, Princeton, NJ, USA) underwent IRE ablation as well as pre-IRE and post-IRE DCE-MRI with injection of 8μL/g Gd-DTPA solution (Magnevist®; Berlex, Montville, NJ, U.S.A). All images – T1 FLASH, T2, DWI, and DCE – were acquired using a knee coil (Tx/Rx 15-Channel Knee Coil; Siemens Medical Solutions, Erlangen, Germany) in a 3.0-T clinical MR imaging unit (Magnetom Skyra; Siemens Medical Solutions, Erlangen, Germany), with acquisition parameters summarized in Figure 1. TR values for T2WI and DWI are given as an average as images are acquired under respiration trigger. Prior to imaging, anesthesia was induced in rabbits by intramuscular injection of 20-40 mg/kg ketamine. Images were acquired immediately before and after IRE ablation. IRE procedure was performed in a surgical suite adjacent to the scanning room. Liver was accessed by a 10 cm longitudinal incision down the abdominal midline. IRE was performed using 0.4 mm diameter 10 mm 2 Needle Array Tips and a BTX Electroporator (ECM830; Harvard Apparatus, Holliston, Mass). All subjects received 8 pulses at 2000 V and 100 µs/pulse in the left lobe of the liver. The apparent diffusion coefficient (ADC) map was computed from DWI images using Matlab (Mathworks, Natick, MA, USA). DCE images were processed using JIM7 (Xinapse Systems, West Bergholt, United Kingdom), and the Area Under Curve (AUC) was calculated from the time of the first contrast appearance for different durations: 30, 60, 90, 120, 150, and 180 s. All statistical analyses were performed in R (RStudio, Boston, MA, USA).Results
Representative T1 and T2 images pre- and post-IRE are shown in Figure 2A. Lesions from IRE ablation are consistently hyperintense in T1-FLASH and T2 images. Average ADC values were calculated for the ablated region at baseline and post-IRE. T1W post-injection images showed increased intensity in the ablaged region. Figure 2B is a bar graph of average ADCs for rabbits at baseline and post-IRE. Signed rank test demonstrated a significant decrease in ADC values at post-IRE compared with baseline. Figure 2C is a bar graph of the average AUCs of all tested rabbits at each time point during DCE-MRI acquisition at baseline and post-IRE. Ranked sum test indicates a significant decrease in AUCs post-IRE compared with baseline.Results and Conclusion
A decrease in post-IRE ADC values in the ablated region compared with baseline indicates a decrease in water diffusion and thus tissue damage within the ablated region. The post-IRE AUC is decreased compared with baseline. This suggests that blood perfusion is decreased compared to baseline but is still present in the ablated zone even after IRE ablation. We will further confirm the imaging results with histology of the ablated area to determine blood vessel damage.Acknowledgements
This work was supported by grants R01CA196967 and R01CA209886 funded by the USA National Cancer Institute (National Institutes of Health).References
- Guo Y, Zhang Y, Nijm, G, et al. Irreversible electroporation in the liver: contrast-enhanced inversion-recovery MR imaging approaches to differentiate reversibly electroporated penumbra from irreversibly electroporated ablation zones. Radiology. 2011;258(2):461-8.
- Zhang Y, Guo Y, Ragin A, et al. MR Imaging to Assess Immediate Response to Irreversible Electroporation for Targeted Ablation of Liver Tissues: Preclinical Feasibility Studies in a Rodent Model. Radiology. 2010;256(2):424-432.
Figures

Summary of MRI acquisition parameters.
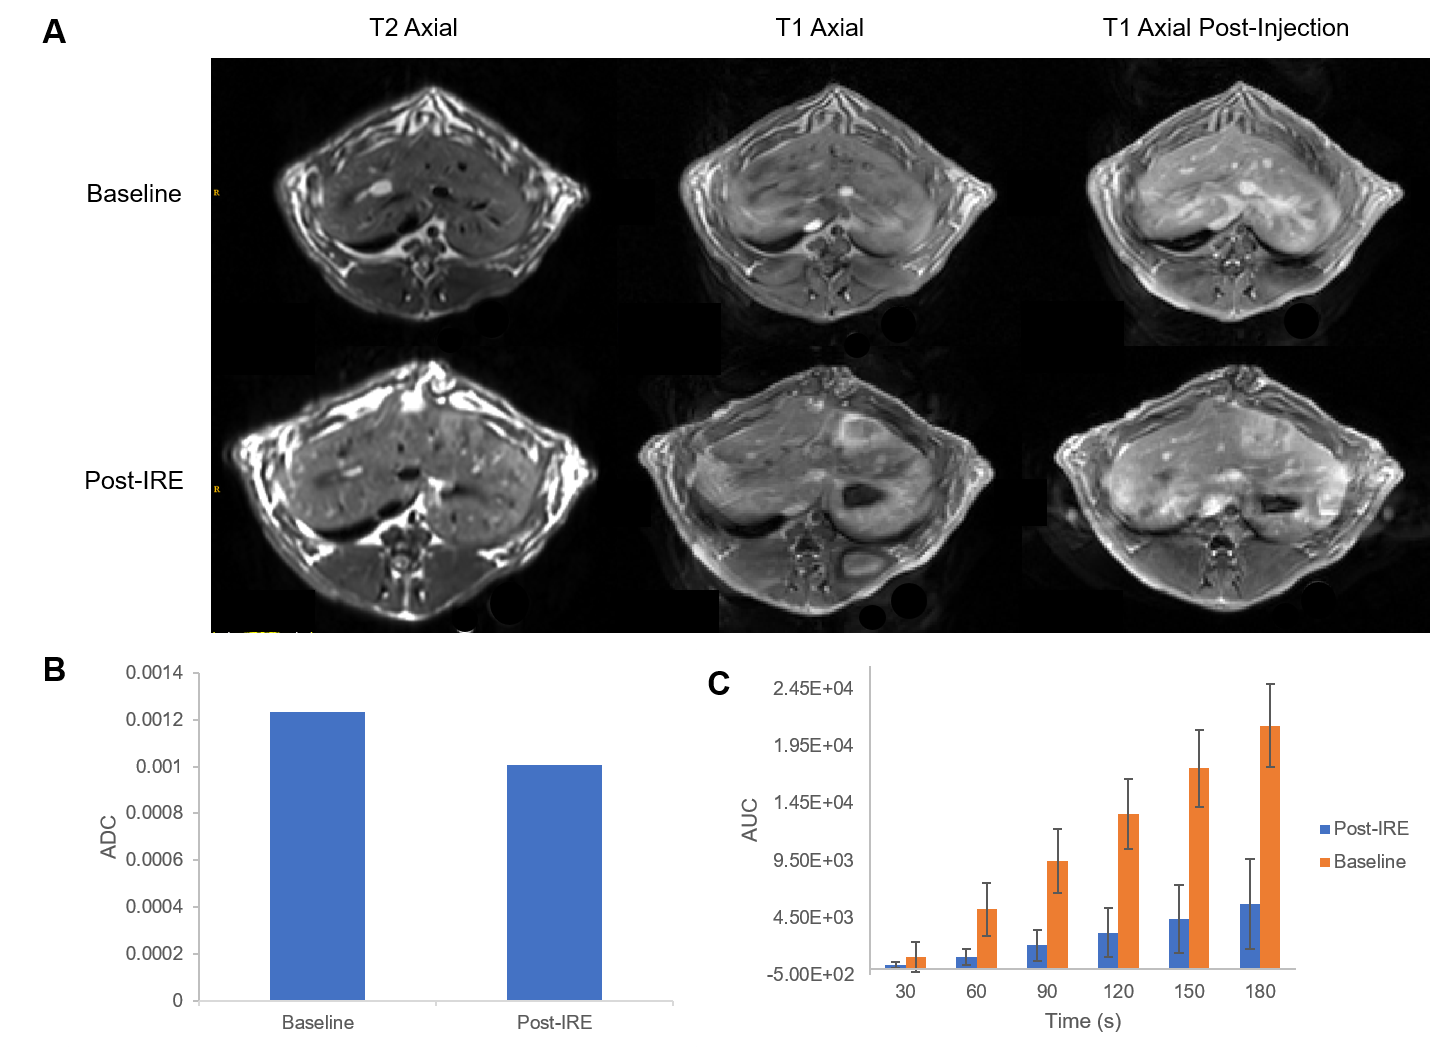
A) Representative T1, and T2 images before and after IRE ablation. IRE
lesions showed increased signal intensity relative to unaffected regions in
both T1 and T2. IRE lesions increased intensity on T1 after injection of
Magnevist. B) Bar graph of ADC values within the ablated region at baseline and
post-IRE. Ranked sum test found significant decrease in post-IRE values
compared with baseline. C) Average AUCs at each time point for both baseline
and treatment. Signed rank test found significant a significant decrease in AUC
concentrations post-IRE compared with baseline.