4166
Imaging latencies for Cartesian and Golden Angle 2D MRI in real-time MR-guided radiotherapy1Radiotherapy, UMC Utrecht, Utrecht, Netherlands, 2Imaging Division, UMC Utrecht, Utrecht, Netherlands
Synopsis
For tumor tracking it is vital to minimize the latency between the moment of anatomic change and its appearance on the MR image. Apart from the temporal footprint of the acquisition, the readout trajectory itself influences the latency. We explore how the latency is minimized by shifting the collection of the center of k-space to the end of the acquisition. For Cartesian sequences this is achieved by changing the profile order, whereas in golden angle acquisitions a smaller window or k-t filter is able to achieve this.
Introduction
Hybrid MR-Linac systems will facilitate continuous beam steering by tracking tumors that move with respiration. In addition to fast image processing[1] and machine control[2] it is vital to minimize the latency between the moment of anatomic change and its appearance on the MR image, in order to successfully implement real-time tumor tracking. An obvious factor that affects the imaging latency is the temporal footprint of the image acquisition. A second factor, however, is the readout trajectory itself. In this work we explore Cartesian and Radial sampling schemes in order to minimize the latency. Based on early work[3] we hypothesize that the imaging latency can be minimized by placing the collection of the center of k-space near the end of the acquisition. In Cartesian readouts this is accomplished by alteration of the readout order, whereas in radial acquisitions a k-t filter is implemented that emphasizes the last acquired spokes. The imaging latency is assessed by simulations and measurement using a motion platform.Methods
The Cartesian experiments were performed on the clinical prototype of the 1.5T MR-Linac (Elekta, SE) while the GA experiments were performed on a 3T system (Philips, NL). The Cartesian sequences were RF-spoiled GRE (TR/TE: 2.8/1.2ms, matrix: 256x256). Partial Fourier factors 0.625, 0.75, 0.825, 1.0 were used in combination with the phase encode orderings ‘linear’, ‘reverse linear’, and ‘high-low’ (Fig. 1). 1D sinusoidal motion was generated using a 4D motion phantom (ModusQA, CA) set to 6s period and 15mm amplitude. The absolute position was recorded on a workstation and served as the gold standard. The reconstructed images were streamed to the same workstation. The combined imaging and reconstruction latency was calculated by fitting a sinusoidal model to the center-of-mass of the high-contrast object.
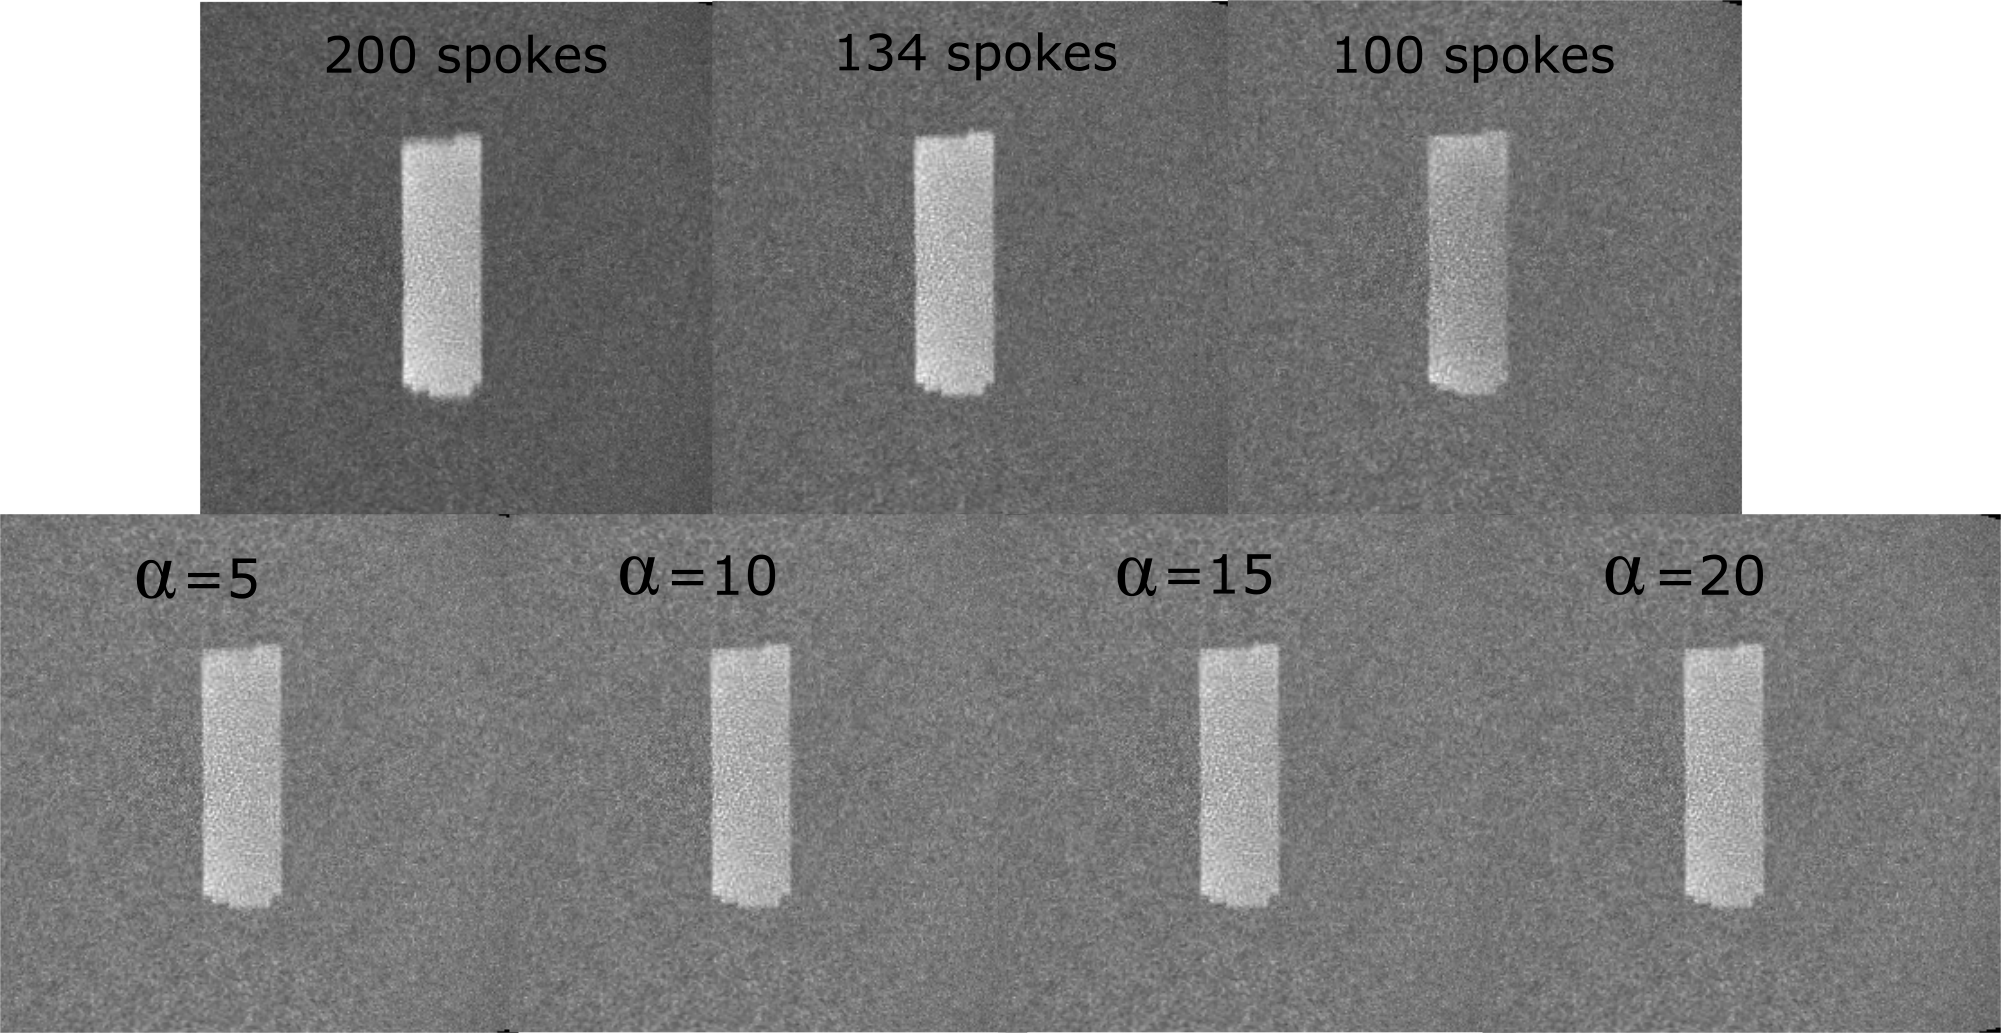
The GA sequence was also a RF-spoiled GRE (TR/TE: 2.8/1.2ms). Reconstruction was performed offline in matlab (The MathWorks, US) using ReconFrame (Gyrotools, CH) and a NUFFT toolbox[4]. To obtain an absolute time base of the reconstructed images, the acquisition time of every tenth spoke was logged and corrected for the time delay between software instruction and hardware execution. The MR was synchronized with the logging of the motion phantom via a time server. The k-t filter has the form $$$(1-\text{sigmoid}(t,\alpha))x^2 + \text{sigmoid}(t,\alpha)$$$, where $$$\alpha$$$ determines the transition from a uniform weighting to a quadratic weighting, penalizing the centers of k-space of the earlier spokes, Fig 2. Sliding window reconstructions without filter and with window sizes 200, 134 and 100 spokes were compared to a k-t filtered reconstruction of 200 spokes withvarying alpha. These experiments were compared to simulations with an analytical phantom.
Results and Discussion
The Cartesian experiments (Fig. 3) showed that PF only has an influence on the latency when a ‘reverse linear’ ordering is used. The ‘high-low’ and ‘linear’ orderings showed constant latencies of 0.17s and 0.55s, respectively. These results are in agreement with the notion that the time from sampling $$$\text{k}=0$$$ until the end of the acquisition determines the imaging latency. Although $$$\text{k}=0$$$ is sampled latest using a ‘high-low’ ordering, the latency is not zero. This is caused by residual latency of earlier profiles and finite reconstruction and data transfer times.
The GA experiments (Fig 4.) showed a linearly decreasing latency with smaller window sizes, where windows of 200, 134 and 100 spokes resulted in 0.31s, 0.22s, and 0.18s latency. The latency with k-t filter approaches 0.19s for $$$\alpha=20$$$. These results are in accordance with the simulations, apart from a 40ms offset. This was probably caused by an error in the time synchronization and needs to be further investigated. The area under the filter is independent of $$$\alpha$$$ and equal to that of a rectangular window of 134 spokes. Interestingly, the latency is significantly lower, and tends to that of a rectangular window of 100 spokes. This is likely due to reduced weighting of the center of k-space over the earlier 100 spokes and uniform weighting over the later 100 spokes. Therefore, the SNR of the k-t filtered scans is independent of $$$\alpha=20$$$, and even shows an advantage over the 100 spoke rectangular window. Furthermore, the k-t filter can help to preserve spatial resolution and minimize streaking, although here the streaking artifacts were dominated by noise (Fig. 5).
Conclusion
Our experiments showed that the latency of Cartesian tracking sequences is minimized by choosing the phase encode ordering such that $$$\text{k}=0$$$ is sampled latest. For GA sequences the measurements showed that it is possible to minimize the latency by either adjusting the window size, or using a k-t filter that emphasizes later spokes.Acknowledgements
No acknowledgement found.References
[1] Roujol et al., MRM. 2010 Apr;63(4):1080-7
[2] Glitzner et al., PMB. 2015c; 60.5:2005-17
[3] Riederer et al., MRM. 1988 Sep;8(1):1–15
[4] Fessler et al., JMR. 2007 Oct; 188(2): 191–195.
Figures
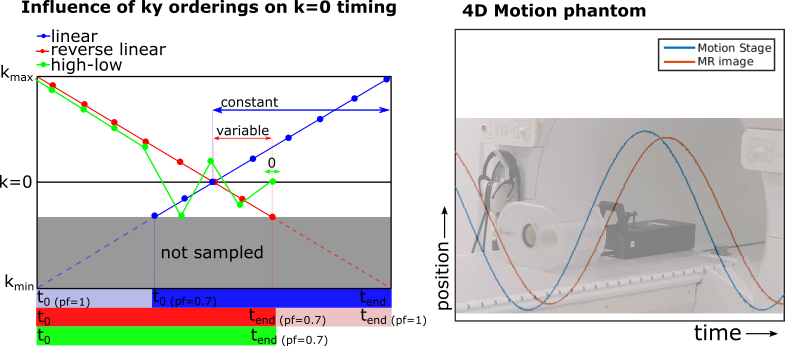
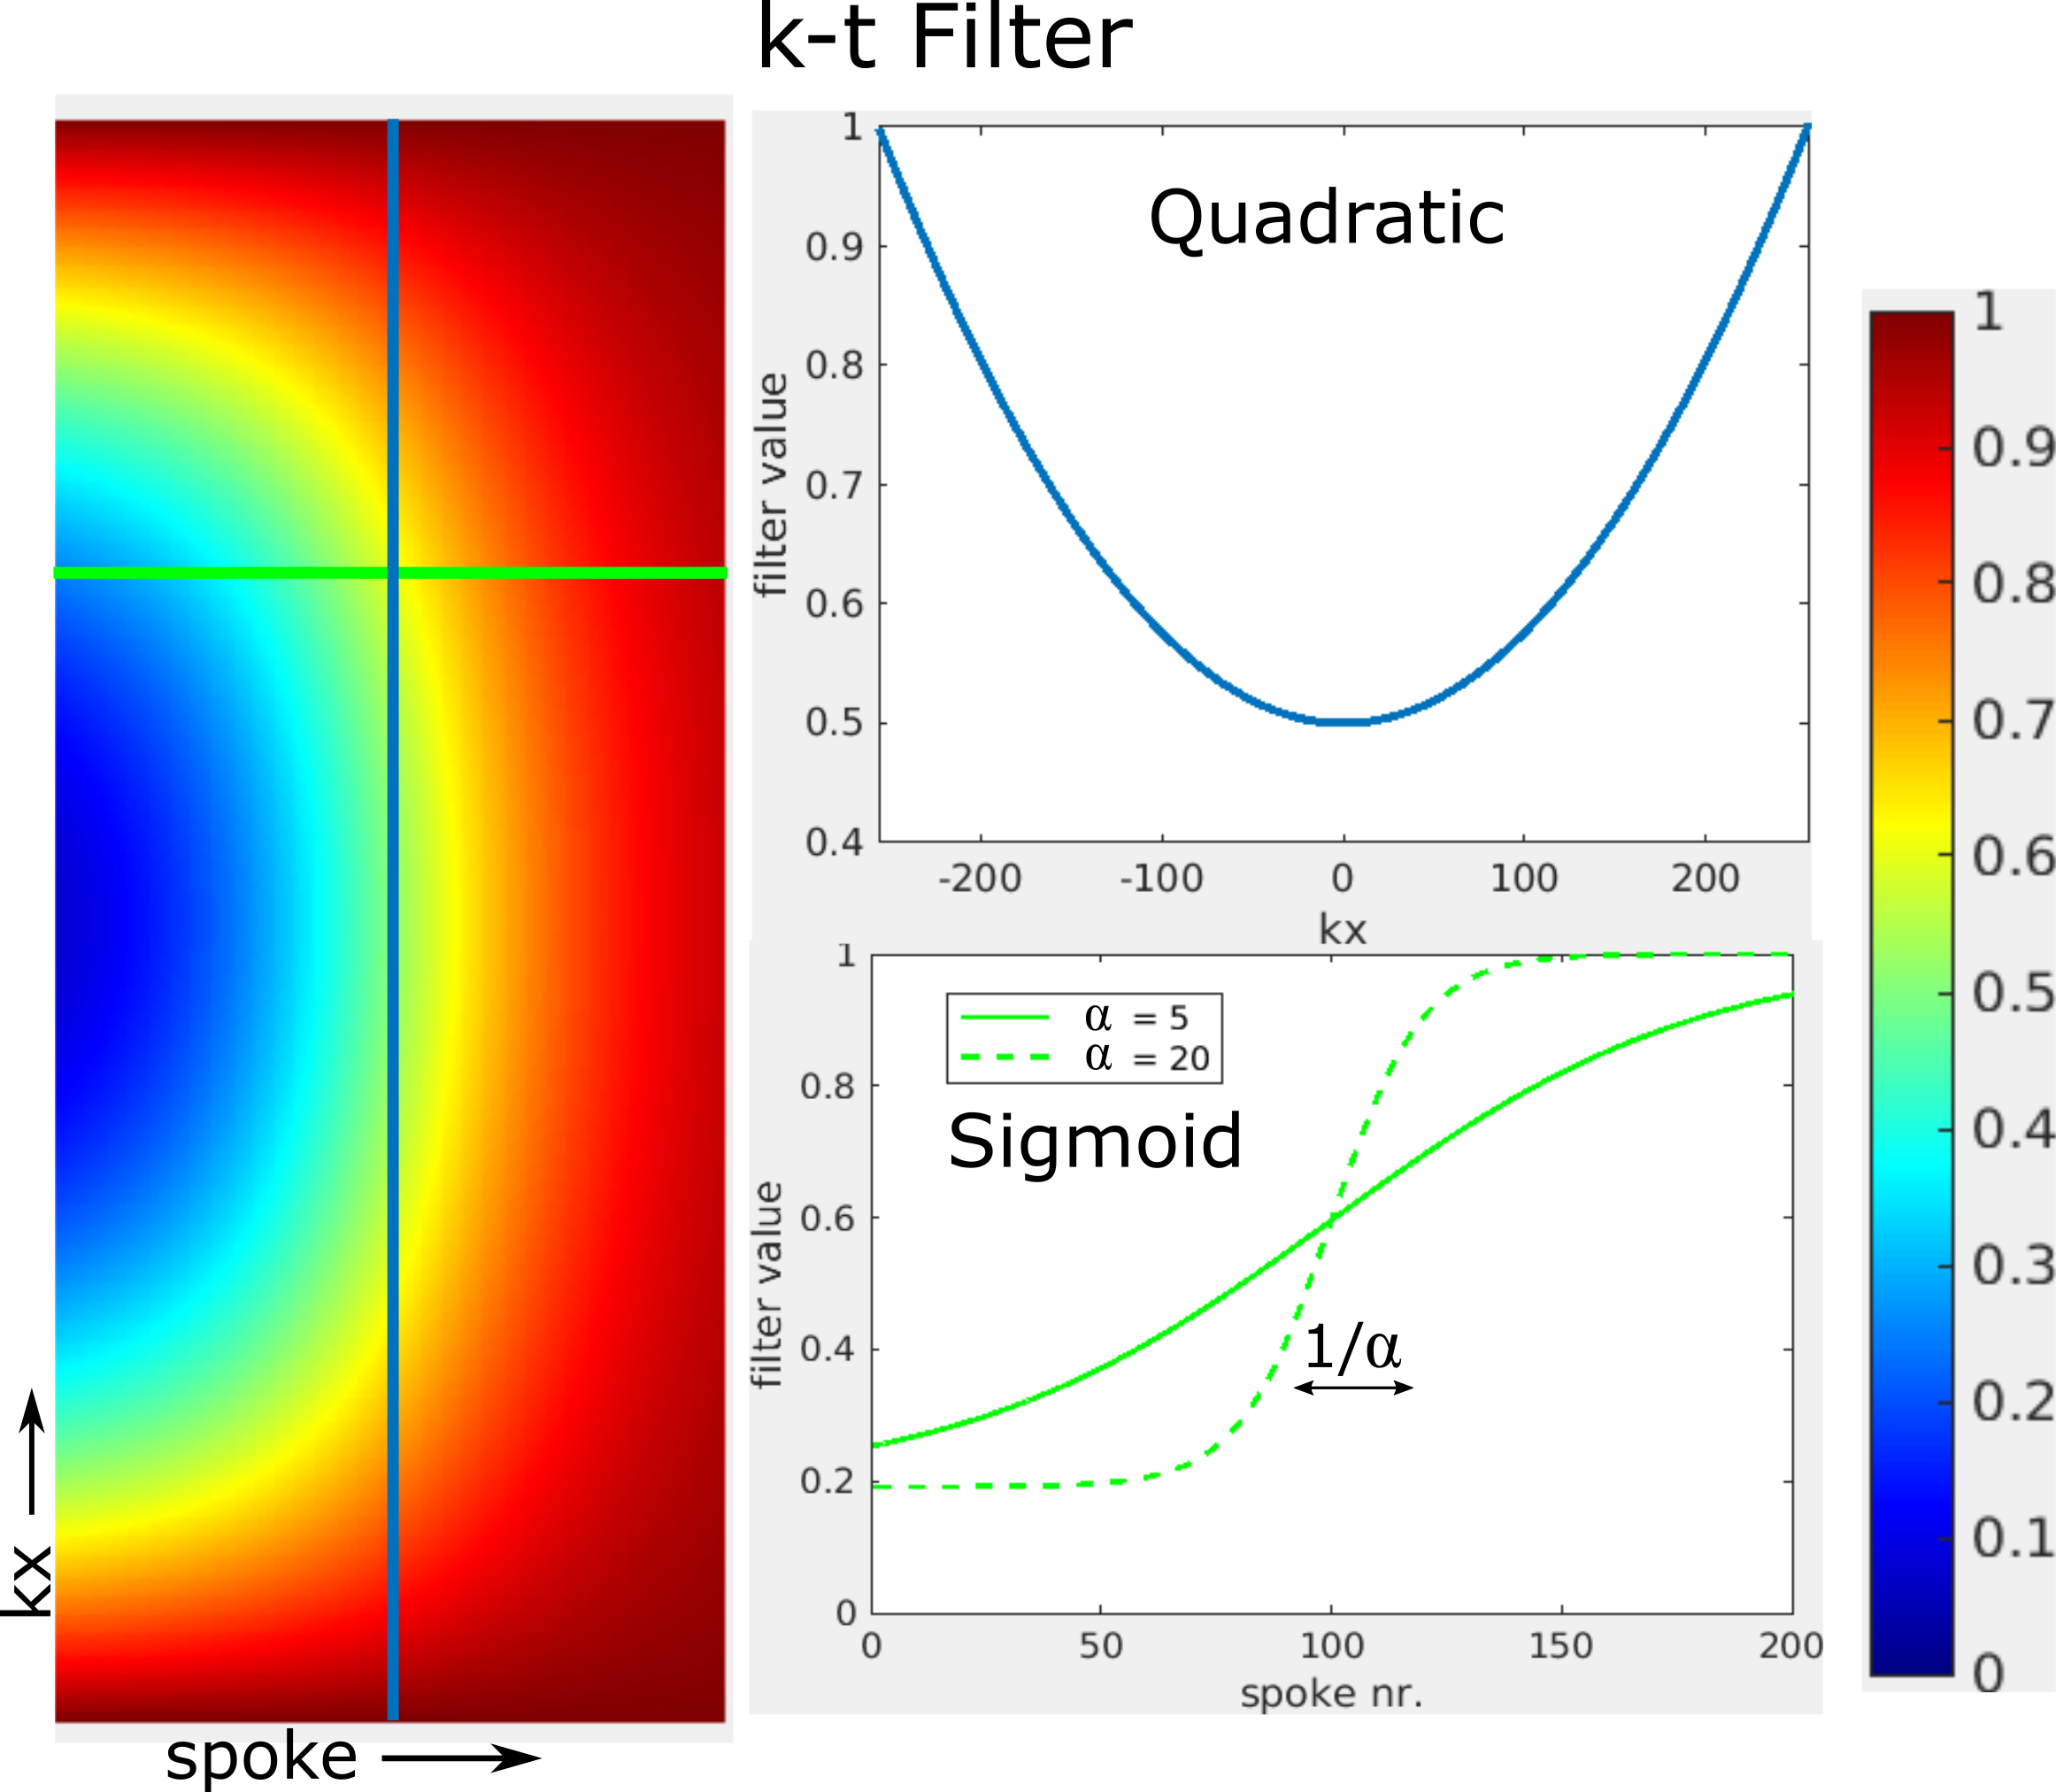
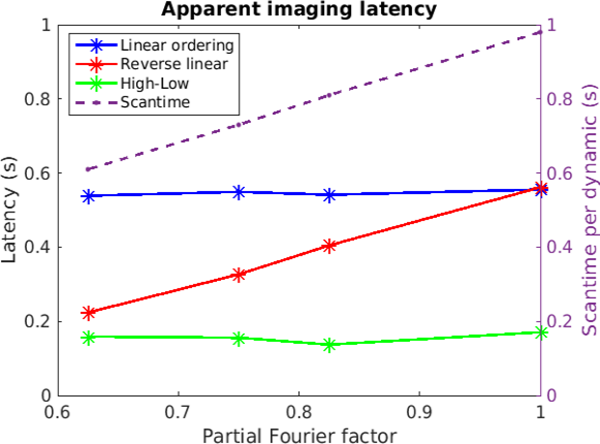
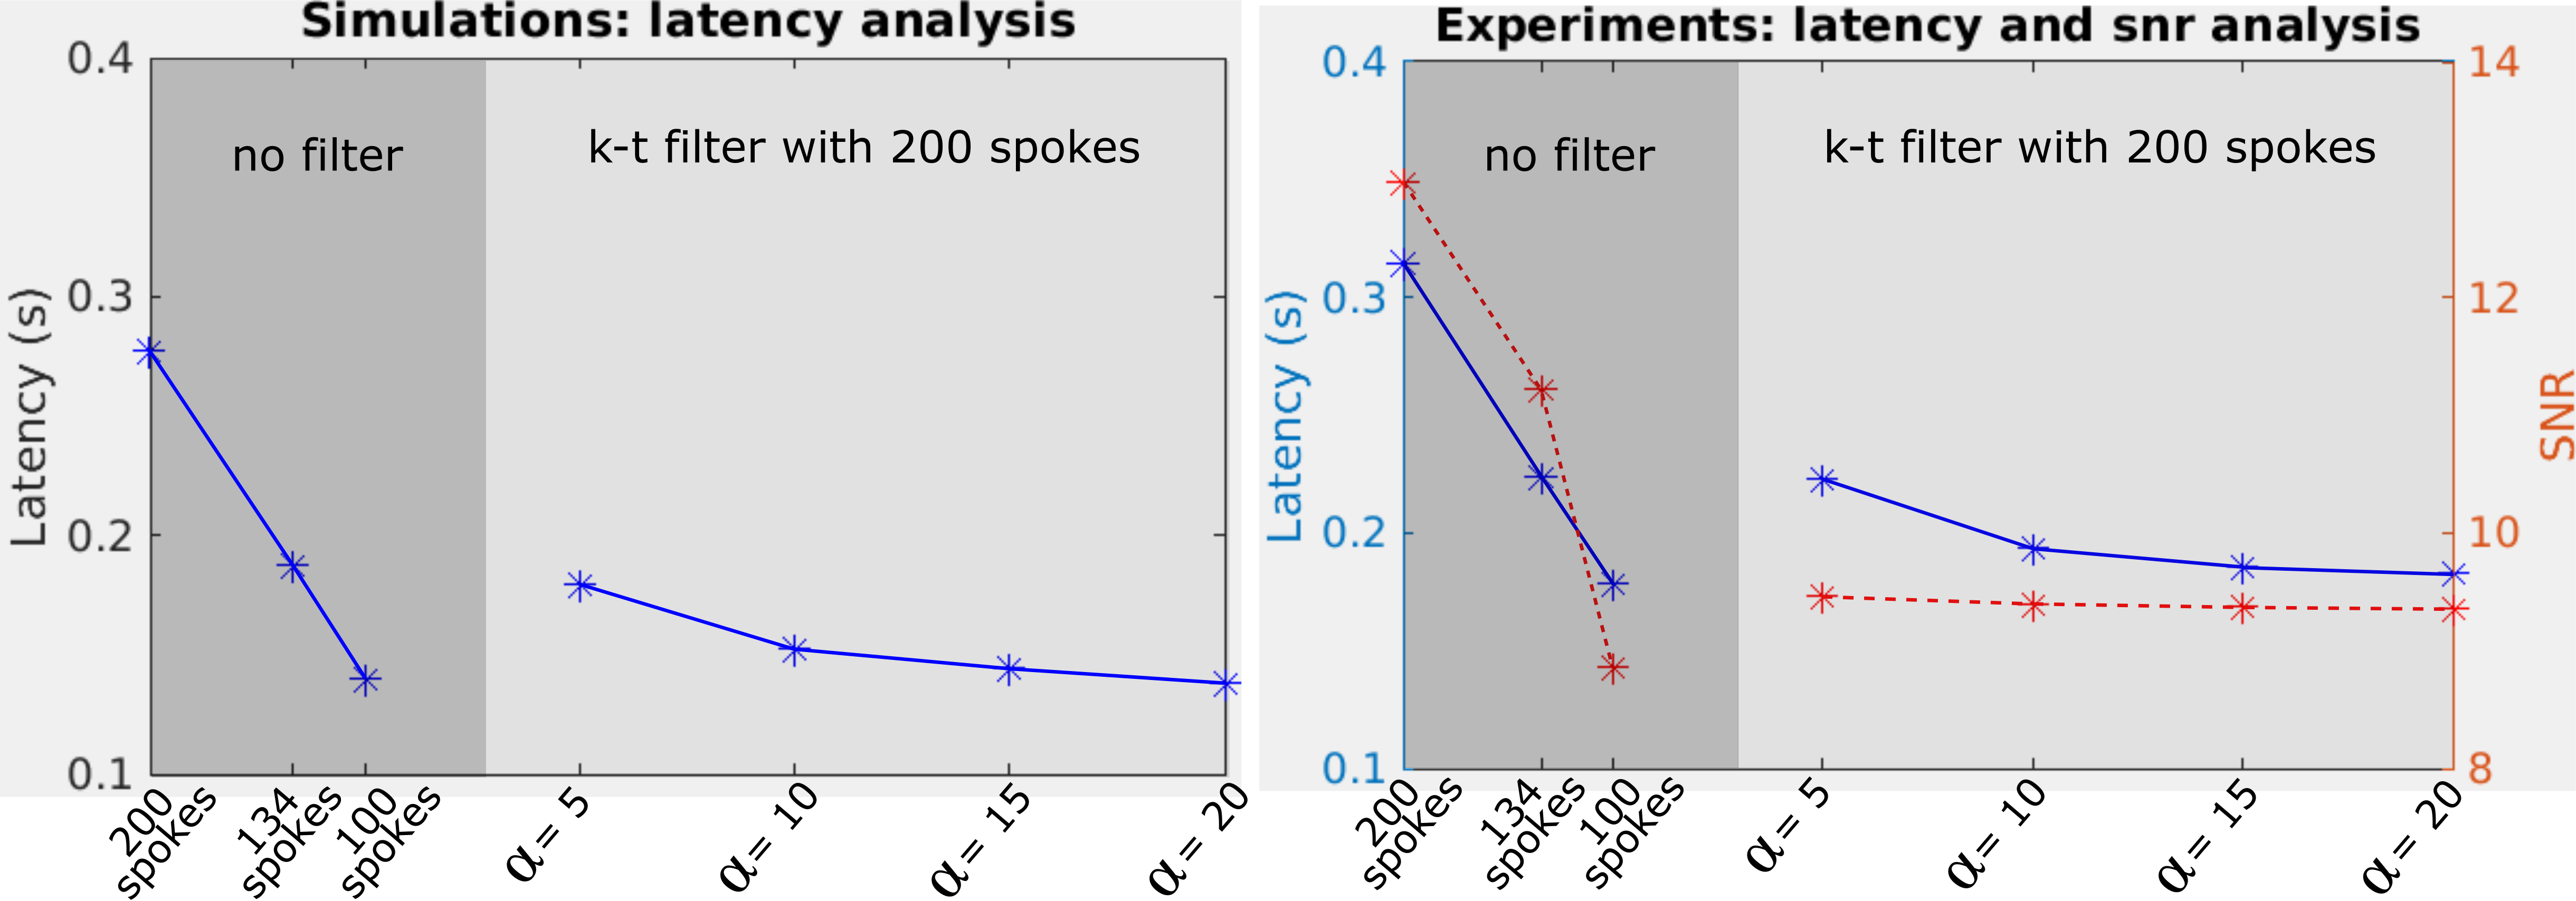
Figure 4: Golden angle latencies from simulations (left) and measurements (right), including SNR values. The gray part shows values obtained using a rectangular sliding window containing 200, 134, or 100 spokes. The other part shows values obtained using a sliding window width of 200 spokes with k-t filter coefficient α = 5,10,15, or 20.