4158
Using 2D image slices for obtaining the guidewire coupling modes of a PTx transmit array1School of Biomedical Engineering & Imaging Sciences, King's College London, LONDON, United Kingdom
Synopsis
A multislice method for measuring relative coupling between elements of a parallel transmit (PTx) array and conductive structures such as guidewires at multiple internal locations. Fast 2D image slices are used to measure the relative coupling along the guidewire inside a large phantom. This is useful during conditions where the coupling modes can only be measured from within the object volume and where current sensors cannot be placed. Such conditions exist in large phantoms and can exist in humans.
Introduction
MRI guidance of interventional procedures using guidewires is limited by potential heating of tissue caused by radio frequency (RF) coupling with the MRI transmit coil 1–3. In a PTx system decoupling modes exist that can reduce RF coupling risks and a procedure for finding them using current sensors on the wire has been demonstrated 4. Previously we demonstrated that the relative coupling could be measured with a single 3D volume acquisition with very low flip angle (vLFA) 5, providing a single measurement that cannot determine all coupling modes. We propose to extend this method to achieve the coupling measurement at multiple locations along the internal portion of the guidewire by acquiring multiple 2D images. This can allow determination of multiple coupling modes offering potential for comprehensive safety control.Theory
The presence of a linear conductor leads to local enhancement of the RF magnetic field (B1+) for any driven transmit coil element, producing a local B1+ enhancement that is determined by currents on the wire. vLFA gradient echo scans have the property that the MR signal is linear in B1+. Since the B1+ field drops off quickly with radial distance, signals acquired at vLFA are dominated by contributions very close to the conductor. This is further reinforced by local receive sensitivity enhancement due to the reciprocal effect of the conductor on the receiving coil. We hypothesize that the hyperintense pixels at the wire location in a 2D image excited with a vLFA RF pulse will provide a measure of the relative coupling at that specific slice location. Each slice location is sampled once per transmit coil, such that, with an N channel Tx-array, the application of N measurement cycles (one per channel) is sufficient to measure a full coupling matrix. The measurement cycles can be highly accelerated by acquiring very small numbers of phase encode steps.Methods
All measurements were performed on a 3T Philips Achieva with an 8-channel Tx/Rx loop coil (Rapid Biomedical GmbH, Germany) using a torso sized phantom filled with 40 liters of poly acrylic acid gel 6 with inserted 90cm long nitinol guidewire (Terumo Corporation, Japan) instrumented by an optically coupled toroidal current sensor 7 placed over its proximal end outside the scanner bore that was connected to the scanner’s spectrometer (Phillips) for digitization. The proposed coupling measurement method was implemented with 5 slices using a 2D spoiled gradient echo sequence (FOV=157mmx400mm, Acq Matrix=132x132, Slice Gap=20mm, Slice Thinkness=10mm, TR=10ms, TE=1.51ms, and nominal FA=7 degrees). In each acquisition a single coil element was used to transmit with all coils used to receive. Coupling/decoupled modes were computed on coupling measurement data (i) from the current sensor and (ii) the proposed method using SVD as in ref 4. The coil array was then driven either in the maximum coupled mode or a pure decoupled mode at the same drive level for a high SAR scan, while temperature at the end of the wire was monitored using a fibre-optic temperature probe (LumaSense Technologies, Inc. USA).Results and Discussion
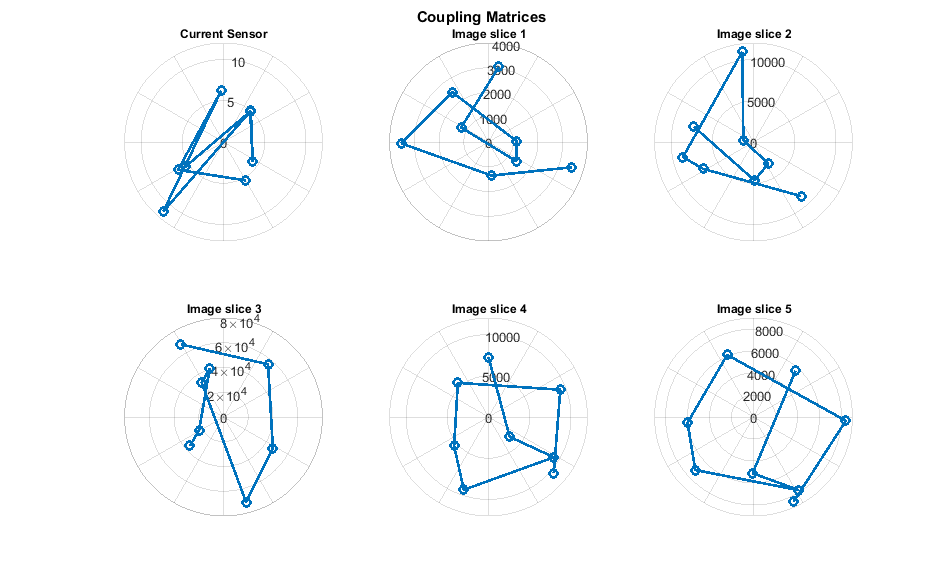
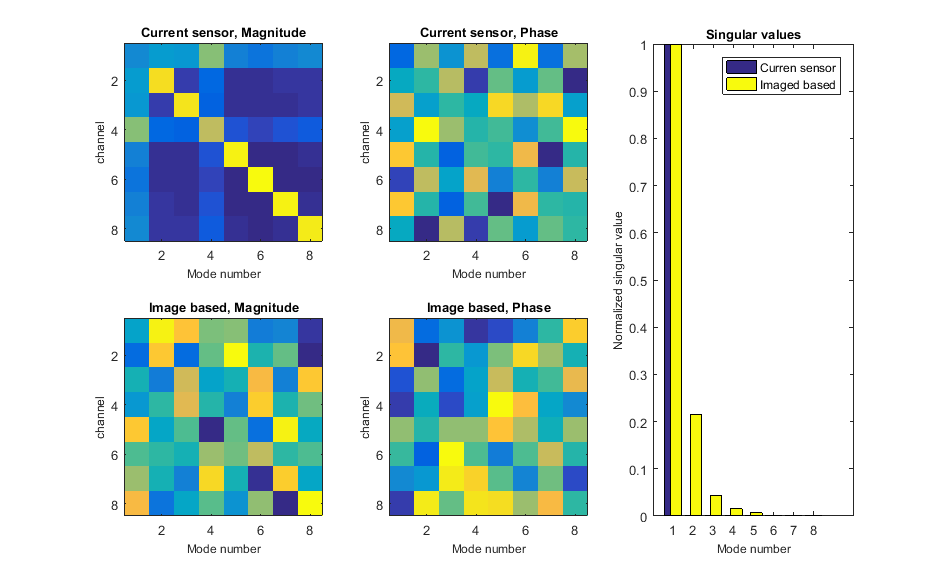
Figure 1 shows signal from pixels on the wire, determined by full imaging, and the measurement from the current sensor. The polar plots are of the magnitude and phase of the coupling matrices. Figure 2 shows the derived coupling modes from each method and their corresponding singular values. It can be seen from the singular values derived from the multislice measurements that there are at least two modes with significantly non-zero values, which would be identified as high coupling modes. A single external sensor cannot identify all of these.
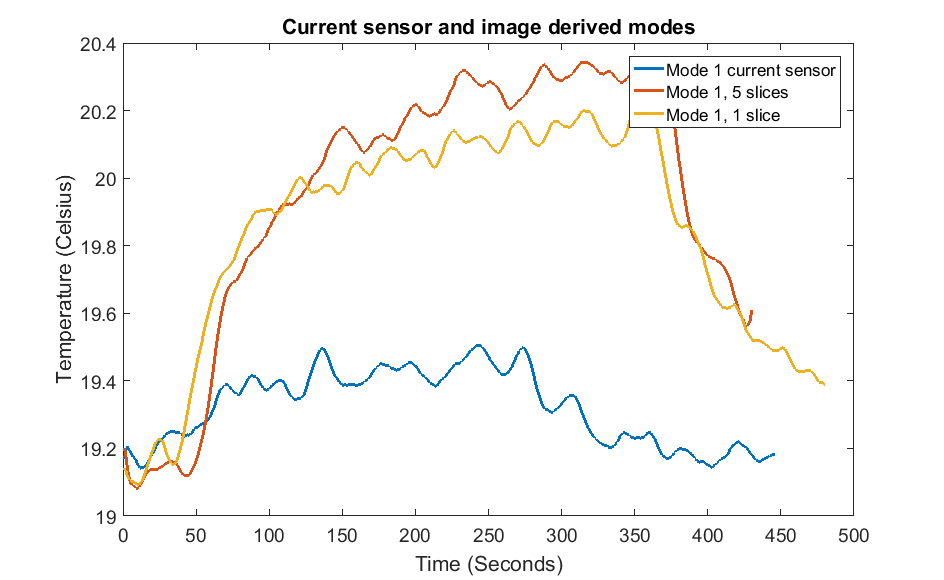
Figure 3 shows the heating results for maximum coupling mode (CM) for each method. A higher degree of heating was observed when using the image-based method, suggesting that this method is able to better identify the worst-case coupling mode for the wire than the current sensor. In addition, using 5 slices rather than one slice led to a larger amount of heating, again suggesting there is a need for multiple measurements of coupling at different spatial positions. This is consistent with previous work 4. By retrospectively down-sampling the acquired image data it was found that only 3 lines of k-space were required to measure the coupling matrix without loss of accuracy.
Conclusion
Active control of guide wire safety will require an ability to rapidly measure coupling, which may change as the wire is manipulated. Although these preliminary experiments used fully sampled 2D imaging, highly reduced sampling would potentially enable full detection at multiple spatial locations in around one second, paving the way for real time monitoring and control.Acknowledgements
This work was supported by the Wellcome EPSRC Centre for Medical Engineering at Kings College London [WT 203148/Z/16/Z], MRC strategic grant [MR/K006355/1] and developmental pathway funding [MR/N027949/1] and by the National Institute for Health Research (NIHR) Biomedical Research Centre based at Guy’s and St Thomas’ NHS Foundation Trust and King’s College London. The views expressed are those of the authors and not necessarily those of the NHS, the NIHR or the Department of Health.References
1. Nitz WR, Oppelt A, Renz W, Manke C, Lenhart M, Link J. On the heating of linear conductive structures as guide wires and catheters in interventional MRI. J Magn Reson Imaging. 2001;13(1):105-114. doi:10.1002/1522-2586(200101)13:1<105::AID-JMRI1016>3.0.CO;2-0.
2. Park SM, Kamondetdacha R, Nyenhuis JA. Calculation of MRI-induced heating of an implanted medical lead wire with an electric field transfer function. J Magn Reson Imaging. 2007;26(5):1278-1285. doi:10.1002/jmri.21159.
3. Griffin GH, Anderson KJT, Celik H, Wright GA. Safely assessing radiofrequency heating potential of conductive devices using image-based current measurements. Magn Reson Med. 2015;73(1):427-441. doi:10.1002/mrm.25103.
4. Etezadi-Amoli M, Stang P, Kerr A, Pauly J, Scott G. Controlling radiofrequency-induced currents in guidewires using parallel transmit. Magn Reson Med. 2015;74(6):1790-1802. doi:10.1002/mrm.25543.
5. Godinez F, Hajnal J, Scott G, Mooiweer R, Malik S. “Pulse-acquire” method for obtaining the guidewire coupling modes of a PTx transmit array. In: Proc. Intl. Soc. Mag. Reson. Med. Honolulu: ISMRM; 2017.
6. ASTM standard F 2182-2002a. Standard test method for measurement of radio frequency induced heating near passive implants during magnetic resonance imaging. ASTM Int. 2002;(December):1-14. doi:10.1520/F2182-11A.1.7.
7. Etezadi-Amoli M, Stang P, Kerr A, Pauly J, Scott G. Interventional device visualization with toroidal transceiver and optically coupled current sensor for radiofrequency safety monitoring. Magn Reson Med. 2015;73(3):1315-1327. doi:10.1002/mrm.25187.
Figures