4157
Transcatheter intra-arterial perfusion (TRIP)-MRI for the evaluation of immediate Irreversible Electroporation effects in the VX2 rabbit liver tumor model.1Radiology, Northwestern University, Chicago, IL, United States, 2Radiology, Peking Union Medical College Hospital, Chinese Academy of Medical Science and Peking Union Medical College, Beijing, China, 3Radiology, The Third Affiliated Hospital of Soochow University, Changzhou, China, 4Orthopedics, Qilu Hospital, Shandong University, Jinan, China, 5General Surgery, Nanfang Hospital, Southern Medical University, Guangzhou, China
Synopsis
Six rabbits with liver tumors underwent anatomical and perfusion MRI immediately after irreversible electroporation (IRE) treatment of the tumors, using a catheter inserted in the left hepatic artery to deliver the contrast agent (TRIP-MRI). All the treated regions showed low perfusion as measured by the Area under the tissue response Curve. In some cases, a rim or a few spots with higher AUC were present, and were presumably associated with the penumbra of reversible electroporation that is known to be present in IRE-treated tissues. TRIP-MRI could be a valuable non-invasive tool to assess IRE effect and to immediately plan retreatment.
INTRODUCTION
Irreversible Electroporation (IRE) is a relatively recent technique for non-thermal tumor ablation, consisting in the application of short high-intensity pulses of electric field that create nanopores in the cellular membrane and ultimately lead to apoptosis in the target tissue1. It has shown promising results in terms of efficiency and lack of side effects2-7. IRE main limitation is the difficulty to predict the extent of the effectively treated area and of the surrounding penumbra of reversible electroporation, which depends on the treatment protocol and on the features of the treated tissues8-10. Non-invasive imaging methods able to evaluate IRE outcome immediately after the procedure would allow retreatment or other interventions to be timely performed and so to reduce recurrence. The purpose of this study is to investigate the potential benefit in this context of Transcatheter Intra-arterial Perfusion (TRIP)-MRI, which has been previously shown to successfully characterize perfusion changes after chemoembolization and radiofrequency ablation of liver tumors11-13. Conversely, to the best our knowledge quantitative perfusion MRI techniques have never been applied to IRE-treated tumors.METHODS
VX2 was incubated in the hind limbs of two donor rabbits (New Zealand White, Covance, Princeton, NJ, USA) and implanted in the left lobe of the liver of 6 additional rabbits that were used for the MRI study. All the rabbits developed at least one tumor, and 3 out of 6 rabbits had a second tumor that was not treated but used as an internal control. About two weeks after implantation, when the tumors had grown to a diameter of about 1 cm, the rabbits were anesthetized with an injection of 30 mg/kg ketamine and a catheter was placed into the left hepatic artery under X-ray digital subtraction angiography guidance. A baseline MRI protocol was then acquired using a knee coil on a 3 T clinical MR imaging unit (Magnetom Skyra; Siemens Medical Solutions, Erlangen, Germany), including an axial T1-weighted gradient-echo sequence (TR/TE=200/2.93 ms, FOV=180x180 mm2, voxel size=0.8x0.8x2.0 mm3) and an axial respiration-triggered T2-weighted spin-echo sequence (TR/TE=1660/39 ms, FOV=180x180 mm2, voxel size=0.5x0.5x2.0 mm3). The IRE procedure was performed in a surgical suite using 8 pulses at 2000 V and 100 µs duration with a 0.4 mm diameter 2 Needle Array Tips and a BTX Electroporator (ECM830; Harvard Apparatus, Holliston, Mass). Immediately after the treatment, the rabbits underwent another MRI scan, including the same sequences as at baseline and a Dynamic Contrast Enhanced (DCE) sequence (TR/TE=2.6/1.02 ms, 250 repetitions, FOV=128x112 mm2, voxel size=1x1x2.0 mm3); the T1-weighted sequence was also repeated after the DCE. The Area Under the Curve (AUC) was calculated from the DCE images using JIM 7 (Xinapse Systems, West Bergholt, United Kingdom), from the time of first contrast appearance for different durations: 30, 60, 90, 120, 150 and 180 s respectively. Regions of interest were placed on the obtained maps in the tumor areas.RESULTS
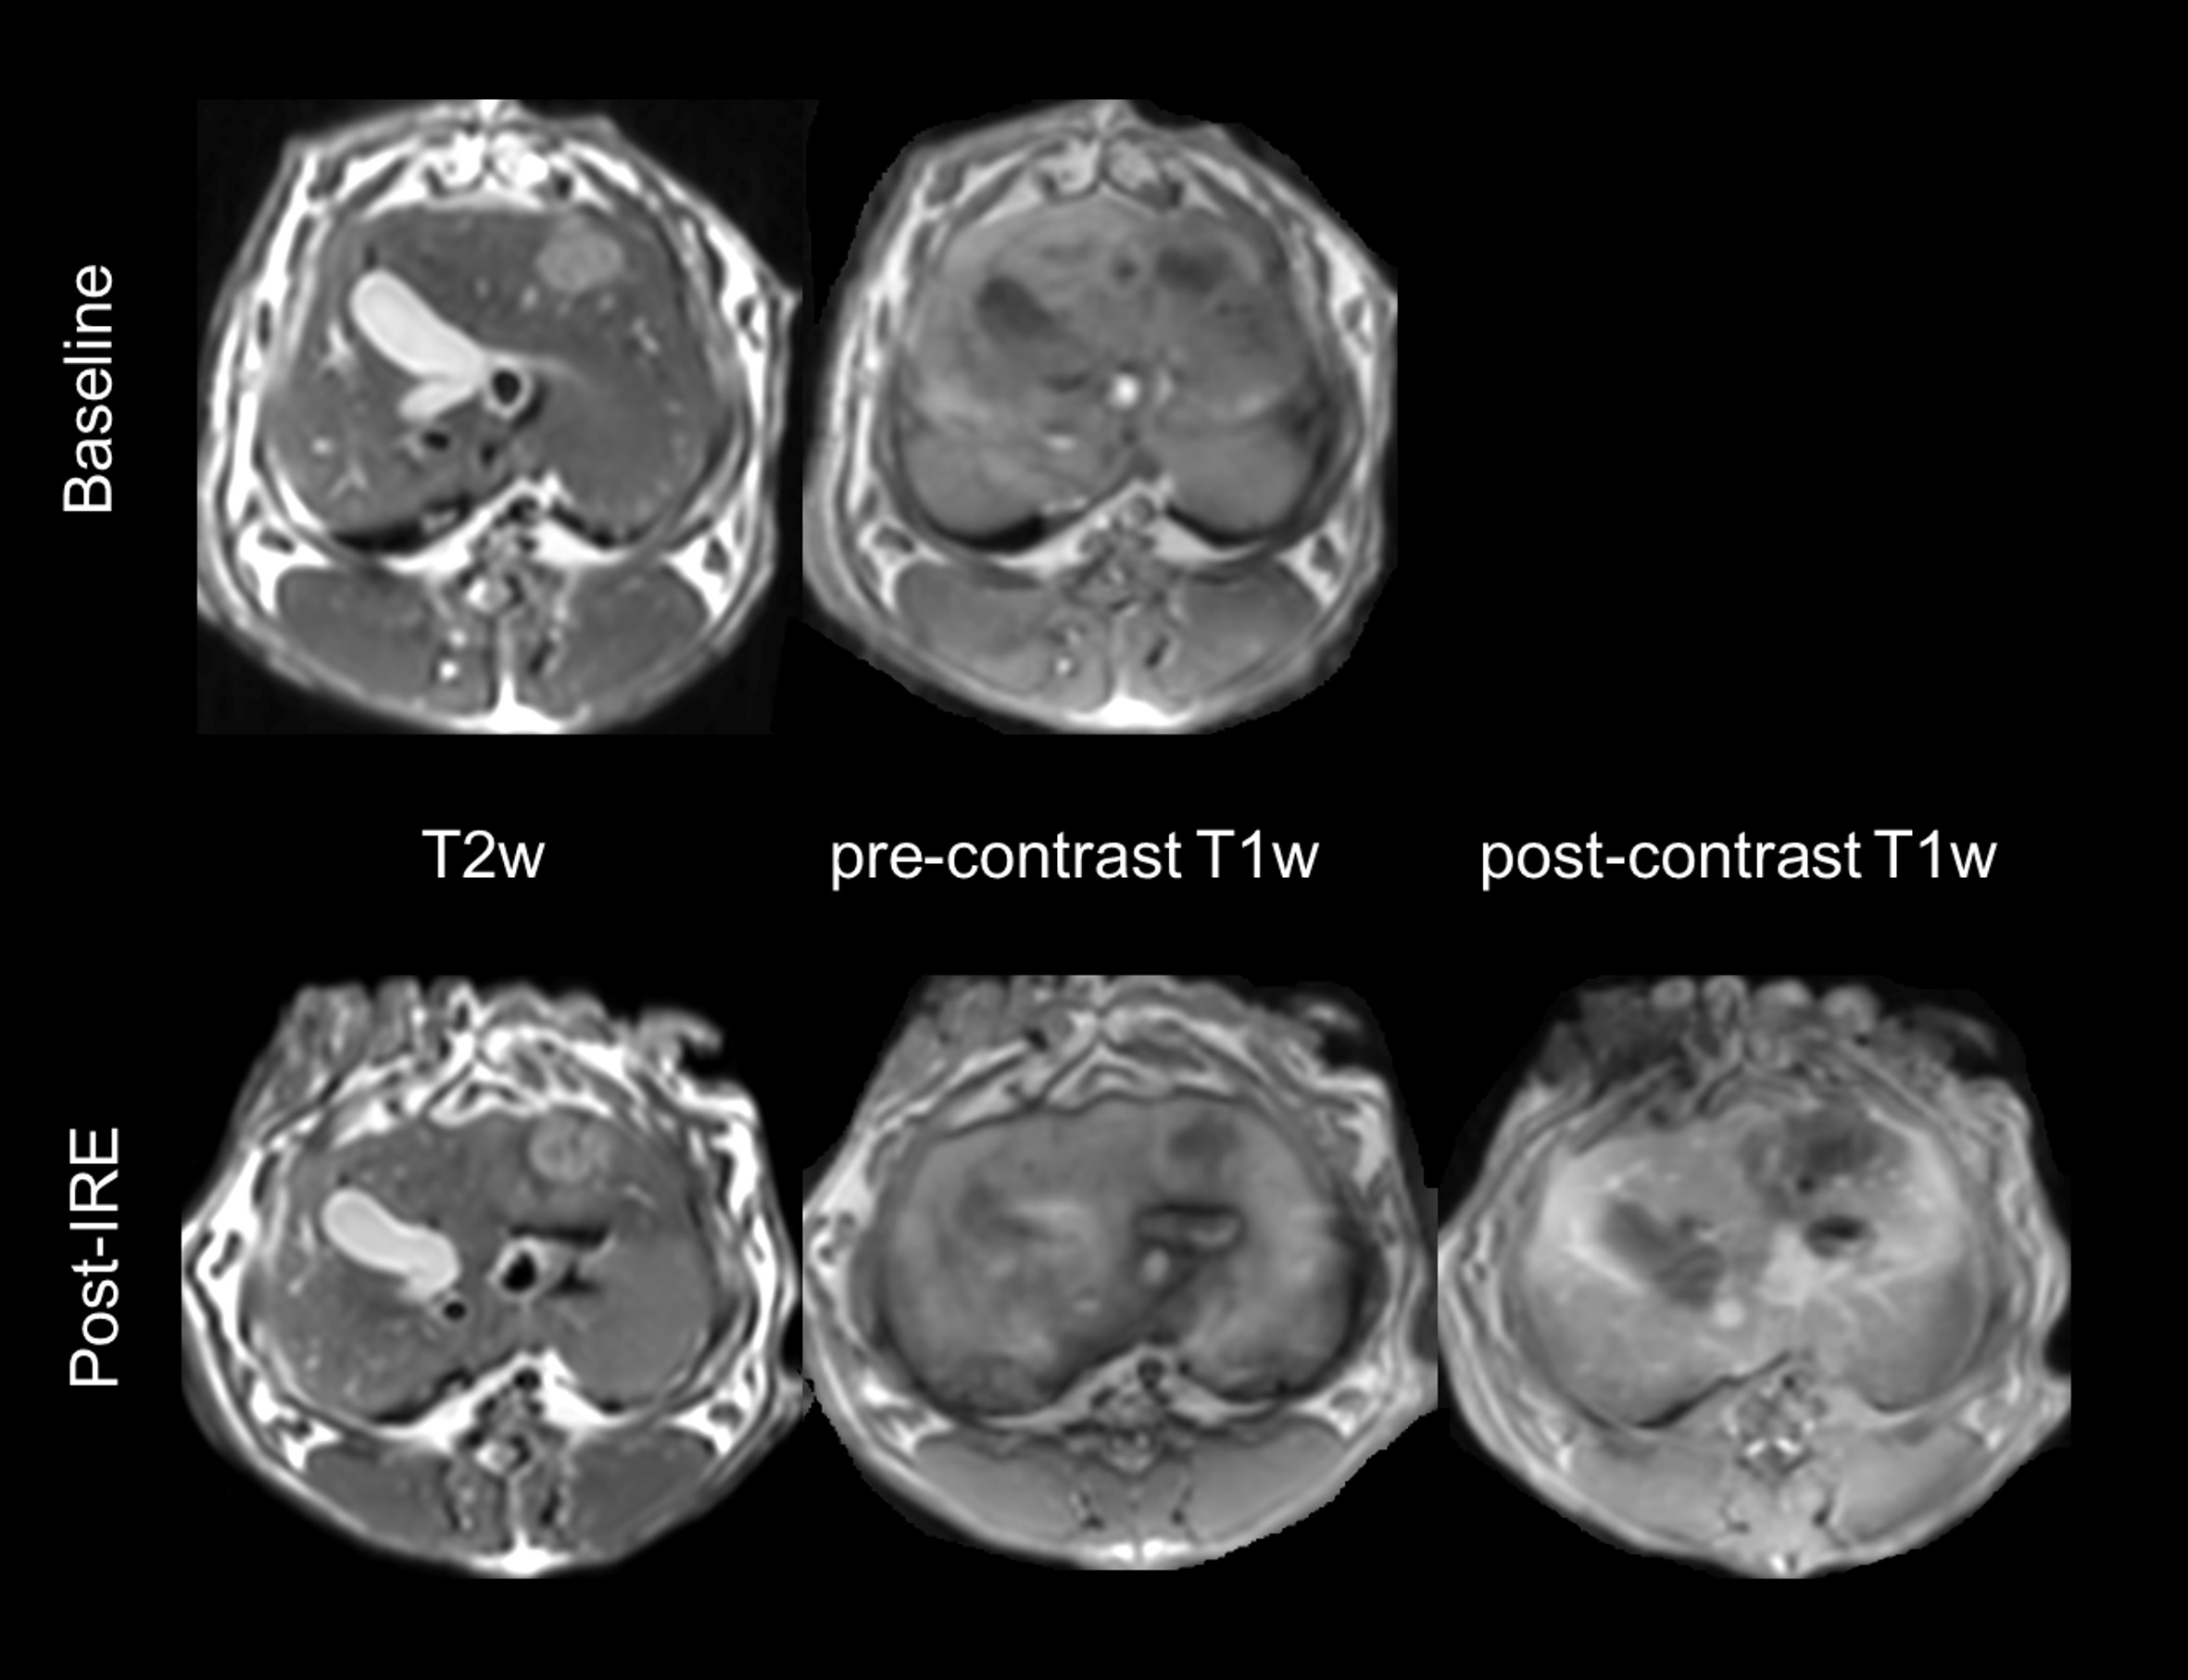
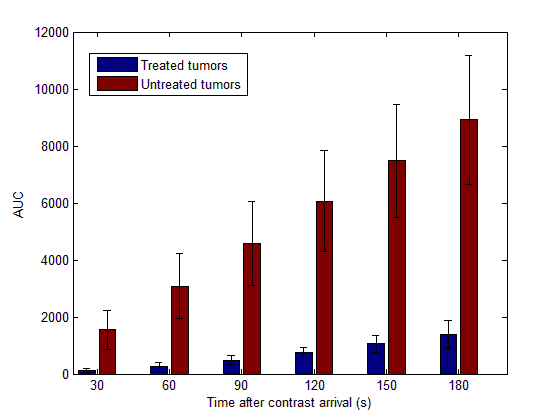
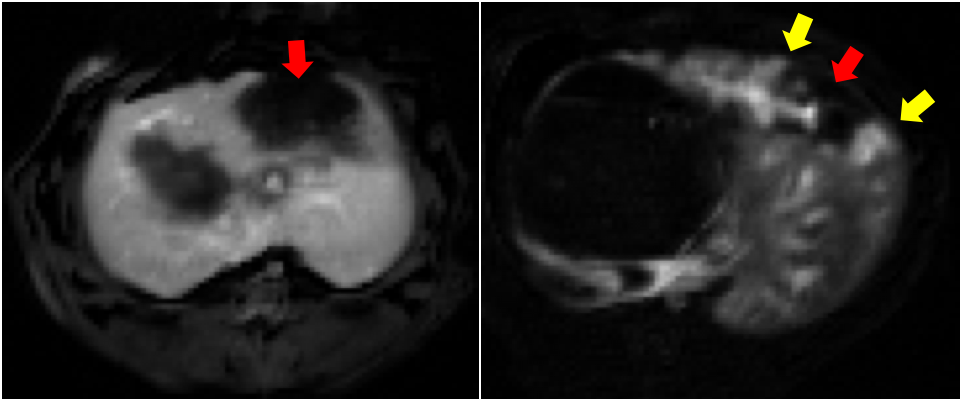
All the tumors appeared quite consistently hyperintense on T2-weighted and hypointense on pre-contrast T1-weighted images, with a less homogeneous signal after IRE treatment (figure 1). On all the AUC maps an area of very low AUC was always present in the treated region, often going beyond the boundaries of the tumor. The mean AUC measured in the center of the treated and untreated tumors is reported in figure 2. At all the considered integration times, the treated tumors had a much lower AUC than the untreated ones, and the difference was statistically significant in all the cases (p < 0.005). In some cases, the low AUC region (red arrows in figure 3) had a sharp boundary with the rest of the liver that presented higher AUC values. In other cases, it was surrounded by a rim or some spots of higher AUC (yellow arrows in figure 3, right panel)DISCUSSION AND CONCLUSION
We have shown that TRIP-MRI is able to show the effects of IRE immediately after the treatment. The main result of this study was an evident area of low perfusion corresponding to the treated region. This area was sometimes surrounded by a rim of spots with higher perfusion, which we assume to be part of the reversible zone or anyway not effectively treated. If these results can be validated and confirmed in a larger population, TRIP-MRI could be a very valuable tool for the early assessment of IRE treatment and could have a great impact on IRE overall efficacy.Acknowledgements
This work was supported by grants R01CA196967 and R01CA209886 funded by the USA National Cancer Institute (National Institutes of Health)References
1. Davalos RV, Mir IL, Rubinsky B. Tissue ablation with irreversible electroporation. Ann Biomed Eng 2005; 33: 223-231.
2. Scheffer HJ, Nielsen K, de Jong MC, van Tilborg AA, Vieveen JM, Bouwman AR, Meijer S, van Kuijk C, van den Tol PM, Meijerink MR. Irreversible electroporation for nonthermal tumor ablation in the clinical setting: a systematic review of safety and efficacy. J Vasc Interv Radiol 2014; 25: 997-1011.
3. Valerio M, Stricker PD, Ahmed HU, Dickinson L, Ponsky L, Shnier R, Allen C, Emberton M. Initial assessment of safety and clinical feasibility of irreversible electroporation in the focal treatment of prostate cancer. Prostate Cancer Prostatic Dis 2014; 17: 343-347.
4. Paiella S, Butturini G, Frigerio I, Salvia R, Armatura G, Bacchion M, Fontana M, D'Onofrio M, Martone E, Bassi C. Safety and feasibility of Irreversible Electroporation (IRE) in patients with locally advanced pancreatic cancer: results of a prospective study. Dig Surg 2015; 32: 90-97.
5. Rossmeisl JH, Jr., Garcia PA, Pancotto TE, Robertson JL, Henao-Guerrero N, Neal RE, Ellis TL, Davalos RV. Safety and feasibility of the NanoKnife system for irreversible electroporation ablative treatment of canine spontaneous intracranial gliomas. J Neurosurg 2015; 123: 1008-1025.
6. Wagstaff PG, de Bruin DM, Zondervan PJ, Savci Heijink CD, Engelbrecht MR, van Delden OM, van Leeuwen TG, Wijkstra H, de la Rosette JJ, Laguna Pes MP. The efficacy and safety of irreversible electroporation for the ablation of renal masses: a prospective, human, in-vivo study protocol. BMC Cancer 2015; 15: 165.
7. Chen X, Ren Z, Zhu T, Zhang X, Peng Z, Xie H, Zhou L, Yin S, Sun J, Zheng S. Electric Ablation with Irreversible Electroporation (IRE) in Vital Hepatic Structures and Follow-up Investigation. Sci Rep 2015; 5: 16233.
8. Jiang C, Davalos RV and Bischof JC. A review of basic to clinical studies of irreversible electroporation therapy. IEEE Trans Biomed Eng 2015; 62: 4-20.
9. Corovic S, Lackovic I, Sustaric P, Sustar T, Rodic T and Miklavcic D. Modeling of electric field distribution in tissues during electroporation. Biomed Eng Online 2013; 12: 16.
10. Ben-David E, Ahmed M, Faroja M, Moussa M, Wandel A, Sosna J, Appelbaum L, Nissenbaum I and Goldberg SN. Irreversible electroporation: treatment effect is susceptible to local environment and tissue properties. Radiology 2013; 269: 738-747.
11. Wang D, Gaba RC, Jin B, Riaz A, Lewandowski RJ, Ryu RK, Sato KT, Ragin AB, Kulik LM, Mulcahy MF, Salem R, Larson AC, Omary RA. Intraprocedural transcatheter intra-arterial perfusion MRI as a predictor of tumor response to chemoembolization for hepatocellular carcinoma. Acad Radiol 2011; 18(7): 828-836.
12. Sato KT, Wang D, Lewandowski RJ, Ryu RK, Klein RA, Salem R, Larson AC, Omary RA. Four-dimensional transcatheter intraarterial perfusion MRI monitoring of radiofrequency ablation of rabbit VX2 liver tumors. J Magn Reson Imaging 2011; 34(3): 563-569.
13. Wang D, Gaba RC, Jin B, Lewandowski RJ, Riaz A, Memon K, Ryu RK, Sato KT, Kulik LM, Mulcahy MF, Larson AC, Salem R, Omary RA. Perfusion reduction at transcatheter intraarterial perfusion MR imaging: a promising intraprocedural biomarker to predict transplant-free survival during chemoembolization of hepatocellular carcinoma. Radiology 2014; 272(2): 587-597.
Figures