4140
Optimizing Cartesian compressed sensing for ultra-high resolution Time of Flight angiography1Biomedical Magnetic Resonance, Otto-von-Guericke-University Magdeburg, Magdeburg, Germany, 2German Center for Neurodegenerative Disease, Magdeburg, Germany, 3Center for Behavioral Brain Sciences, Magdeburg, Germany, 4Leibniz Institute for Neurobiology, Magdeburg, Germany
Synopsis
Ultra-high resolution Time of Flight (ToF) angiography requires long scan times. Compressed sensing (CS) can reduce the scan time but requires pseudo-random sampling and may blur image details. We present a framework to create Cartesian pseudo-random sampling patterns from any given probability density function and to evaluate quantitatively vessel depiction with CS reconstruction. Results from 0.30 mm and 0.15 mm isotropic ToF data show that moderate acceleration with CS can reduce the scan time considerably while providing vessel depiction similar to the non-accelerated reference.
Introduction
Prospective motion correction enabled Time of Flight (ToF) angiography at 7T with up to 150 µm isotropic resolution 1. However, scan times of up to 2h prevent routine application. Thus, the potential of compressed sensing (CS) 2 to accelerate ultra-high resolution ToF was evaluated in this study. The main objectives were: 1.) Develop an algorithm, which can create pseudo random Cartesian sampling patterns from any given probability density function (PDF). 2.) Quantify the performance of CS for small vessel depiction with different PDFs and acceleration factors.Methods
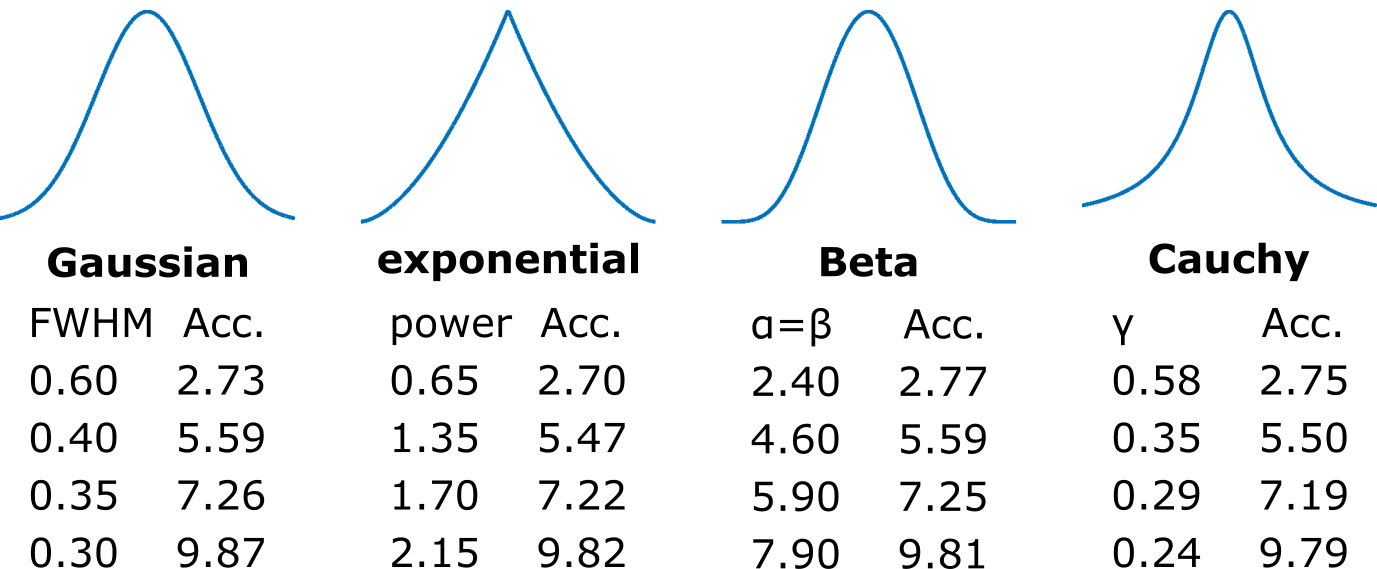
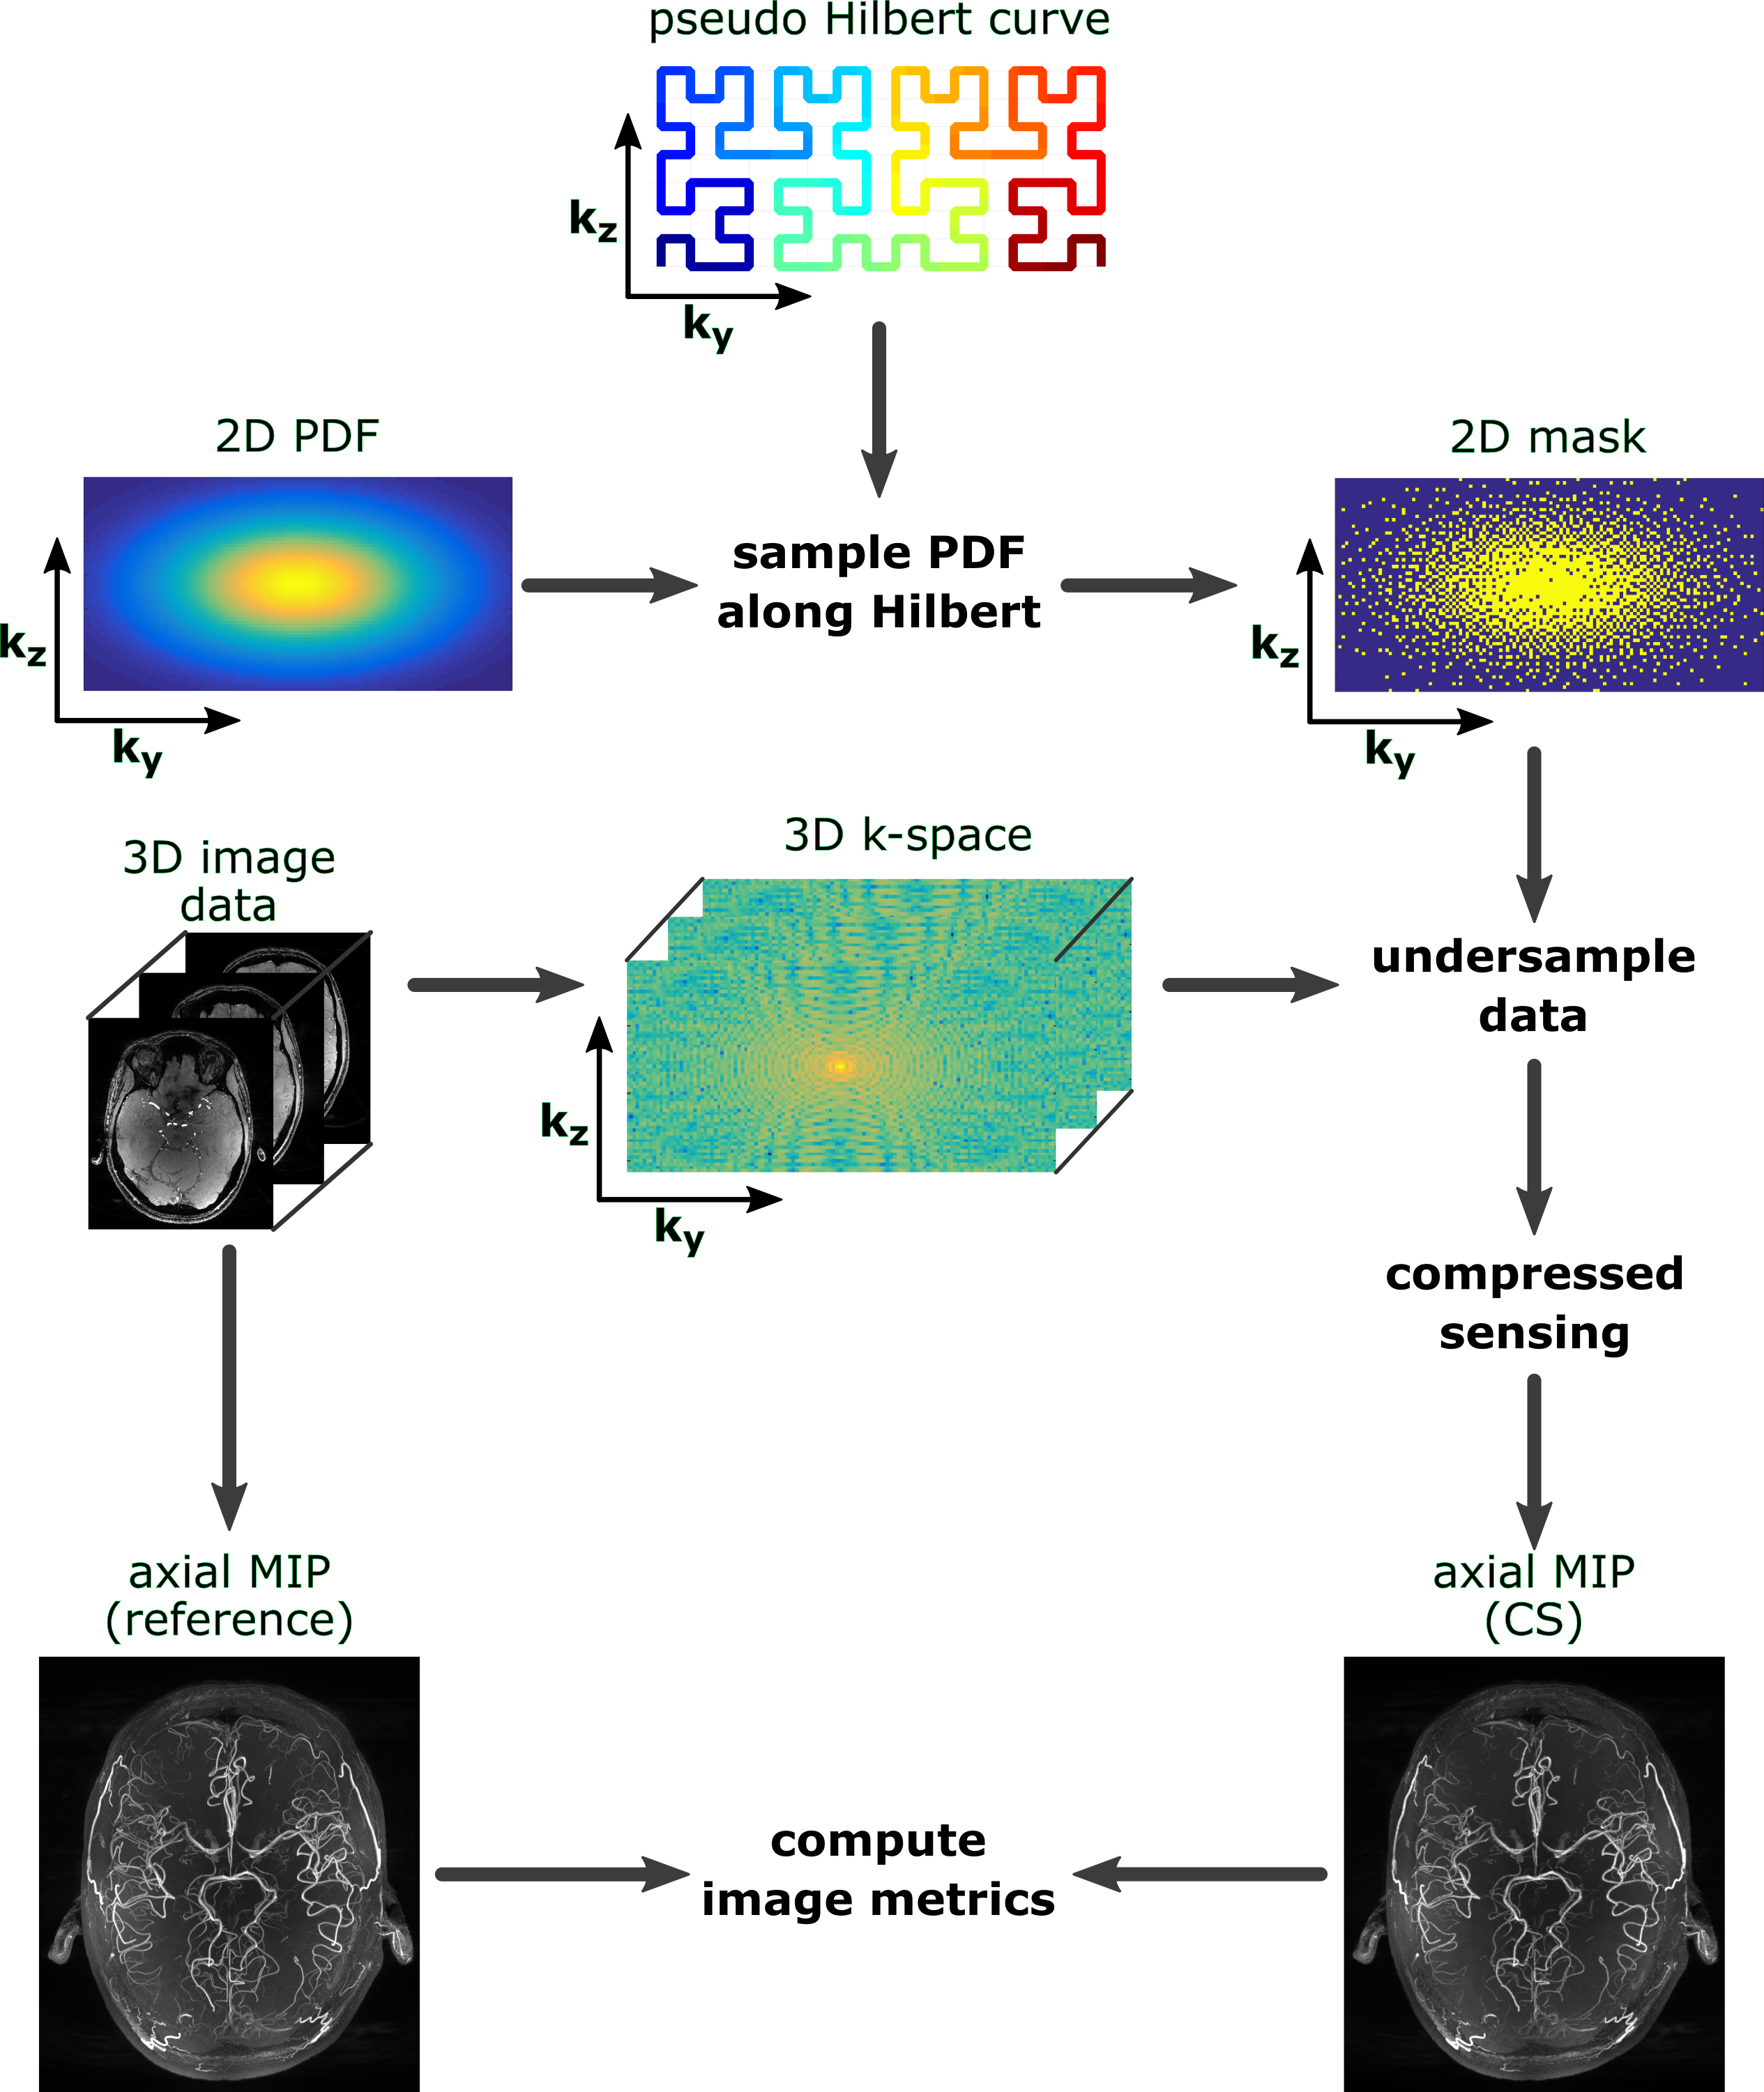
Data from our previous 7T study 1 served as reference from which eight subjects with 0.30 mm isotropic resolution ToF (720x630x195 matrix, GRAPPA 3, 33 minutes) were used. Additionally, the fully sampled highest resolution ToF data to date (single subjects, 0.15 mm isotropic resolution, 1296x972x312 matrix, without acceleration, 2h) were processed. Retrospective undersampling was performed in phase encoding directions ky and kz. To create pseudo random Cartesian undersampling the following PDFs were used: Gaussian, exponential, Beta, and Cauchy. 2D PDFs were created by scaling 1D PDFs to the number of encoding steps in ky and kz, and then convolve both 1D PDFs. To create the undersampling mask a pseudo Hilbert curve was used. 2D masks were sampled from 2D PDFs by summing the PDF values along the Hilbert curve and setting a sampling point each time the PDF sum reached the next integer. By varying the distributions and computing the corresponding mask as described four acceleration factors (2.75, 5.5, 7.25, 9.8) were achieved (see Fig.1). 3D k-space data was created from the ToF scans and then undersampled by the 2D mask in both phase encoding directions. Images were reconstructed from the undersampled k-space with CS (in-house implementation with 3D wavelet transform, db2 wavelets, soft thresholding, lambda=0.01, 20 iterations). From the reference images and the CS output axial maximum intensity projections were computed. Quantitative evaluation of CS was achieved by computing the mean squared error (MSE), structural similarity (SSIM) 3 and averaged edge strength (AES) 4 of the reference and CS MIP. The AES of the CS reconstructed MIP was normalized to the AES of the reference MIP (relative AES). The metrics were computed for whole brain and ROIs manually placed around the Lenticulostriate arteries (LSA). The described processing pipeline is shown in Fig. 2. All processing was performed with MATLAB 2015b.Results
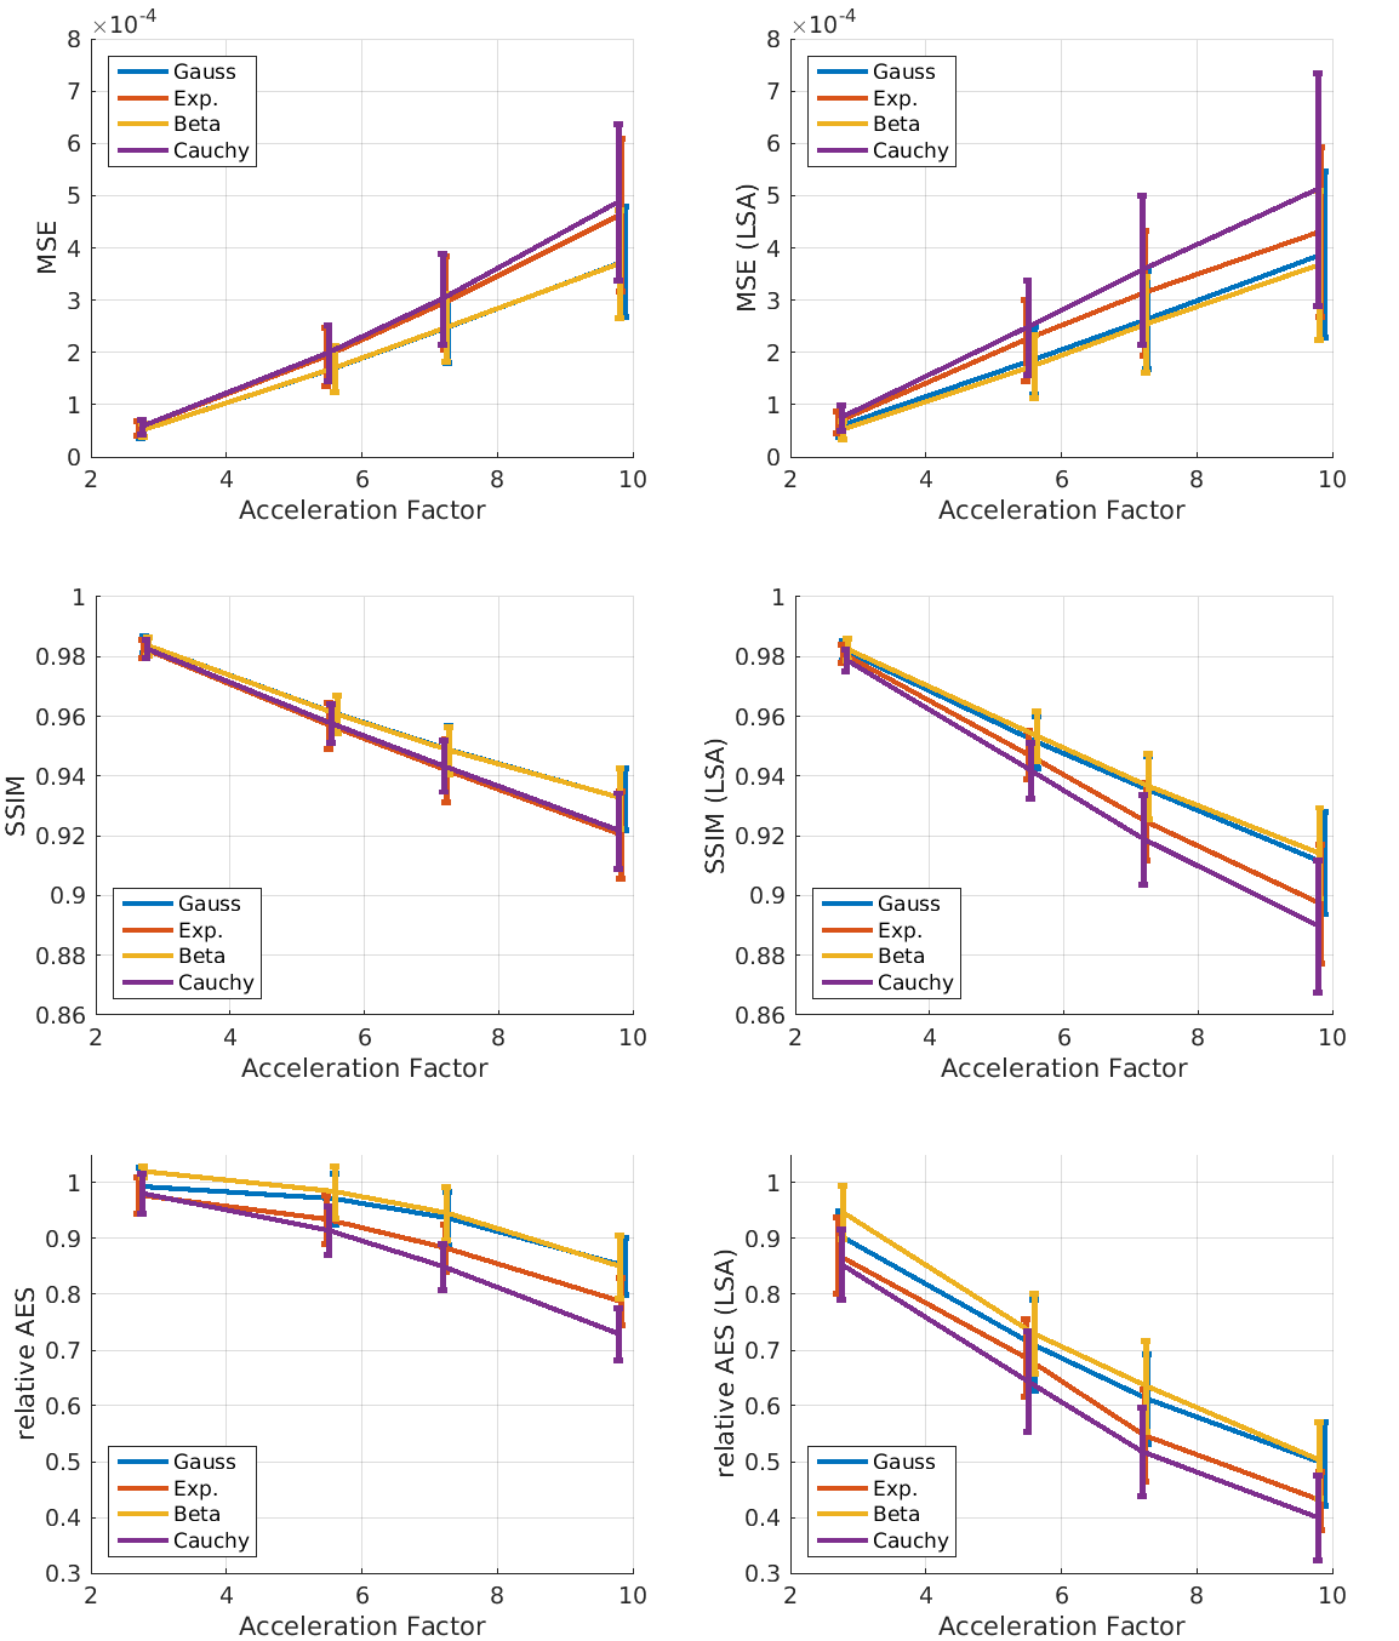
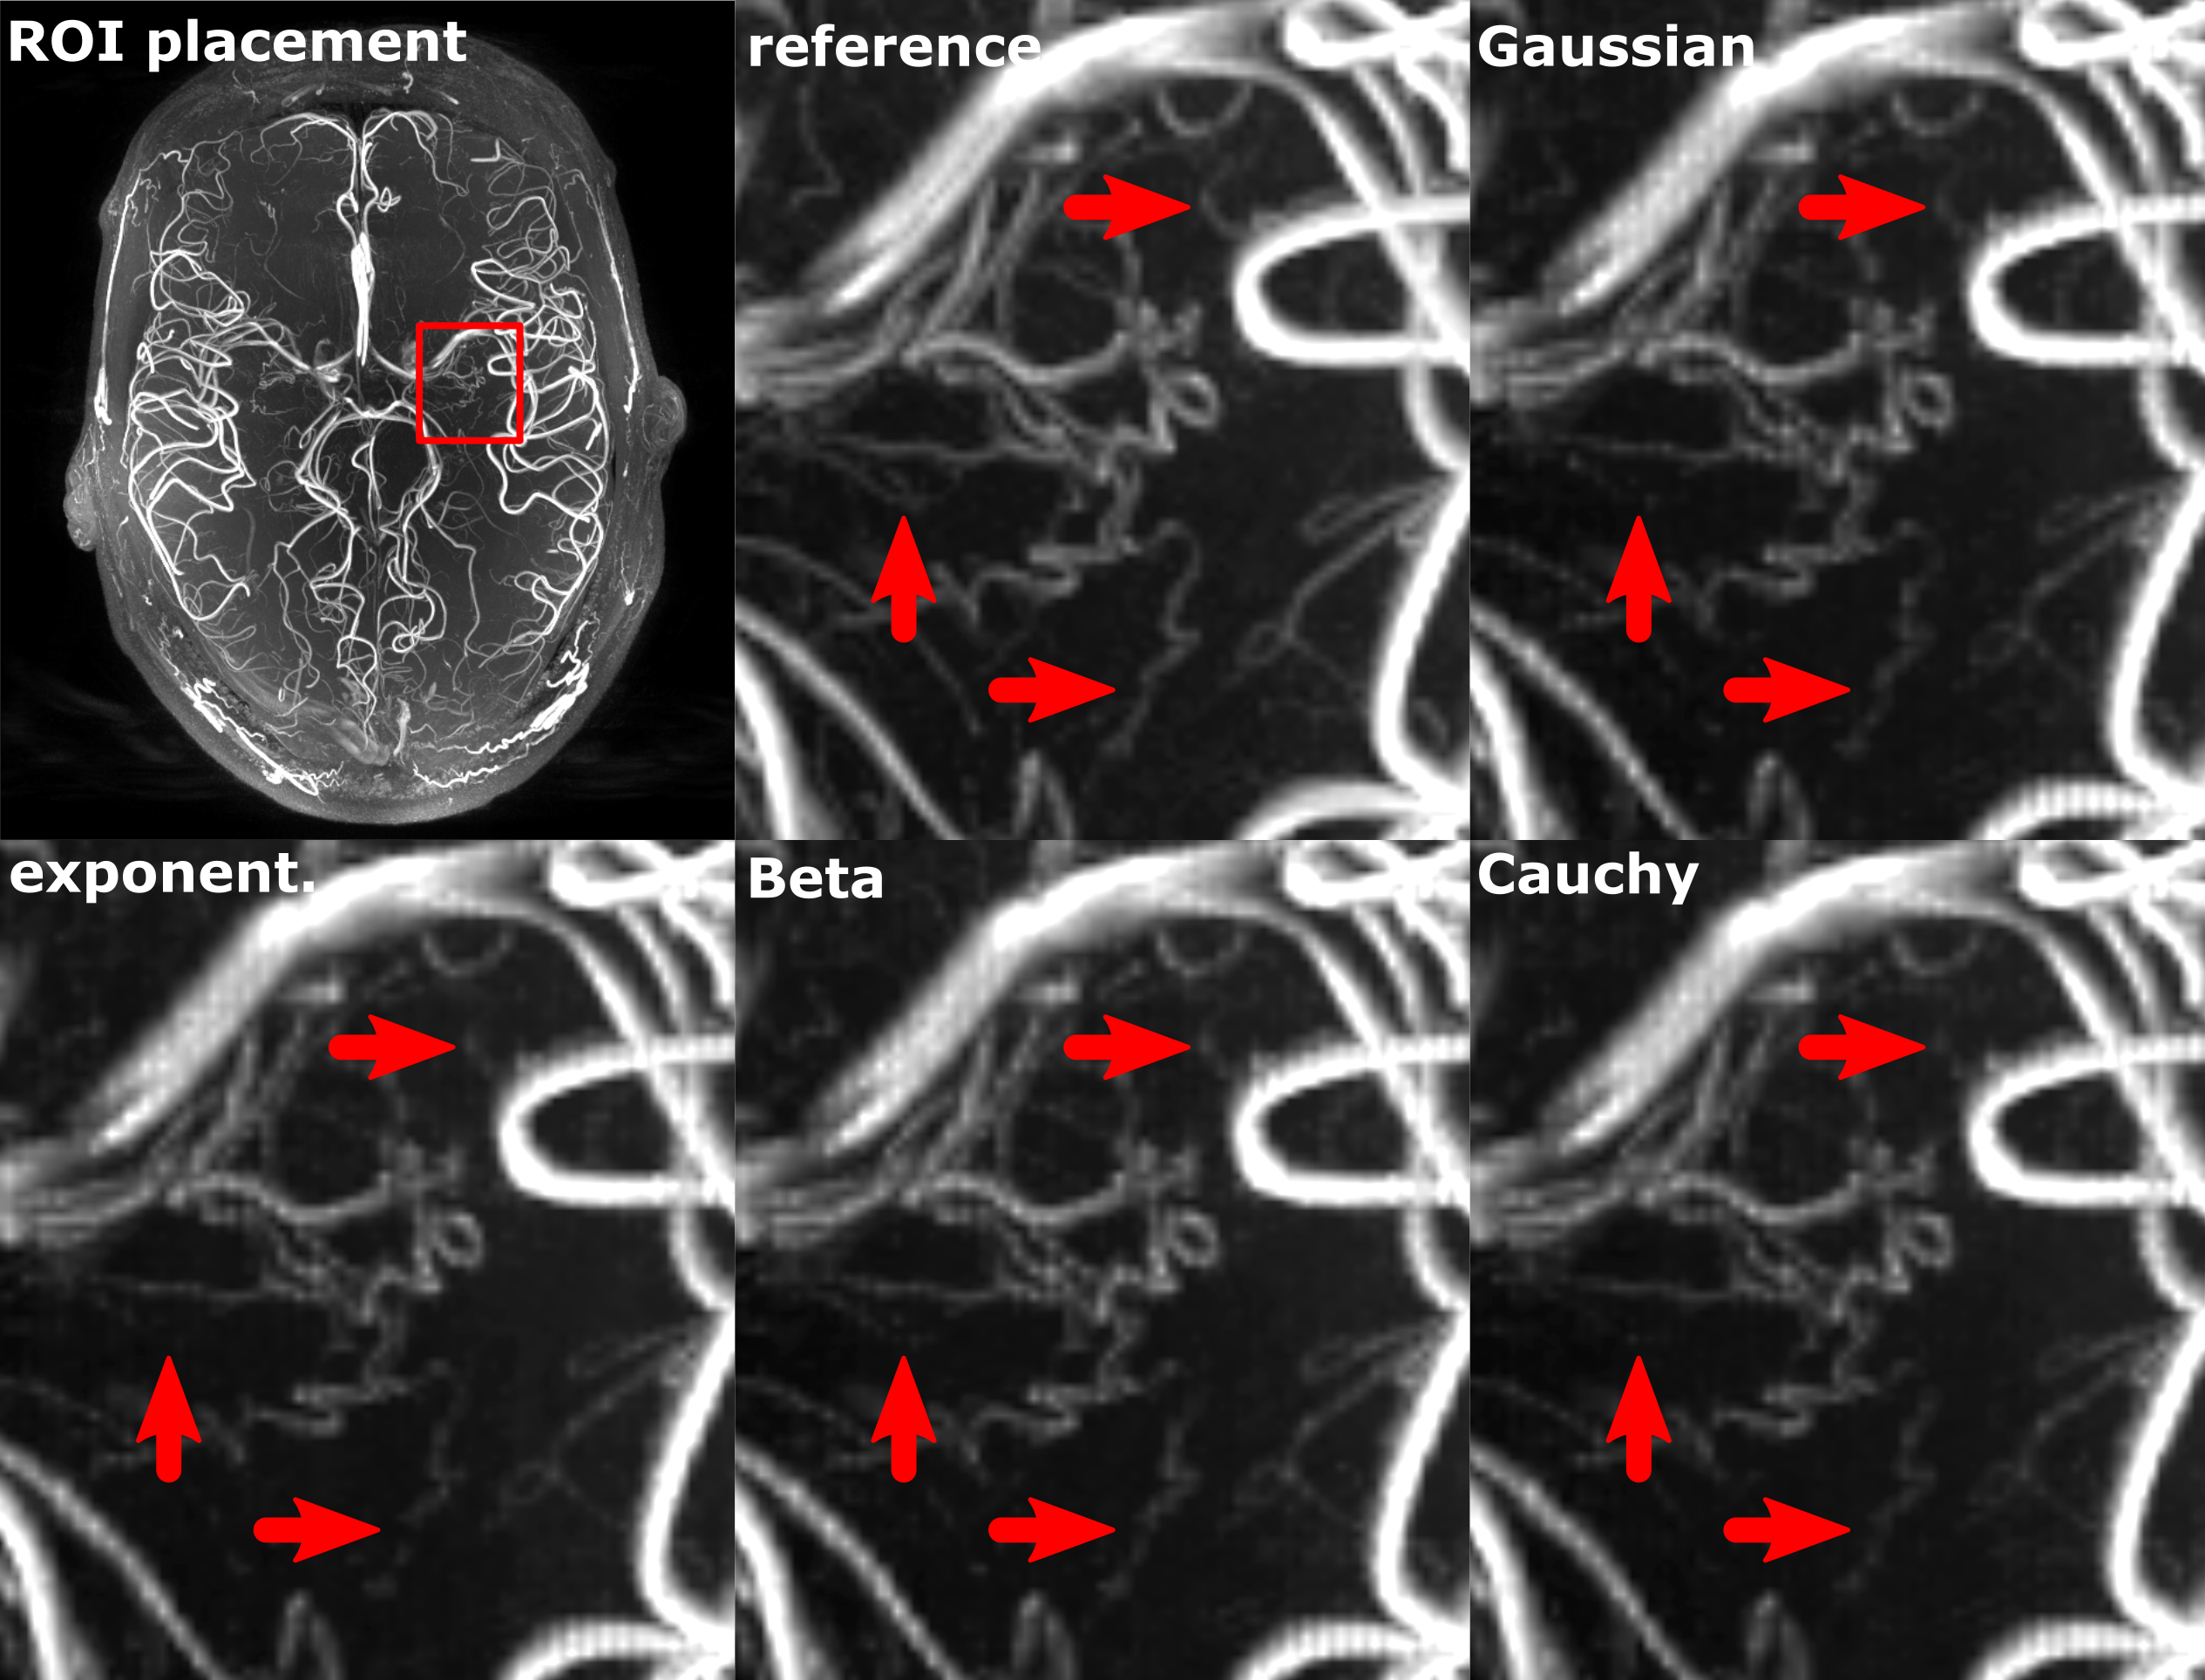
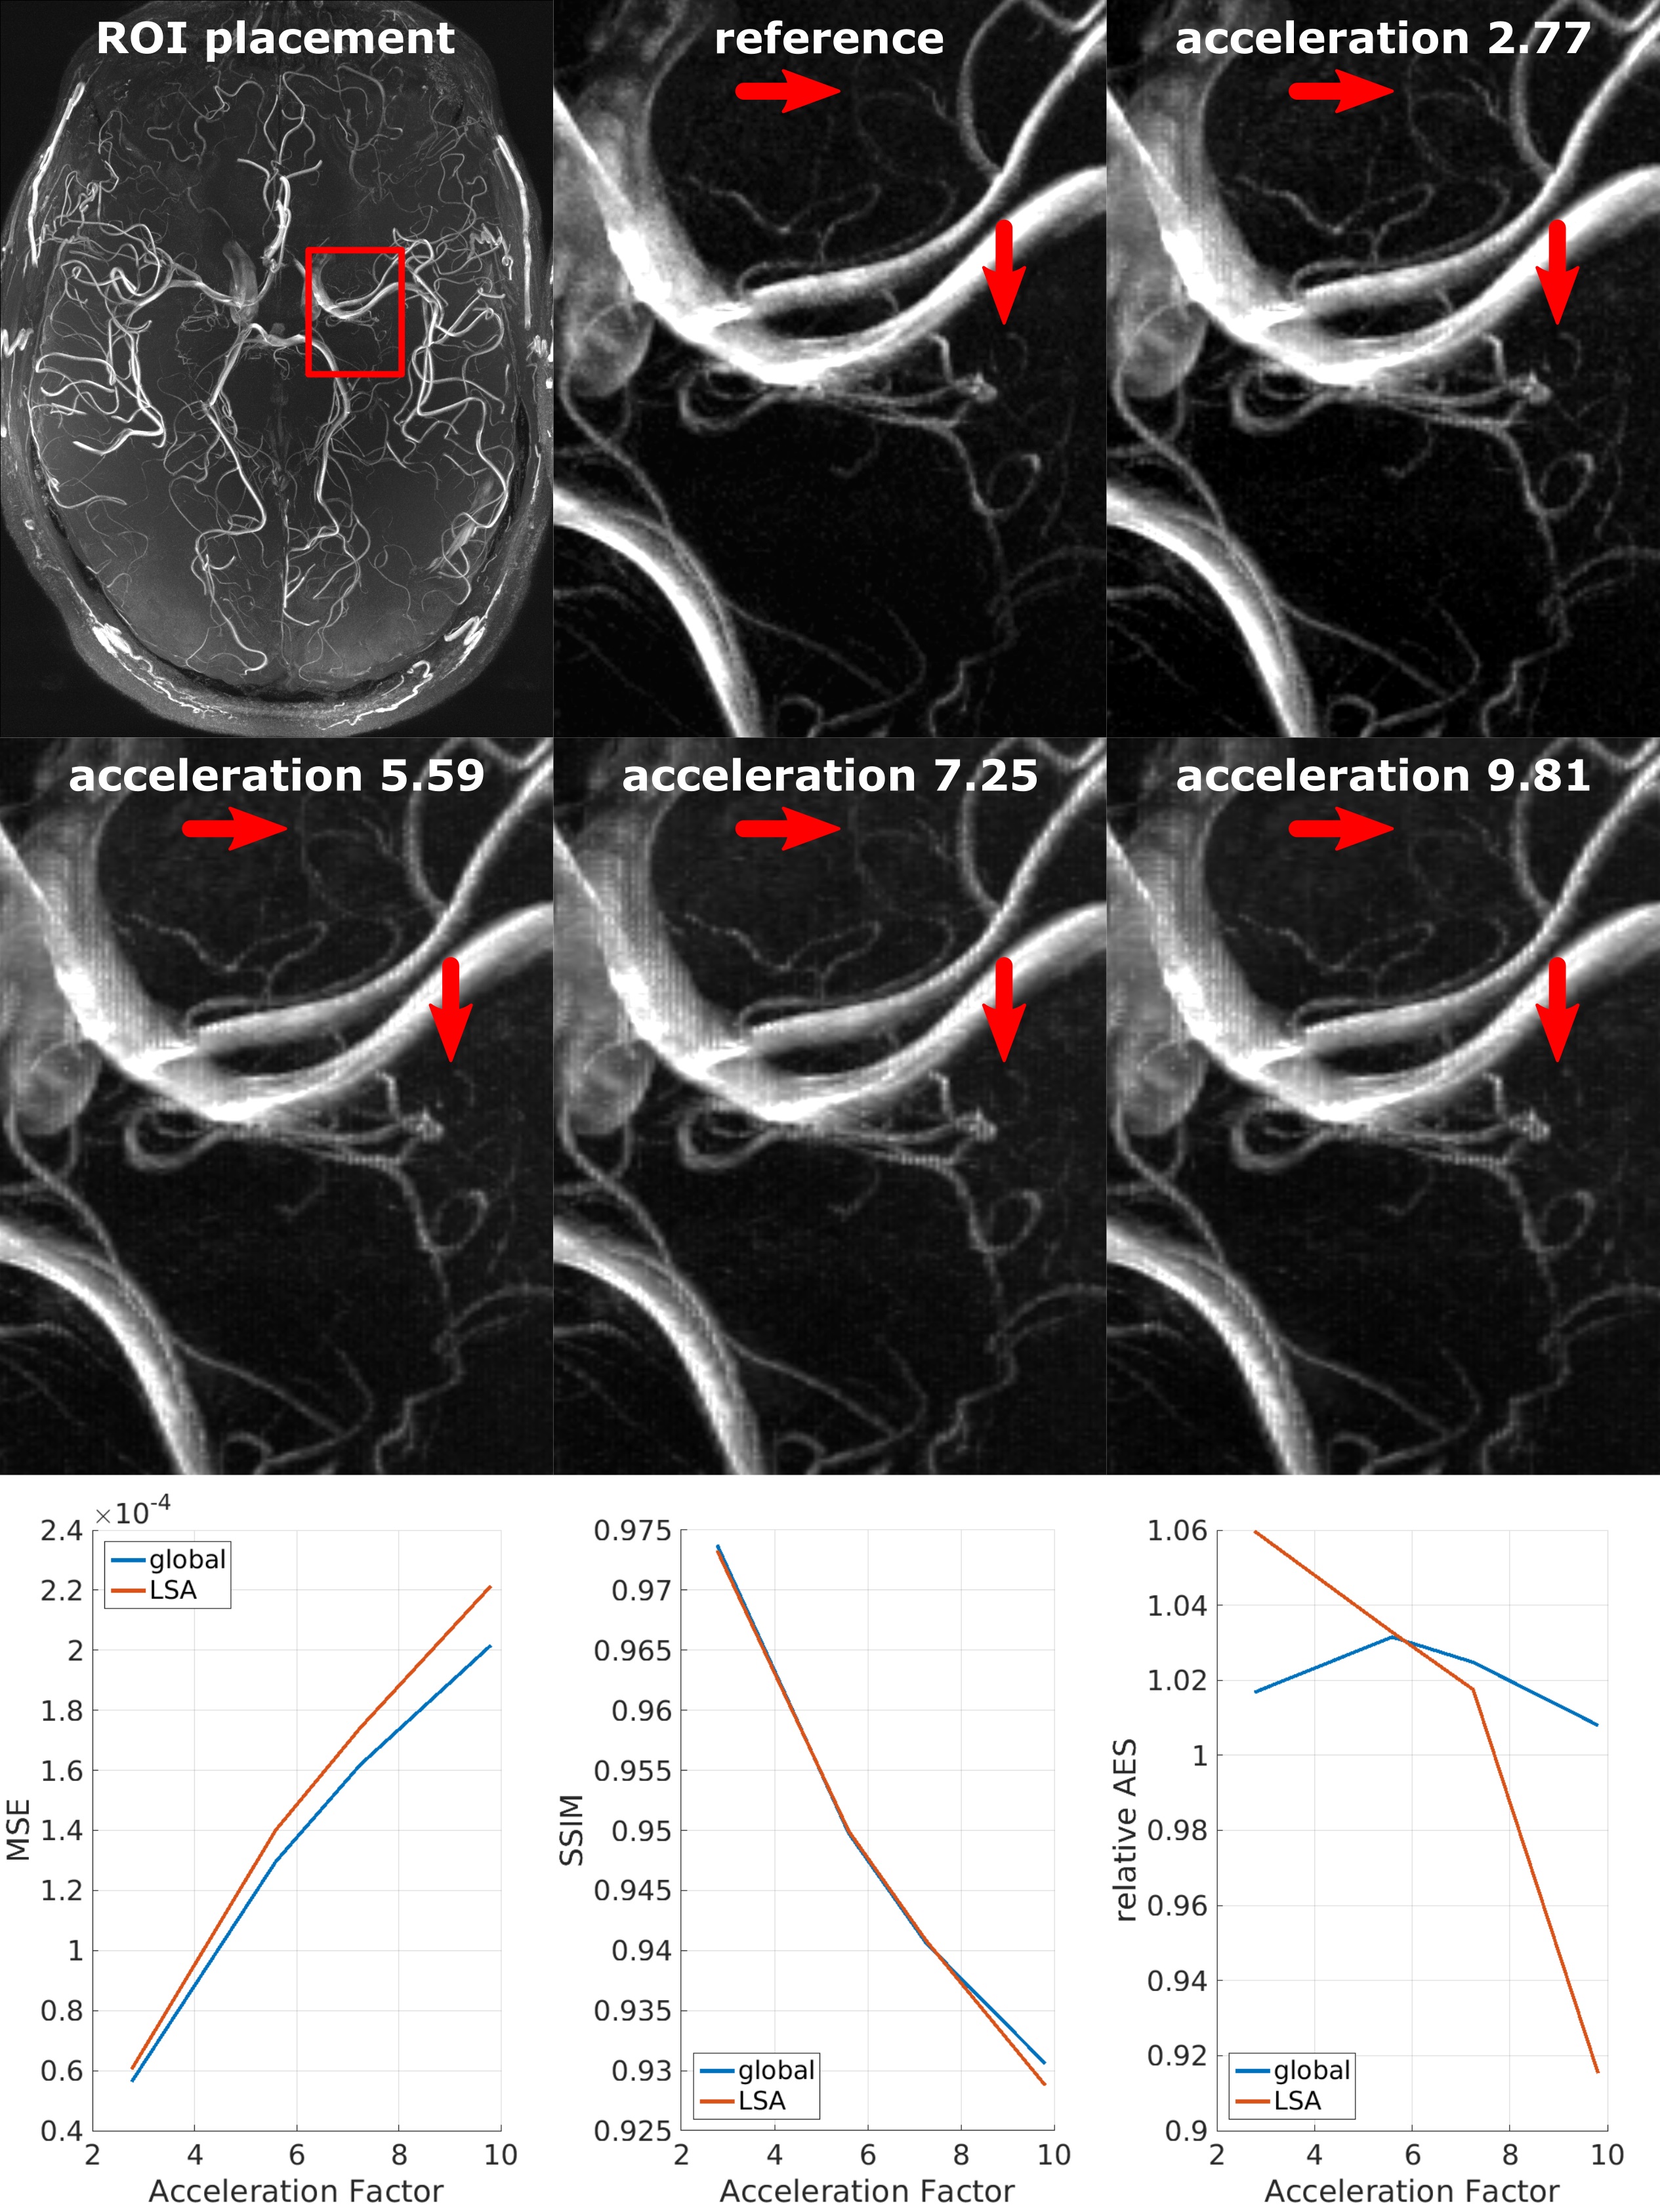
The quantitative results for 0.30 mm ToF data from 8 subjects are shown in Fig. 3. With increasing acceleration the mean MSE increased while the SSIM and relative AES decreased for whole brain and Lenticulostriate arteries (LSA) analysis. The standard deviations for all metrics increased with acceleration factors. Exemplary, for a single subject the CS results from the four different PDFs were compared to the reference. This visual comparison and the quantitative analysis indicate that for a similar acceleration factor the applied undersampling PDF has an effect on the vessel depiction, particularly for small vessels as the LSA. Overall the Beta distribution performed best and was applied to the 0.15 mm ToF data (see Fig. 5). Image metrics changed with increasing acceleration factor in accordance with the 0.30 mm ToF results, except for the global AES which was highest for 5.5 acceleration. Visually, the vessel depiction benefited from moderate acceleration due to image noise reduction by CS.Discussion
CS could considerably accelerate ultra-high resolution ToF imaging. For moderate acceleration CS can decrease the noise level, resulting in higher AES and better vessel visibility compared to the reference image. For a given acceleration factor, vessel depiction benefits from denser sampling of the k-space center (Beta PDF) rather than denser sampling of high frequency components (exponential PDF). Ultimately, CS reconstruction of data with dense sampling of the k-space center but no measured high frequency components can be thought of as a zero-filling technique. Hilbert curve sampling provides a new general framework to create pseudo-random sampling from any Cartesian PDF. In the future, this approach should be tested for other imaging sequences and PDFs, and optimized by analyzing the point spread function of the sampling mask in k-space and wavelet domain. Also, the parameter space for the CS reconstruction is of high dimension and optimizing the CS settings itself remains a task for the future. Finally, incorporating parallel imaging into the presented approach and performing in vivo measurements is necessary.Conclusion
This study presented: 1.) A technique to create pseudo random undersampling patterns from any PDF by using pseudo Hilbert curves. 2.) The first quantitative evaluation of CS reconstruction for ultra-high resolution ToF imaging.Acknowledgements
This work was supported by the NIH, grant number 1R01-DA021146.References
1. Mattern H, Sciarra A, Godenschweger F, Stucht D, Lüsebrink F, and Speck O. Beyond the biological resolution limit: Prospectively motion corrected Time of Flight angiography at 7T. ISMRM 2017.
2. Lustig M, Donoho D, and Pauly JM. Sparse MRI: The application of compressed sensing for rapid MR imaging. Magnetic resonance in medicine. 2007;58(6):1182-1195.
3. Wang Z, Bovik AC, Sheikh HR, and Simoncelli EP. Image quality assessment: from error visibility to structural similarity. IEEE transactions on image processing. 2004:13(4):600-612.
4. Aksoy M, Forman C, Straka M, Çukur T, Hornegger J, Bammer R. Hybrid prospective and retrospective head motion correction to mitigate cross-calibration errors. Magnetic resonance in medicine. 2012;67(5):1237-1251.
Figures