4131
A quadrature filter approach to diffusion weighted imaging with application in pore size estimation1Department of Biomedical Engineering, Linköping University, Linköping, Sweden, 2Random Walk Imaging AB, Lund, Sweden, 3Department of Mathematics, Linköping University, Linköping, Sweden, 4Diagnostic Radiology, Department of Clinical Sciences, Lund University, Lund, Sweden, 5Department of Radiology, Brigham and Women's Hospital, Harvard Medical School, Boston, MA, United States
Synopsis
We present a novel approach to gradient waveform design for diffusion weighted MRI. The approach is founded on the temporal frequency domain formulation of the signal attenuation. The objective is to obtain a set of circularly polarized oscillating gradient waveforms that are optimal in terms of b-value, frequency selectivity and in-plane rotational invariance. A new pore size estimation algorithm is presented. We show phantom and in vivo results based on MRI scans using an opimized waveform set.
Purpose
The aim is to provide a method for accurate in vivo pore size imaging.Theory
The diffusion weighted signal attenuation can be expressed in the frequency domain as [1,2]
$$~~~~~-\log(S/S_0)=\int_{-\infty}^{\infty}~{\bf q}(\omega)^TD(\omega)\, {\bf q}(\omega)\;d\omega \ ,\qquad\qquad\qquad (1)$$
where
$$~~~~~{\bf q}(\omega)=\int_0^\infty \left[ ~\int_0^t\gamma~{\bf g}(\tau)\;d\tau~\right]e^{\,i\,\omega\,t}\:dt~~ \, . $$
We are aiming for a set of circularly polarized oscillating gradient sequences [3-5]. More precisely, letting $$${\bf \hat{\, n}}$$$ be a normalized vector perpendicular to the encoding plane, we want the following to be true:
$${\rm 1)}~~{\bf q}(\omega)^T{\bf\hat{\, n}}=0~~~{\rm and}~~~{\rm 2)}~~\|{\bf q}(\omega)^T{\bf\hat{\, n}_{\perp}}\|^2=c(\omega)~~~~{\rm for~all}~~\omega~{\rm and}~~{\bf\hat{\, n}}_{\perp};~~{\bf\hat{\, n}}^T_{\perp}{\bf\hat{\, n}}=0$$
The first requirement is readily met by keeping the $$${\bf g}$$$ trajectory lie on the transverse plane. The second requirement implies that the diffusion encoding energy spectrum is rotation invariant in that plane. To see the implications, we will study the case where diffusion occurs only in one orientation, i.e., where
$$D(\omega)={\bf d}(\omega){\bf d}(\omega)^T$$
Bearing in mind that $$${\bf d}$$$ is real due to symmetry, the signal attenuation for this case is given by
$$-\log(S/S_0)=\int_{-\infty}^{\infty}~\|{\bf d}(\omega)^T{\bf q}(\omega)\|^2\;d\omega=\int_{-\infty}^{\infty}~\|{\bf d}(\omega)^T{\bf q}_{_R}(\omega)+i{\bf d}(\omega)^T{\bf q}_{_I}(\omega)\|^2\;d\omega$$
where $$${\bf q}_{_R}$$$ and $$${\bf q}_{_I}$$$ are real valued. It can be shown that in order for this expression to be invariant to the orientation of $$${\bf d}$$$, the following conditions must be met:
$${\bf q}_{_R}(\omega)^T{\bf q}_{_I}(\omega) = 0 ~~~~~{\rm and}~~~~~~\|{\bf q}_{_R}(\omega)\| = \|{\bf q}_{_I}(\omega)\|~~~~~{\rm for~ all}~ \omega$$
Interestingly, it turns out that these conditions can be met by a quadrature filter [6]. Letting the real part of a quadrature filter define the gradient waveform in one direction and the imaginary part the gradient in the perpendicular direction will yield a rotation invariant waveform. To proceed, we define $$${\bf q}(\omega)=\sqrt{b}\;{\bf \hat{\, q}}_k(\omega)$$$ such that $$$b$$$ corresponds to the traditional waveform b-value. We also introduce an index $$$k$$$ to denote the $$$k$$$th waveform in a set of waveforms. Equation (1) can then be written as
$$-\log(S_k/S_0)=\,b_k\!\int_{-\infty}^{\infty}~{\bf \hat{\, q}}_k(\omega)^TD(\omega)\, {\bf \hat{\, q}}_k(\omega)\;d\omega=b_k<\widehat{Q}_k\,,\,D>$$
where $$$<\widehat{Q}_k\,,\,D>$$$ is simply shorthand for the integral expression. Finally, by forming the ratio $$$\rho$$$ of $$$\log(S/S_0)$$$ for two different sequences, $$$k$$$ and $$$l$$$ and letting all $$$b_k$$$ in the set be equal, we obtain
$$\rho_{k,l}=\frac{b_k<\widehat{Q}_k\,,\,D>}{b_l<\widehat{Q}_l\,,\,D>}=\frac{<\widehat{Q}_k\,,\,D>}{<\widehat{Q}_l\,,\,D>}$$
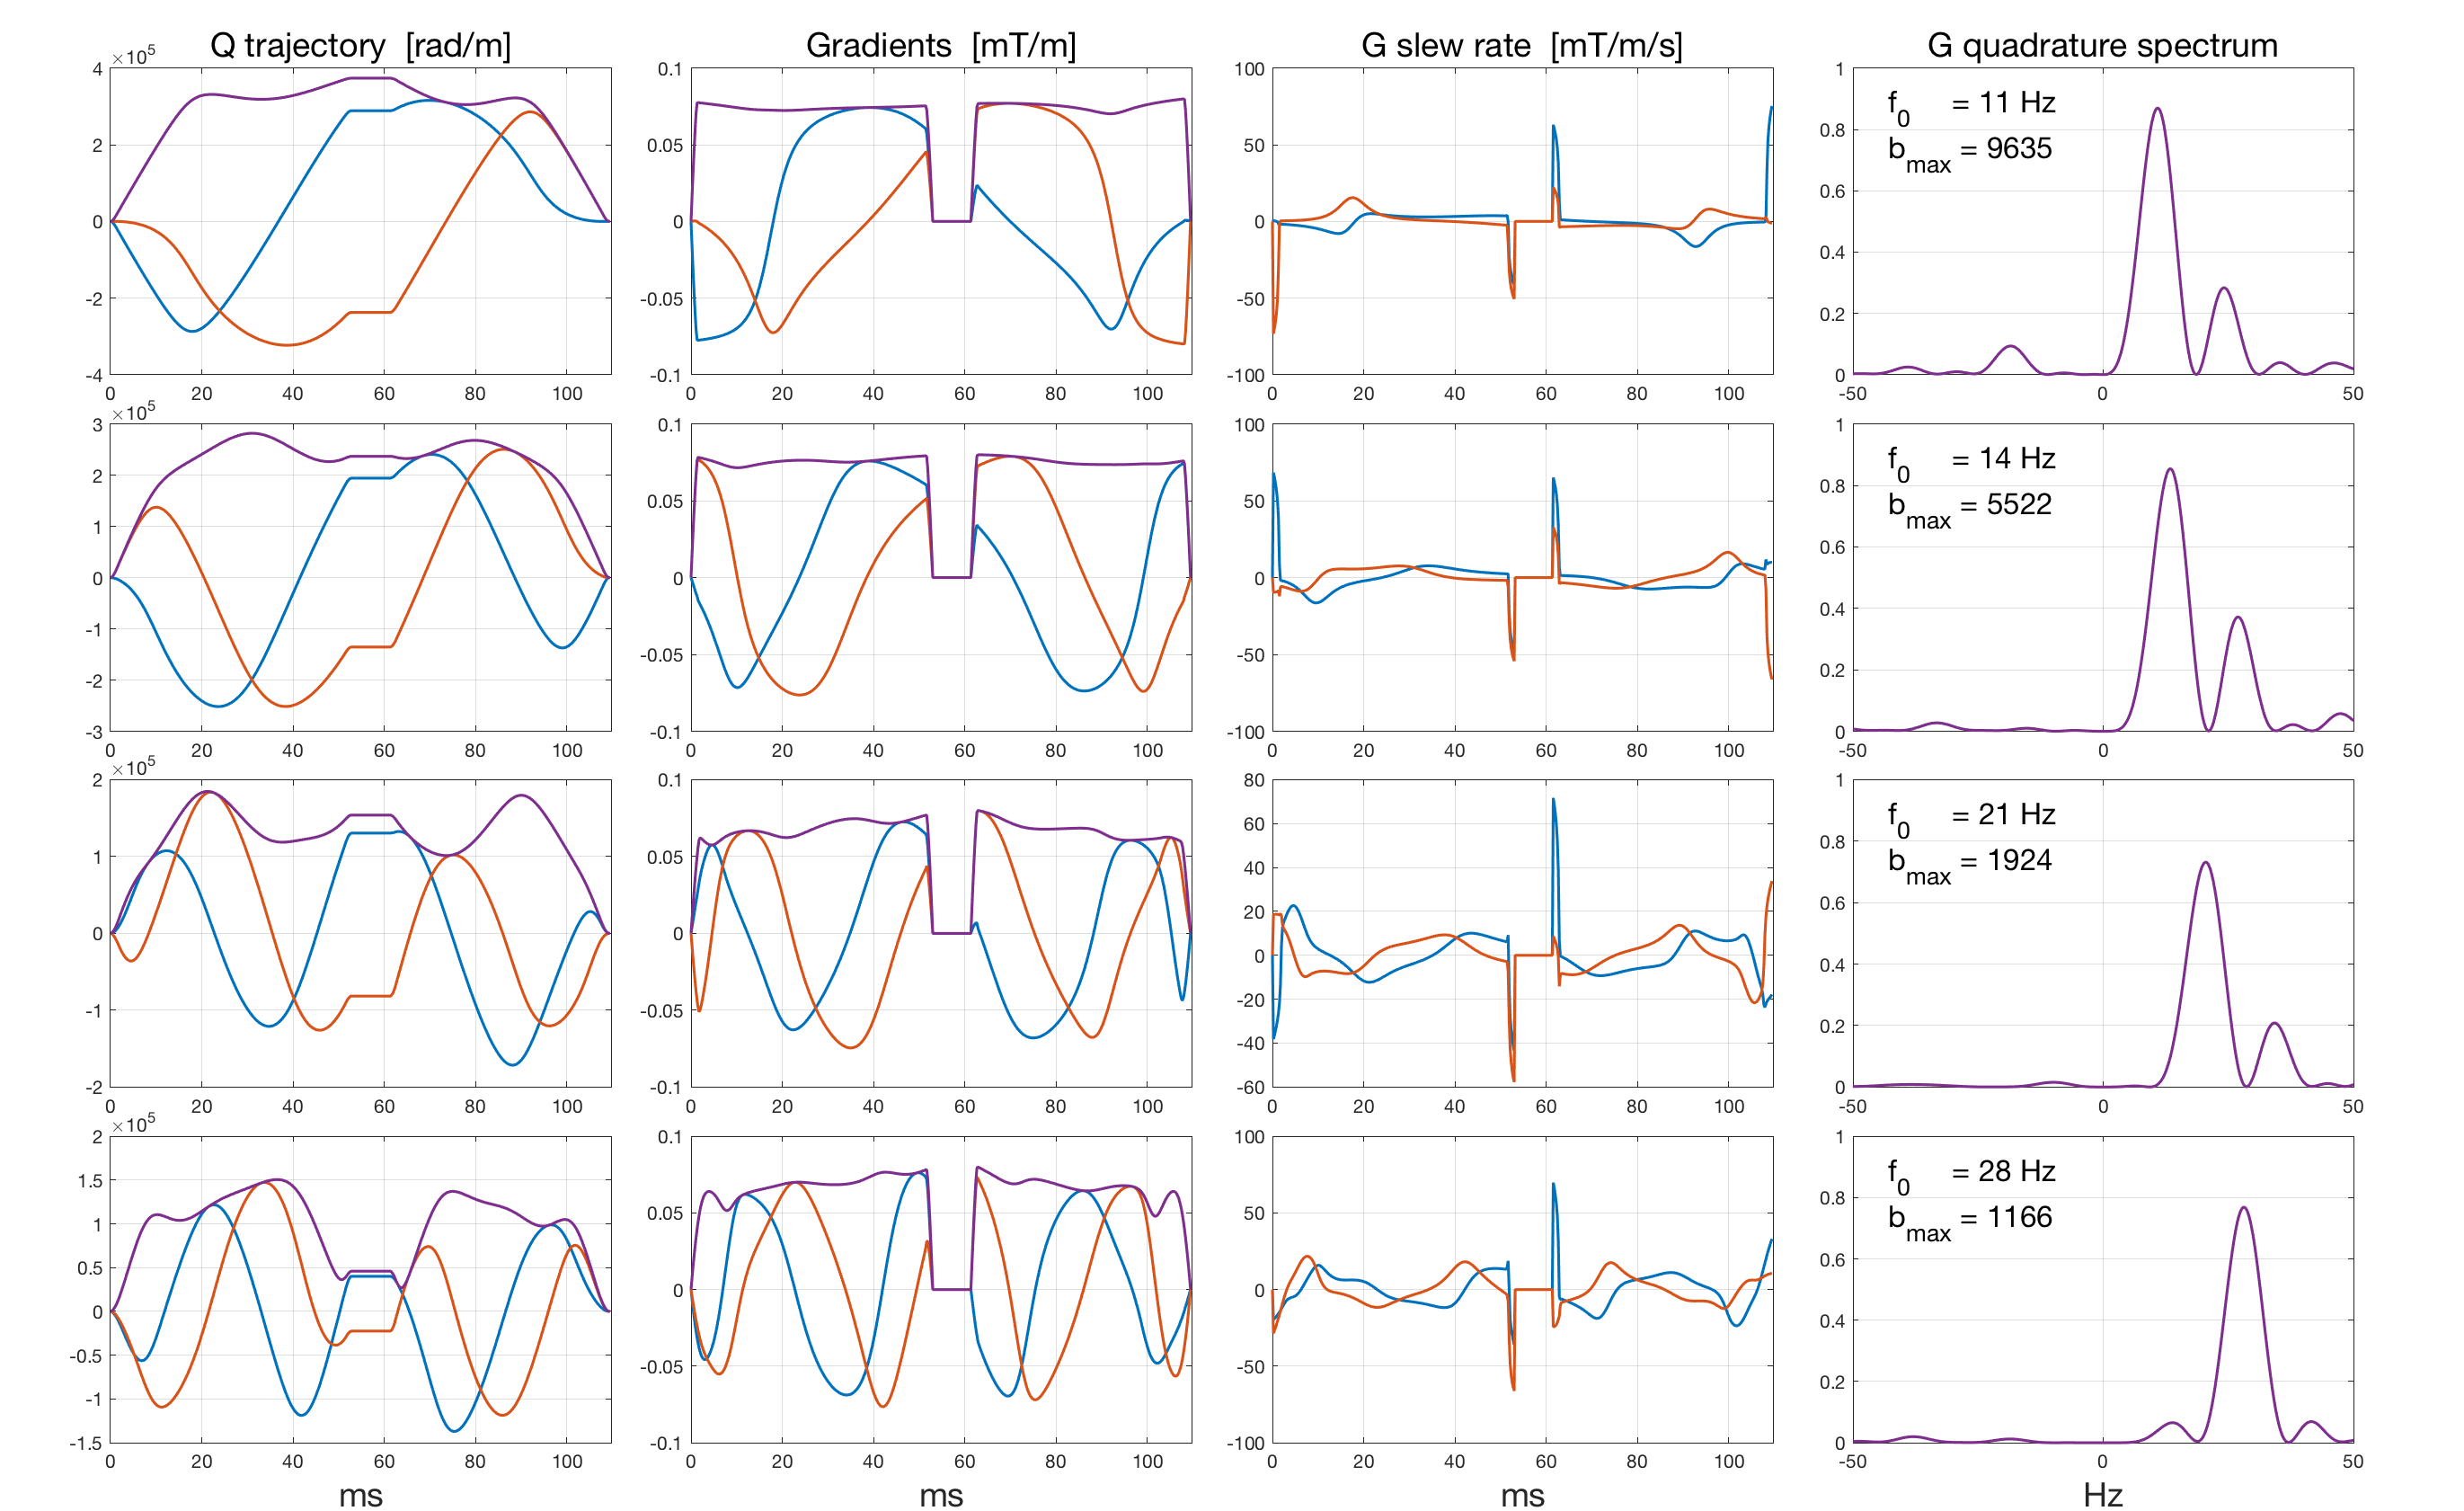
For a given $$$D$$$, this measure is only a function of the normalized spectra of the waveforms involved and will be the same for any $$$b_k=b_l$$$ used. In order to probe tissue comparment sizes, we designed a set of quadrature waveforms sensitive to different temporal frequencies. See figure 3 for the behaviour of the set of optimized waveforms used for the dMRI scans.
Methods
Finding optimal sequences can be formulated as a filter optimization problem. Filter optimization has a long history in the signal processing community [6]. We have used a specifically tailored version of iterated weighted least squares solution. In each iteration, we compute:
$${\bf g}_{n+1} = \left[{\bf F}\,{\bf W}_{\!F}\,{\bf F}+{\bf W}_{\!n}\right]^{-1}{\bf F}\,{\bf W}_{\!F}\,{\bf G}_0~~~~~~{\rm and}~~~~~~{\bf W}_{\!n+1}=h({\bf g}_{n})$$
Here $$${\bf F}$$$ is a Fourier transform matrix, $$${\bf W}_{\!F}$$$ corresponds to a Fourier domain weighting function,$$${\bf W}_{\!n}$$$ corresponds to a time domain weighting function and $$${\bf G}_0$$$ is a Fourier domain reference filter function. The purpose of $$$h$$$ is to produce a time domain weighting function that will gradually compress the amplitude of $$${\bf g}$$$. The final sequence will yield as high b-value as possible while still preserving the main characteristics of the specified frequency response, see figure 1.
Results
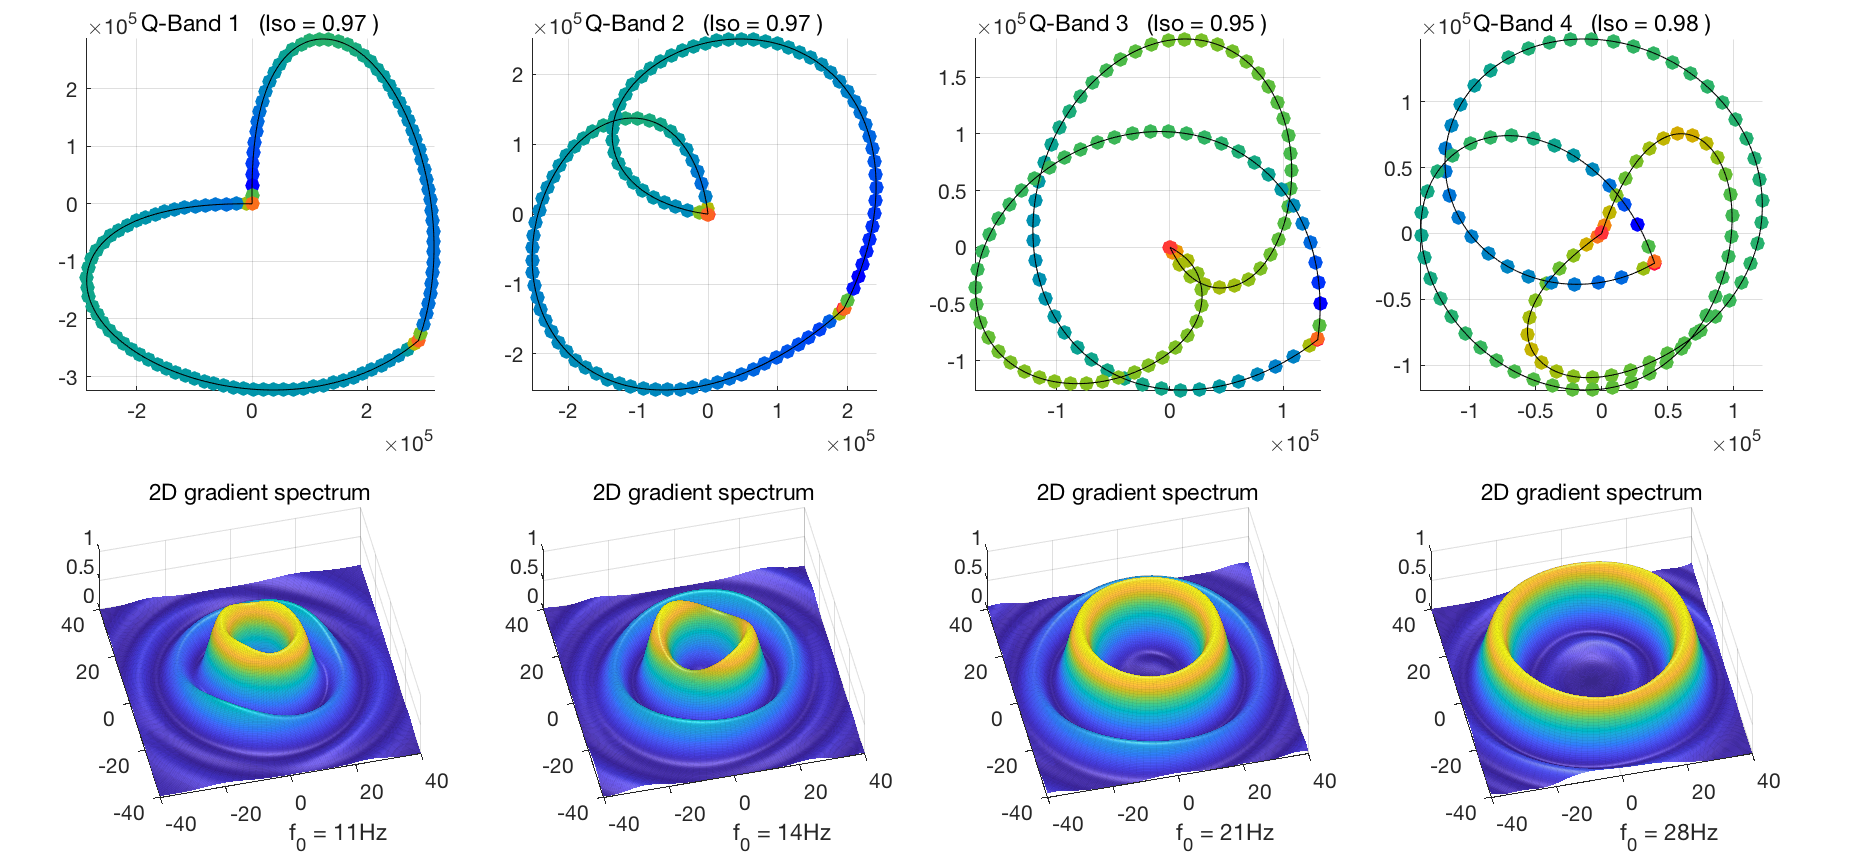
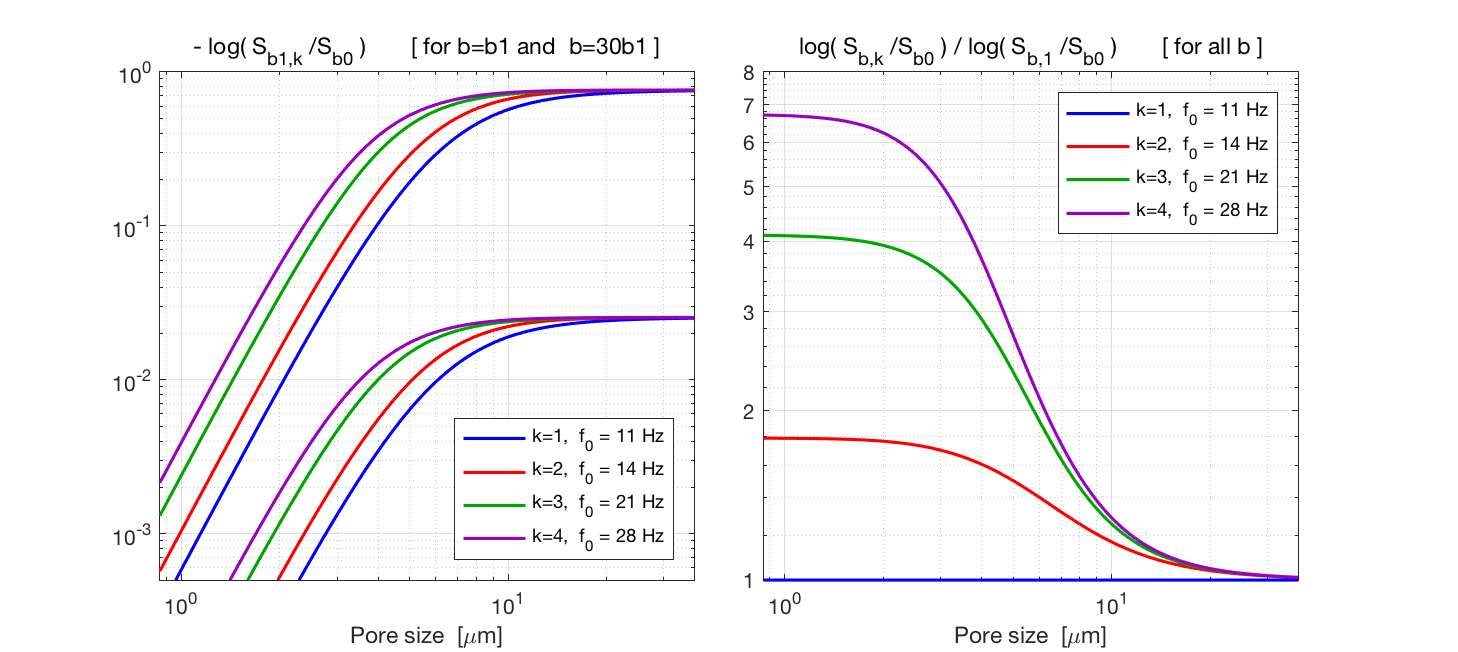
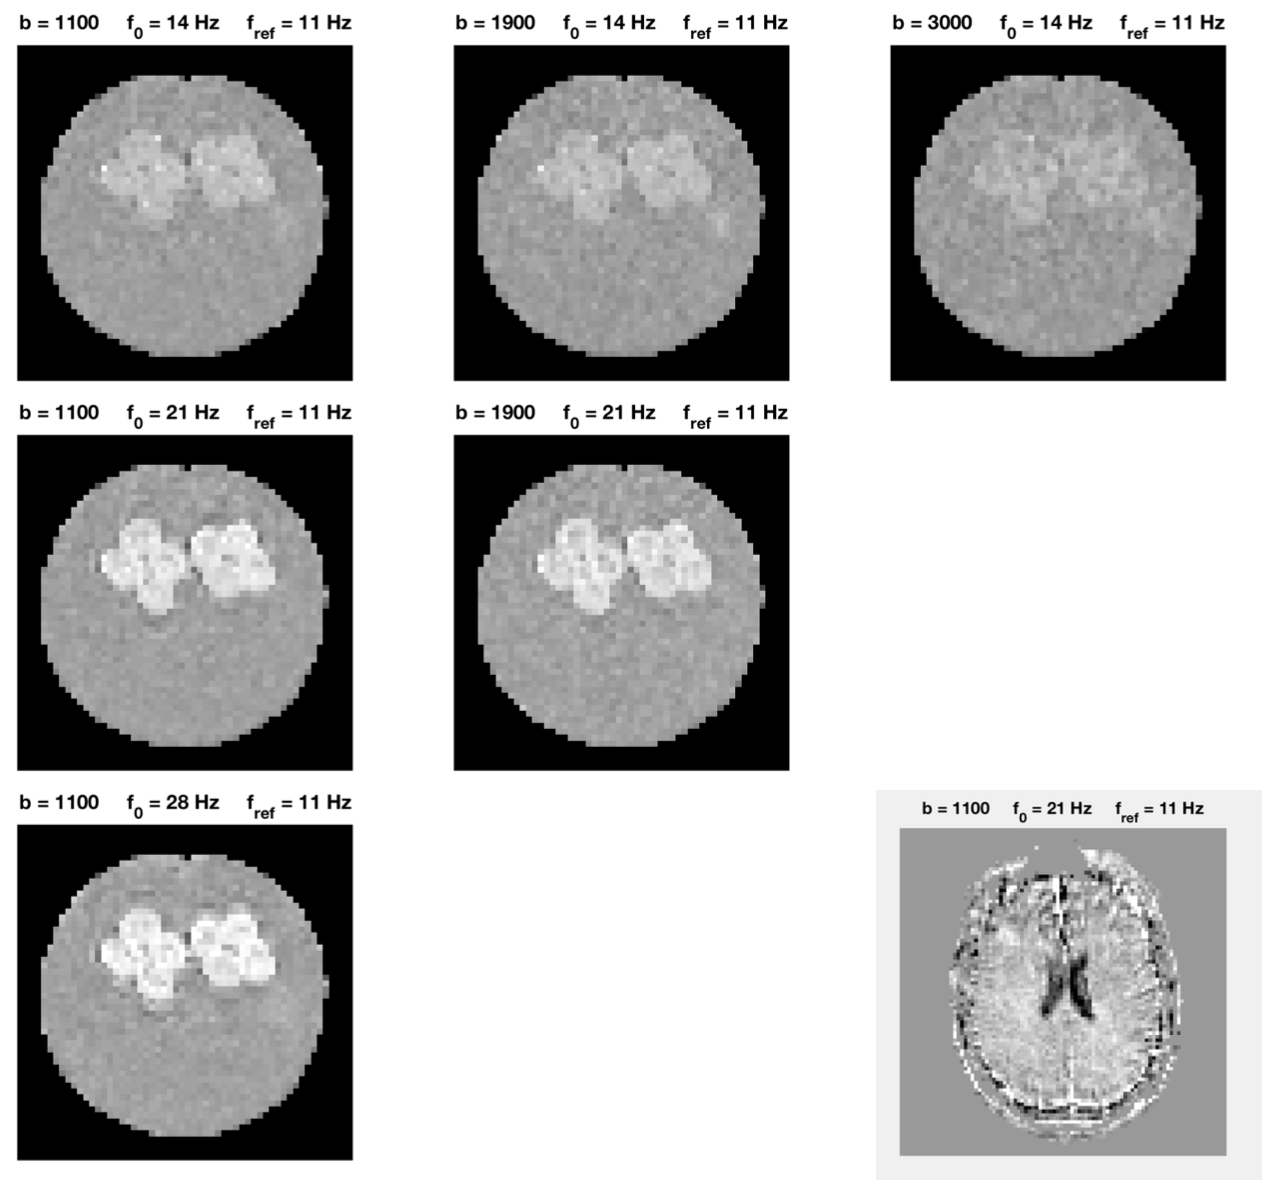
Imaging was performed on a 3T MAGNETOM Prisma with a 20-channel head coil array (Siemens Healthcare, GmbH, Erlangen, Germany) with a prototype spin-echo sequence that enables arbitrary gradient waveforms. Figure 1 shows plots of the on-axis projections of Q, G and Slew-rate trajectories with the corresponding spectra for four different optimized band-pass quadrature filter sequences. Figure 2 shows plots of the two-dimensional Q-trajectories with the corresponding two-dimensional spectra for four different optimized band-pass quadrature filter sequences. Figure 3 includes plots demonstrating the dependence on pore size for signal attenuation (left) and ratios of $$$\log(S_k/S_0)$$$ for different frequency bands. Figure 4 shows images obtained as ratios of measurements using the three highest frequency bands and the lowest frequency band.Discussion and conclusions
In conclusion, we have presented a novel approach to gradient waveform design for diffusion weighted MRI. The approach is founded on the temporal frequency domain formulation of the signal attenuation. The objective is to obtain a set of circularly polarized oscillating gradient waveforms that are optimal in terms of b-value, pore size selectivity and in-plane rotational invariance. We have demonstrated that the gradient waveforms generated from using our joint temporal and frequency domain based adaptive iterated filter optimization algorithm works well for pore size estimation on a clinical scanner.Acknowledgements
This research was supported by: The Swedish Research Council VR2015-05356 and VR2016-04482, Swedish Foundation for Strategic Research AM13-0090, Linköping University, the Swedish Research Council CADICS Linneaus research environment, The Knut and Alice Wallenberg Foundation "Seeing Organ Function", ITEA3/Vinnova "BENEFIT", Linköping University Center for Industrial Information Technology (CENIIT), and U.S. National Institutes of Health P41EB015902, R01MH074794, P41EB015898.
References
1. Stepisnik J. Analysis of NMR self-diffusion measurements by a density matrix calculation. Physica. 1981;104B:350-364.
2. Gore JC, Xu J, Colvin DC, et al. Characterization of tissue structure at varying length scales using temporal diffusion spectroscopy. NMR Biomed. 2010;23:745-756.
3. Westin CF, Nilsson M, Szczepankiewicz F, et al. Circular diffusion encoding. ISMRM Diffusion Workshop, Podstrana, Croatia, 2013.
4. Özarslan E, Avram AV, Basser PJ, et al. Rotating field gradient (RFG) MR for direct measurement of the diffusion orientation distribution function (dODF). Proc Intl Soc Mag Reson Med. 2014;22:0796.
5. Lundell H, Sonderby CK, Dyrby TB. Diffusion weighted imaging with circularly polarized oscillating gradients. Magn Reson Med. 2015;73(3):1171-1176.
6. Knutsson H, Andersson M, Wiklund J. Advanced filter design. SCIA. 1999.
7. Lätt J, Nilsson M, Rydhög A, et al. Effects of restricted diffusion in a biological phantom: a q-space diffusion MRI study of asparagus stems at a 3T clinical scanner. Magn Reson Mater Phy. 2007;20(4):213–222.
Figures