4113
Motion Correction based on Z-spectral Consistency for APTw/CESTw MRI Applications in Body Oncology1Philips Research, Hamburg, Germany, 2Philips MRI, Best, Netherlands
Synopsis
CESTw imaging in body areas with significant physiological motion is strongly hampered because of the inherent motion sensitivity of this MRI technique. In particular, slow physiological motion in the abdomen, e.g. peristaltic motion or bladder filling may lead to Z-spectral inconsistency and artifacts in CESTw images. Here, a method is introduced which analyzes Z-spectral consistency to mask CESTw image areas affected by motion. The technique is successfully demonstrated on a volunteer example in liver CESTw MRI, indicating a future application in body oncology.
Introduction
Chemical Exchange Saturation Transfer weighted (CESTw) MRI and specifically Amide Proton Transfer weighted (APTw) MRI1 has gained a lot of attention for applications like tumor grading in oncology. CESTw imaging in body areas with significant physiological motion is strongly hampered because of the inherent motion sensitivity of this MRI technique. Motion artifacts in APTw/CESTw MRI can manifest themselves in multiple different ways. For signal encoding, spatial and Z-spectral dimensions, relating to the RF saturation frequency offset, are sampled. This typically require scan times in the order of 3-5 minutes at least. As a reference, this acquisition time is e.g. achievable when using RF saturation of 2 seconds, 10 slices, spatial matrix 1282, 7 different Z-spectral points for B0-field correction and normalization (S0) and including parallel imaging acceleration (acceleration factor 2) with 3D fast spin-echo technique. There are plenty of physiological motion effects happening in body imaging over this time period. Individual volumes recorded for one Z-spectral point may be motion corrupted (fast motion/pulsation/short term involuntary motion), which is common for all MRI scanning. For CESTw imaging in particular, motion between different Z-spectral points may lead to artifacts, because the processing implies subtraction and division of different Z-spectral data. On the relevant time scales (e.g 1 minute per Z-spectral volume in 3D imaging), slow relocations, position drifts ("body sinking into cushion") may play a role. In particular, slow physiological motion in the abdomen, e.g. peristaltic motion or bladder filling may lead to Z-spectral inconsistency and artifacts in CESTw images. These typically lead to translational motion but also to elastic deformation of organs. Here, a method is introduced which analyzes Z-spectral consistency to mask CESTw image areas affected by motion.
Methods
We propose to use Z-spectral features for a consistency check in order to mask CESTw images in case of signal corruption by physiological motion. The Z-spectrum S[ω], if not corrupted, should basically always shows increasing image intensity with increasing offset. Also, the shape of the Z-spectrum, specific for an imaging parameter choice and a nominal tissue type will be similar. Thus, actual relative Z-spectral intensities at different saturation frequency offsets ω may be compared with the expectation. Here, we compare intensities at two selected Z-spectral offset frequencies ω1 and ω2 and reject voxels, which do not fulfill the criteria α < S[ω1]/S[ω2] < β, as illustrated in Figure 1. A 3T MRI system (Achieva TX, Philips, NL), equipped with 32 element Torso-Cardiac coil reception, a respiratory belt for triggering, and 2-channel parallel transmission was used. RF saturation at 100% duty cycle was applied using transmission channel alternation. Further parameters: FOV 220×500mm2; in-plane resolution 1.8mm; coronal slices 6 mm; reconstruction 0.86 mm; 2D fast spin-echo with driven equilibrium refocusing; 4 segments with shot duration of 440ms; low high k-space order; Δω=+3.5ppm (APTw); trigger delay 810ms; extra delay after the acquisition window 1.6s; 19 Z-spectral points; stepsize 0.4ppm; scan duration 71/2 min; TR/TE=5700/6.2ms; scan time per Z-spectral point 23s; pixel bandwidth 290Hz ; RF saturation B1,rms=1.5μT and 2 seconds duration. For this specific CESTw sequence, α=1.3 and β=1.6 is a good choice to detect motion via inconsistency of Z-spectral data further using ω1=-580 Hz and ω2=-380 Hz.
Results
Figure 2 shows an example based on liver CESTw MRI in a volunteer. The chosen saturation frequency offsets for the motion consistency check, S[ω1] and S[ω2], are shown in Fig2.A and Fig2.B, respectively. The quotient S[ω1]/S[ω2] as shown in Fig2.C reveals motion
problems within the liver by elastic deformation, although the diaphragm position is rather stable based on the belt respiratory trigger. The standard MTRasym analysis in Fig2.D, including B0 field correction with a separate gradient echo B0 map (same resolution, ΔTE=1ms), shows false CEST hyper intensity artifacts at the locations indicated with circles (and at other locations as well). Using Z-spectral consistency checks at ω1 and ω2, Fig2.E, the areas affected by motion can be readily detected, as visible in the black areas of the mask. Finally, MTRasym could be masked for Z-spectral inconsistency by setting the masked values set to 0%, called MTRasym;mc. Alternatively, the masked values can be set to a black color to clearly distinguish masked areas in CESTw images.
Discussion
Z-spectral consistency checks were successfully applied for masking motion corrupted areas in a liver MRI APTw acquisition. While a quantitative evaluation in a larger study is surely needed, the example clearly indicates the potential of consistency checks to avoid evaluation based on motion corrupted CESTw signals. Also (partly) re-scanning of Z-spectral data could be evoked by automated analysis of consistency.Acknowledgements
The authors would like to thank Michael Knopp and Guang Jia for providing the volunteer APTw liver data.
References
[1] Zhou J, Payen JF, Wilson DA, Traystman RJ, van Zijl PCM. Nature Medicine 2003; 9:1085.Figures
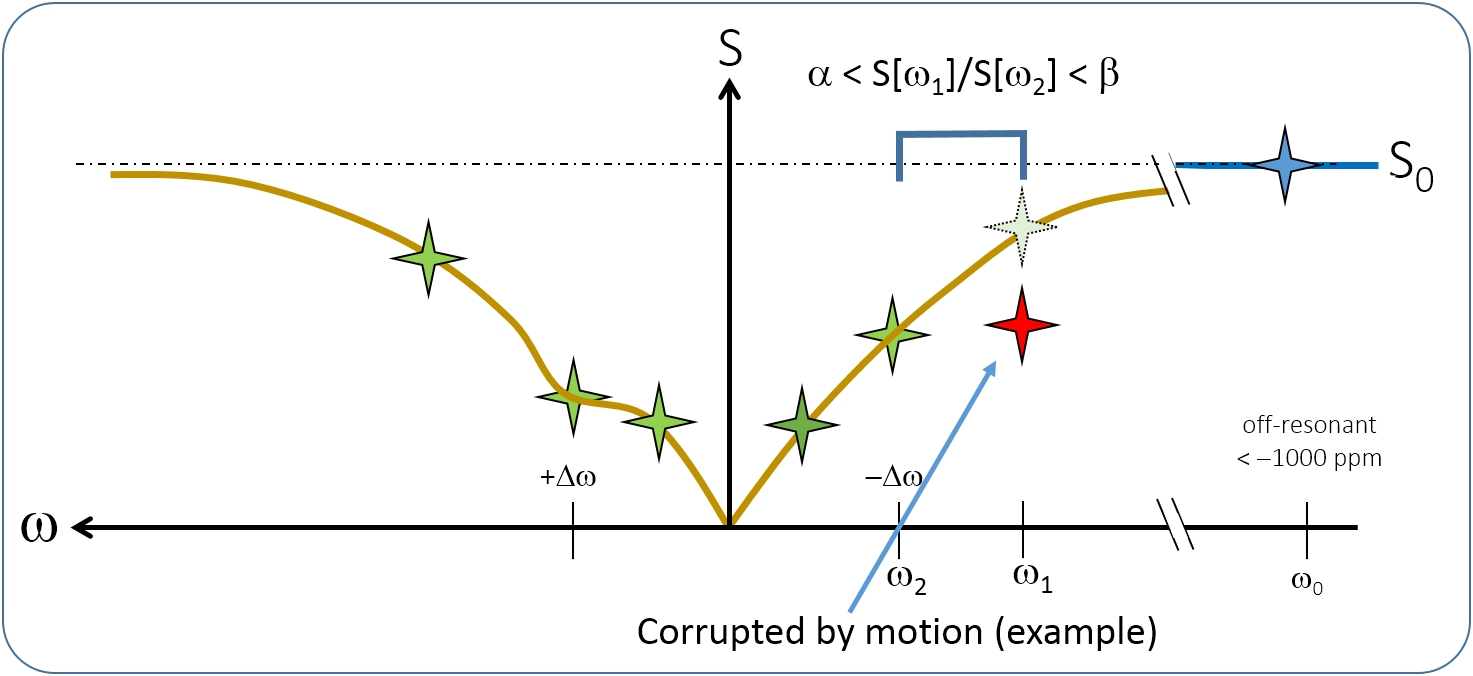
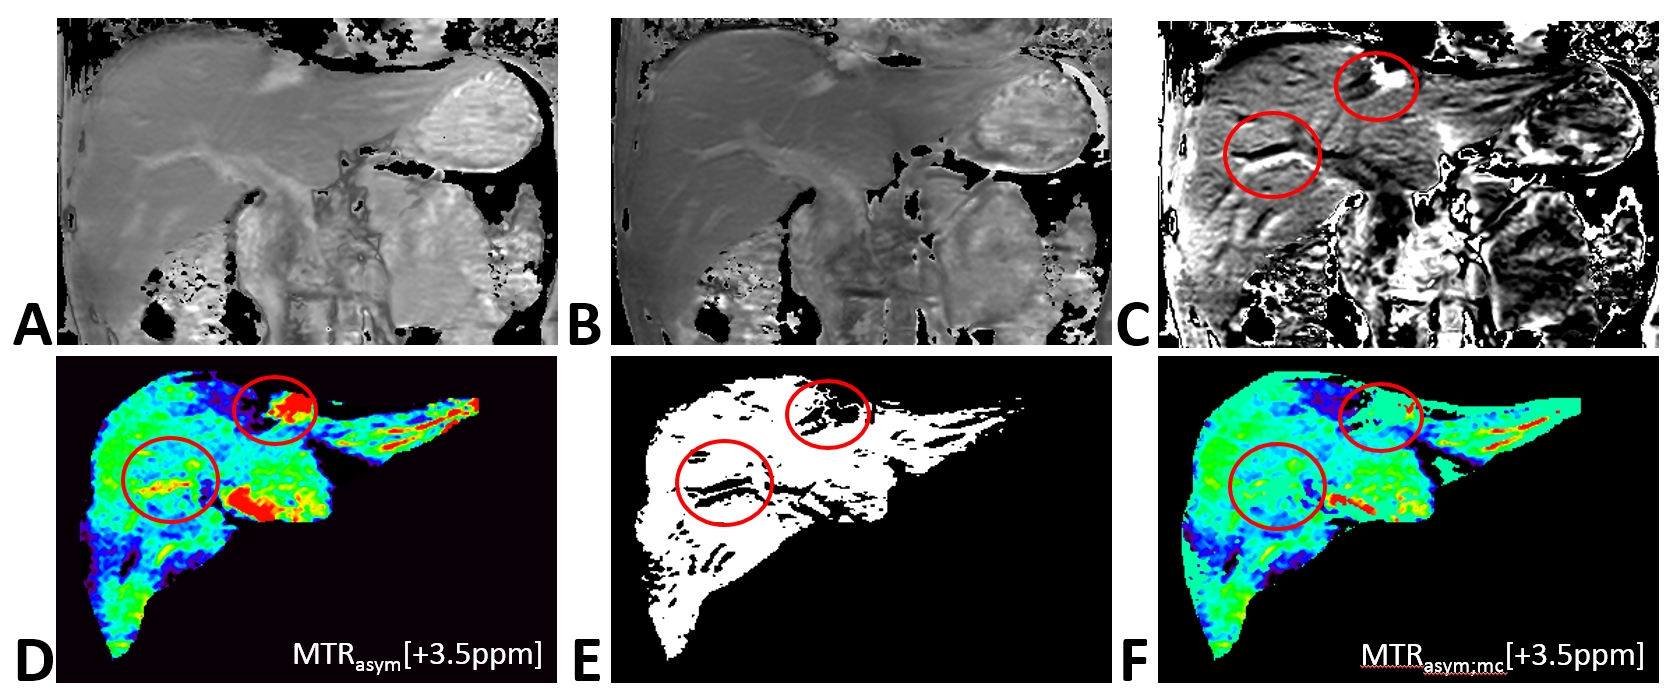
Figure 2: Example for masking of inconsistent Z-spectral
data in CESTw MRI. (A) S[ω1]; (B) S[ω2]; (C) Quotient S[ω1]/S[ω2] shows motion
problems within the liver, although diaphragma position is rather stable using
a respiratory trigger. (D) Result of asymmetry analysis (MTRasym) with B0 field correction at Δω=+3.5ppm (APTw). (E) Mask based on Z-spectral consistency at ω1/ω2. (F) MTRasym masked for Z-spectral inconsistency (masked values set to 0%), called MTRasym;mc.