4110
Motion-correction algorithm for free-breathing, fast-heart rate small animal studies on clinical scannersMatthew Tarasek1, Jeannette Roberts2, Deirdre Cassidy 3, Thomas Foo1, Desmond Yeo1, Randall Carter2, and Brian Bales2
1MRI, GE Global Research, Niskayuna, NY, United States, 2Life Sciences, GE Global Research, Niskayuna, NY, United States, 3Life Sciences, GE Healthcare UK, United Kingdom, United Kingdom
Synopsis
Small animal scanning methods are common for preclinical efficacy evaluation of contrast agents, and naïve animal studies done on clinical scanners are becoming more prevalent. Unfortunately, scanning small animals on large-bore clinical scanners creates several challenges such as motion effects due to organ movement and very fast heart-rates. Here we provide a retrospective motion-correction algorithm for fast-heart-rate/free-breathing small animals based on diaphragm tracking. Results show a ten-fold reduction in baseline contrast region signal uncertainty and significant accuracy improvement of pharmacokinetic time-constant estimation.
Purpose:
Contrast agents are used extensively in magnetic resonance imaging (MRI) to identify areas of pathology in anatomical structures.1 Small animal scanning methods are common for preclinical efficacy evaluation of these agents, and naïve animal studies done on high-field clinical scanners are becoming more prevalent.2,3 Unfortunately, scanning small animals on large-bore clinical scanners creates several challenges. Some examples include reduced SNR, motion effects due to organ movement and extremely fast animal heart-rate, and body temperature control. Image gating to accommodate for a fast heart-rate (>200 BPM) in small animals is very challenging without specialized equipment and most gating methods for small animals result in major time resolution reduction.4 Here we provide a retrospective motion-correction algorithm is presented for fast-heart-rate/free-breathing small animals based on diaphragm tracking. Results show a ten-fold reduction in baseline contrast region signal uncertainty and significant accuracy improvement of pharmacokinetic time-constant estimation with minimal reduction in time-resolution.Methods:
Six female Sprague Dawley rats were used in this for proof-of-concept study. Rats were injected with 0.1 mmol/kg of a novel macrocyclic Mn-chelate. MR Imaging tests were performed on a clinical 3T GE MR750 scanner (GE Healthcare, Waukesha, WI) using a rat-sized transmit/receive quadrature Litz rat coil (Doty Scientific). Two sets of imaging data were acquired: (i) pre-injection: acquired on the rats before injection, and (ii) a 30-minute post-injection time series. During imaging, rats were anaesthetized using isoflurane and core body temperature was monitored by a calibrated fiber-optic rectal thermometer (SA Instruments, Stony Brook NY). Multi-phase T1W data sets were acquired using 2D gradient echo sequence with the following imaging parameters: FA = 30°, TR = 6.2ms, TE = 1.9ms, FoV = 13cm2, matrix 256 x256, NEX = 1, full kidney sagittal slice coverage, 4-5 mm thick, 300ms time resolution. The post-processing algorithm was written in Matlab (Mathworks, Natick, MA) which included the following steps: (i) Images were masked below the kidney and edge-detection of the diaphragm was performed based on a Sobel approximation; in general, the method returns edges at points where the gradient of the image intensity is maximum. (ii) Three pairs of (x,y) points were extracted at different locations along the bottom of the diaphragm (see Fig. 1c). For each fiducial point, the spatial changes in S/I and A/P directions were vectorized (plot shown for visualization in Fig.1a-b), and (iv) data was mapped for motion binning according to |DS/I – average(S/I)| as depicted in Fig.2. Time-resolved signal intensity was analyzed in the kidney region pre-inject and post-contrast-inject, with and without motion correction binning results (Fig. 3a-d). Pharmacokinetic evaluation was performed to evaluate the result of motion correction on estimated rate constants, and to determine minimum binning edges (visualized in Fig. 2 shaded region) for accurate curve fitting, i.e. fit R2 >0.9 (Fig. 4).Results:
The plots in Fig. 1 a-b show the spatial changes in S/I and A/P directions for the top (red) fiducial point in Fig. 1 right. In general, we see a 5+-fold greater change in S/I than A/P directions for all fiducial point selections. In all cases, data for S/I direction change from the top (red) fiducial point had the greatest magnitude, and thus was used as primary input for motion binning. Results of motion correction binning can be visualized in Fig. 3, and overall shows a ~10x reduction in pre-injection signal variation (Fig. 3 a-b), which leads to large reduction in signal uncertainty for the full dynamic-contrast experiment (DCE) as can be seen in Fig. 3 c-d. Selections for minimum binning edges were made by optimizing for Pearson correlation coefficient (R2 > 0.9) of curve fit to data. Results are shown in Fig. 4 and indicate a >66% change between time-constants with and without motion correction.Discussion and Conclusion:
Results suggest that the most superior fiducial point of the diaphragm provides the most substantial motion patterns dominated by S/I position shifts. A motion-based data-binning of these S/I position shifts provides robust accuracy improvement for pharmacokinetic rate constant estimation in the rat kidney. Accuracy improvements were seen for all 6 rats studied in this cohort. Further improvements are possible by incorporation of A/P motion binning correction (in addition to S/I), although results indicate that this will add <5% accuracy improvement in kidney DCE. Ongoing work will look at liver and heart DCE results with both A/P and S/I motion binning.Acknowledgements
No acknowledgement found.References
[1] Caravan et al. Chem. Rev., 99:2293-2352(1999) [2] Herrman et al. Mag Res Mater Phy 0284-5 (2011) [3] Yamamoto et al. Radiol Phys Technol. 2(1):13-21. (2009) [4] Gilson et al. Methods, vol. 43, no. 1, pp. 35–45, (2007) [5] Tofts et al, MRM 17: 35767 (1991)Figures
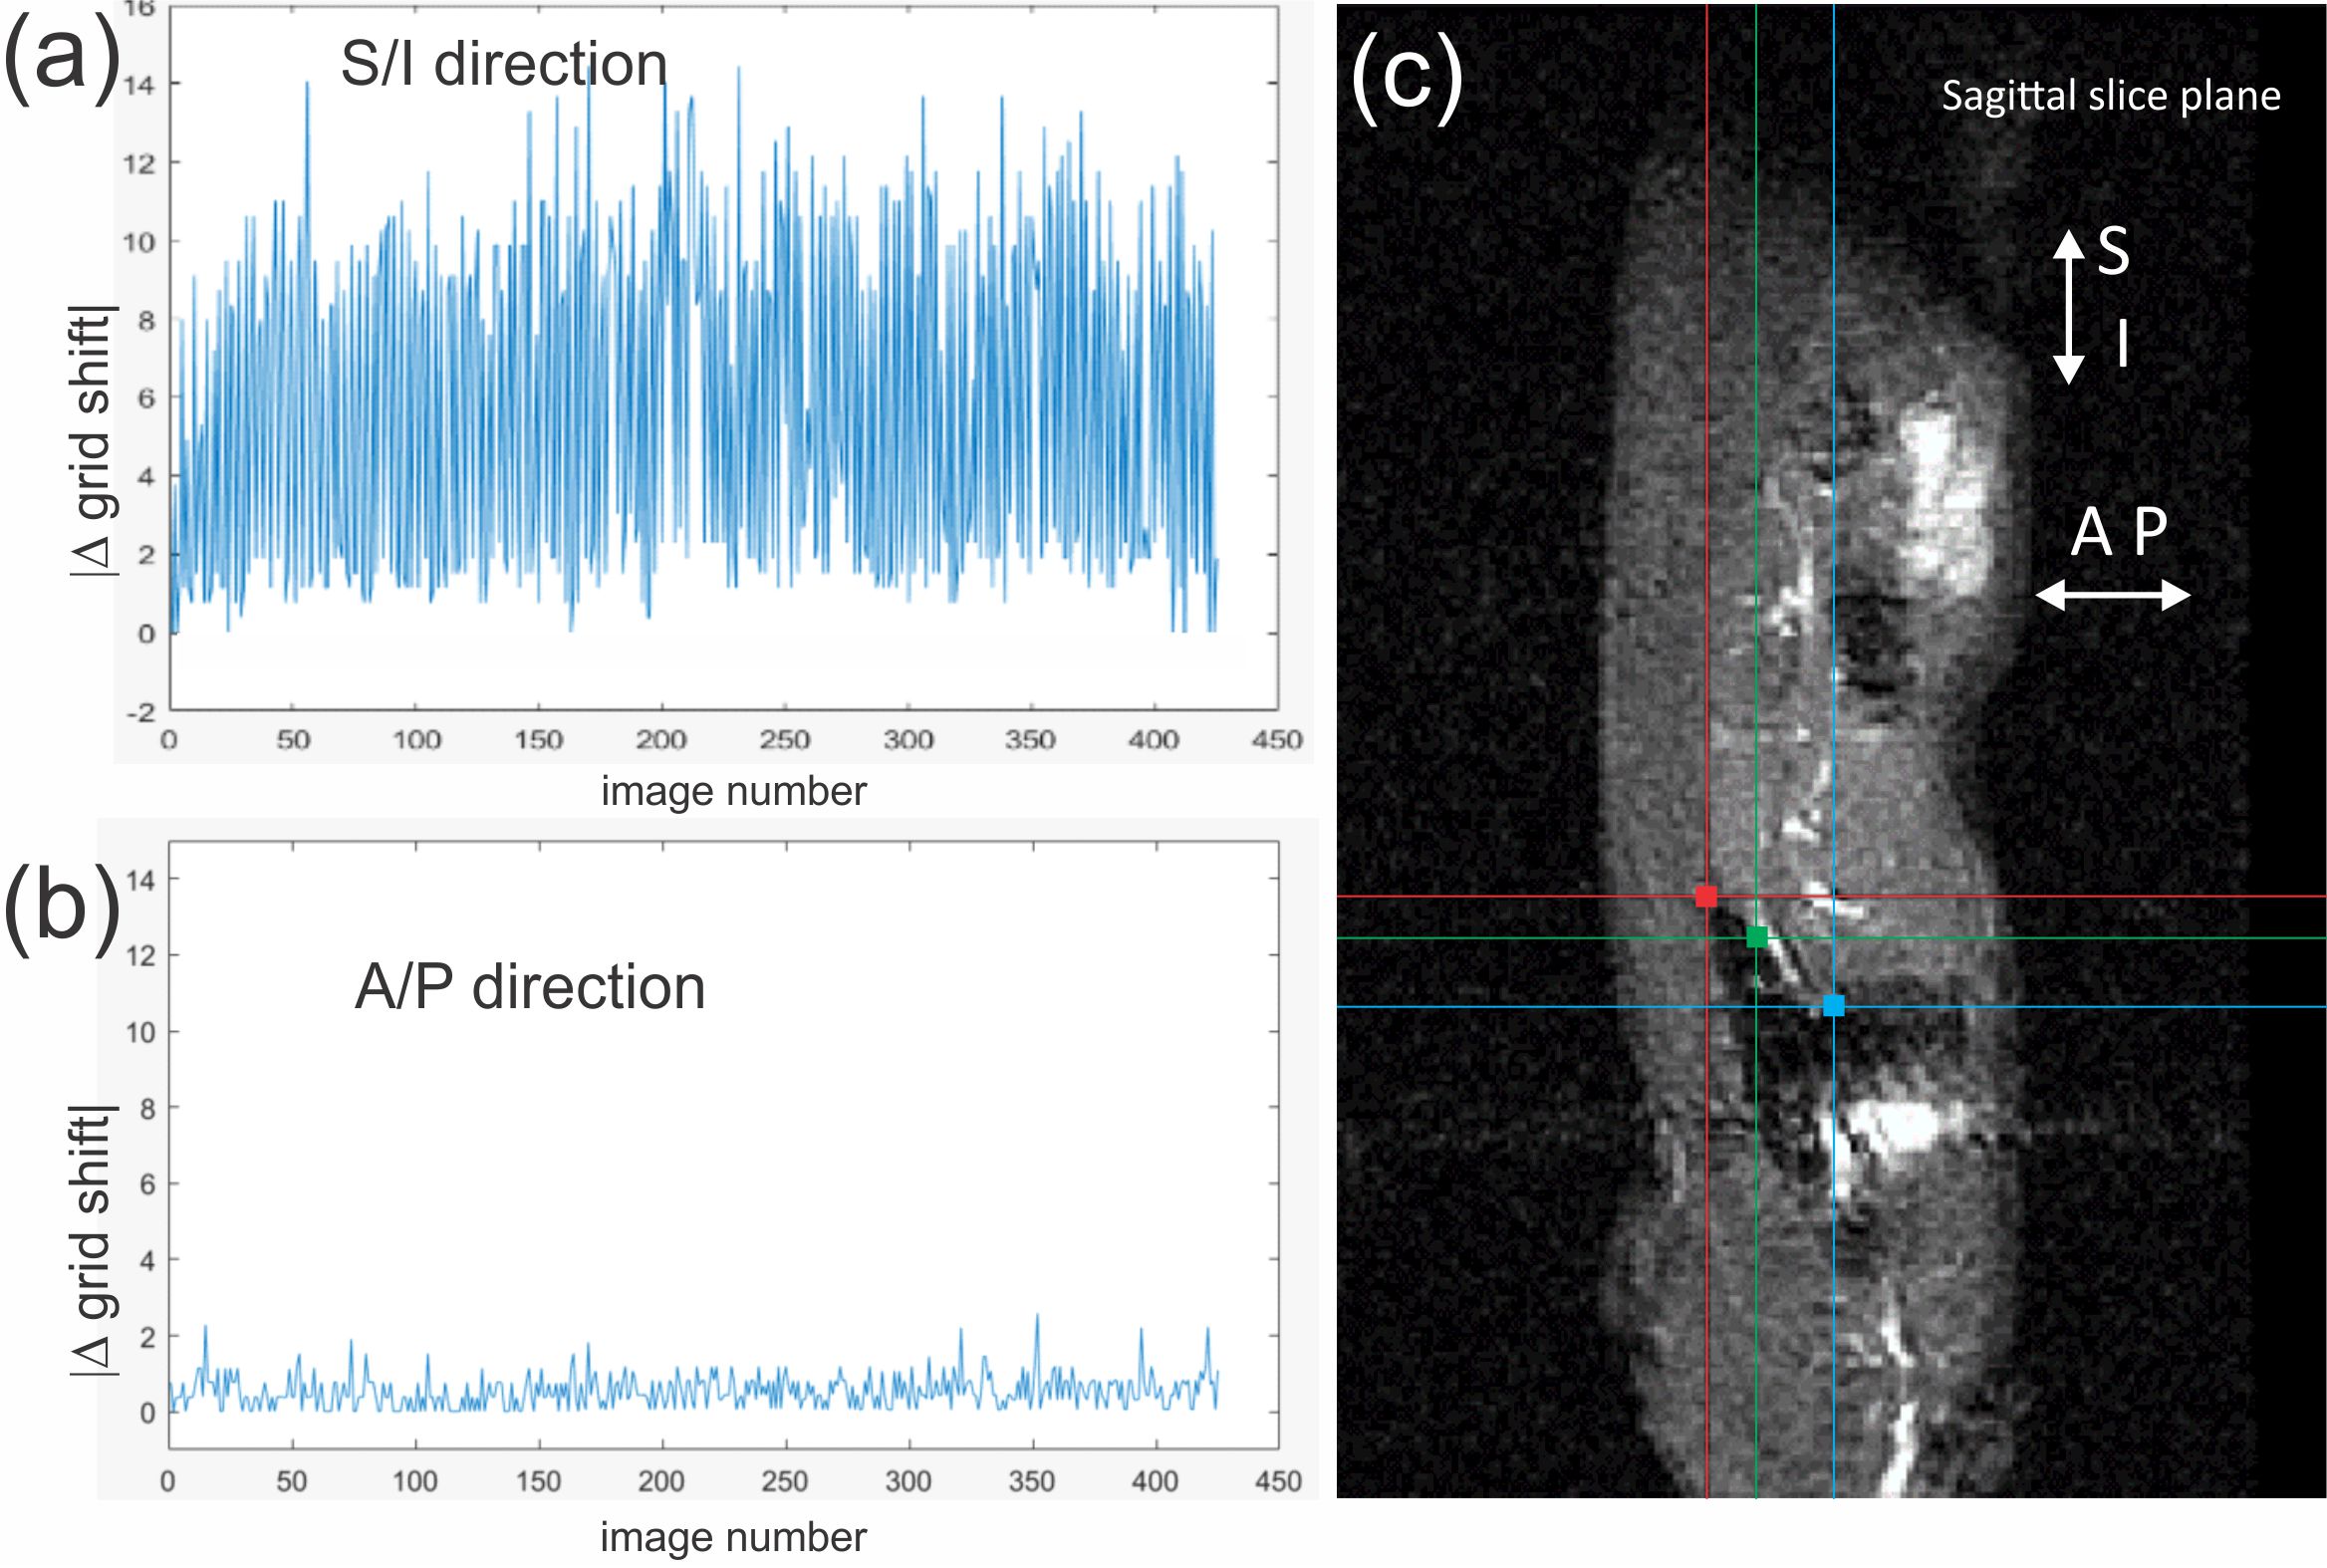
Fig. 1 Motion measured
for S/I and A/P directions. (a) Shows the S/I direction motion for the most
superior point of the diaphragm (red square). (b) Shows the A/P direction
motion for the same position as in (a). (c) Shows the positions selected for
motion tracking in the diaphragm in the sagittal slice plane.
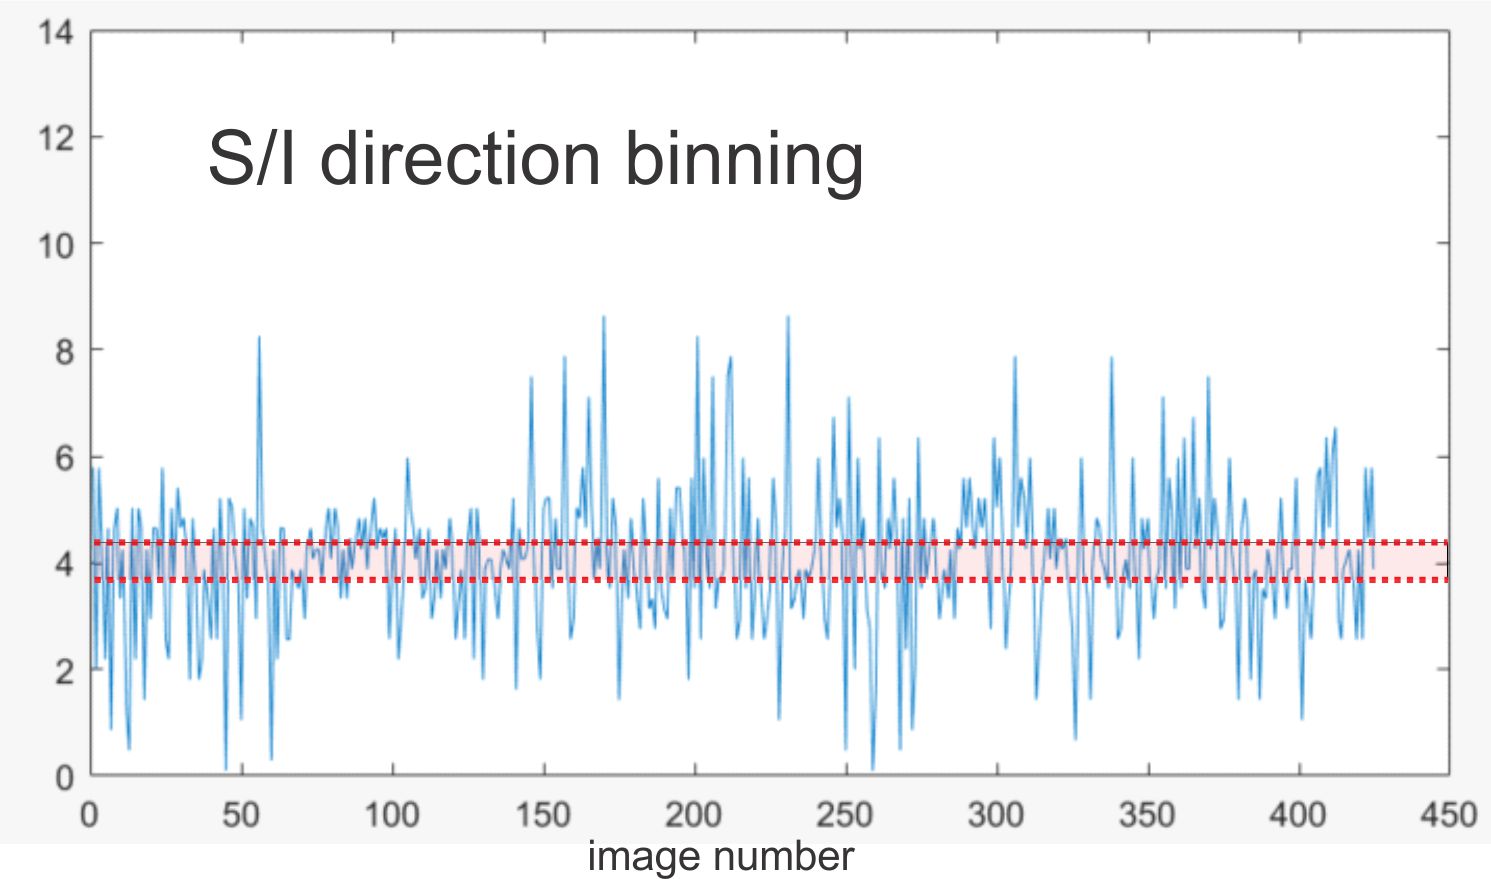
Fig. 2 S/I position data from Fig. 1a mapped
for motion binning. Shaded/red region indicates example of binning edges. See
text for details.
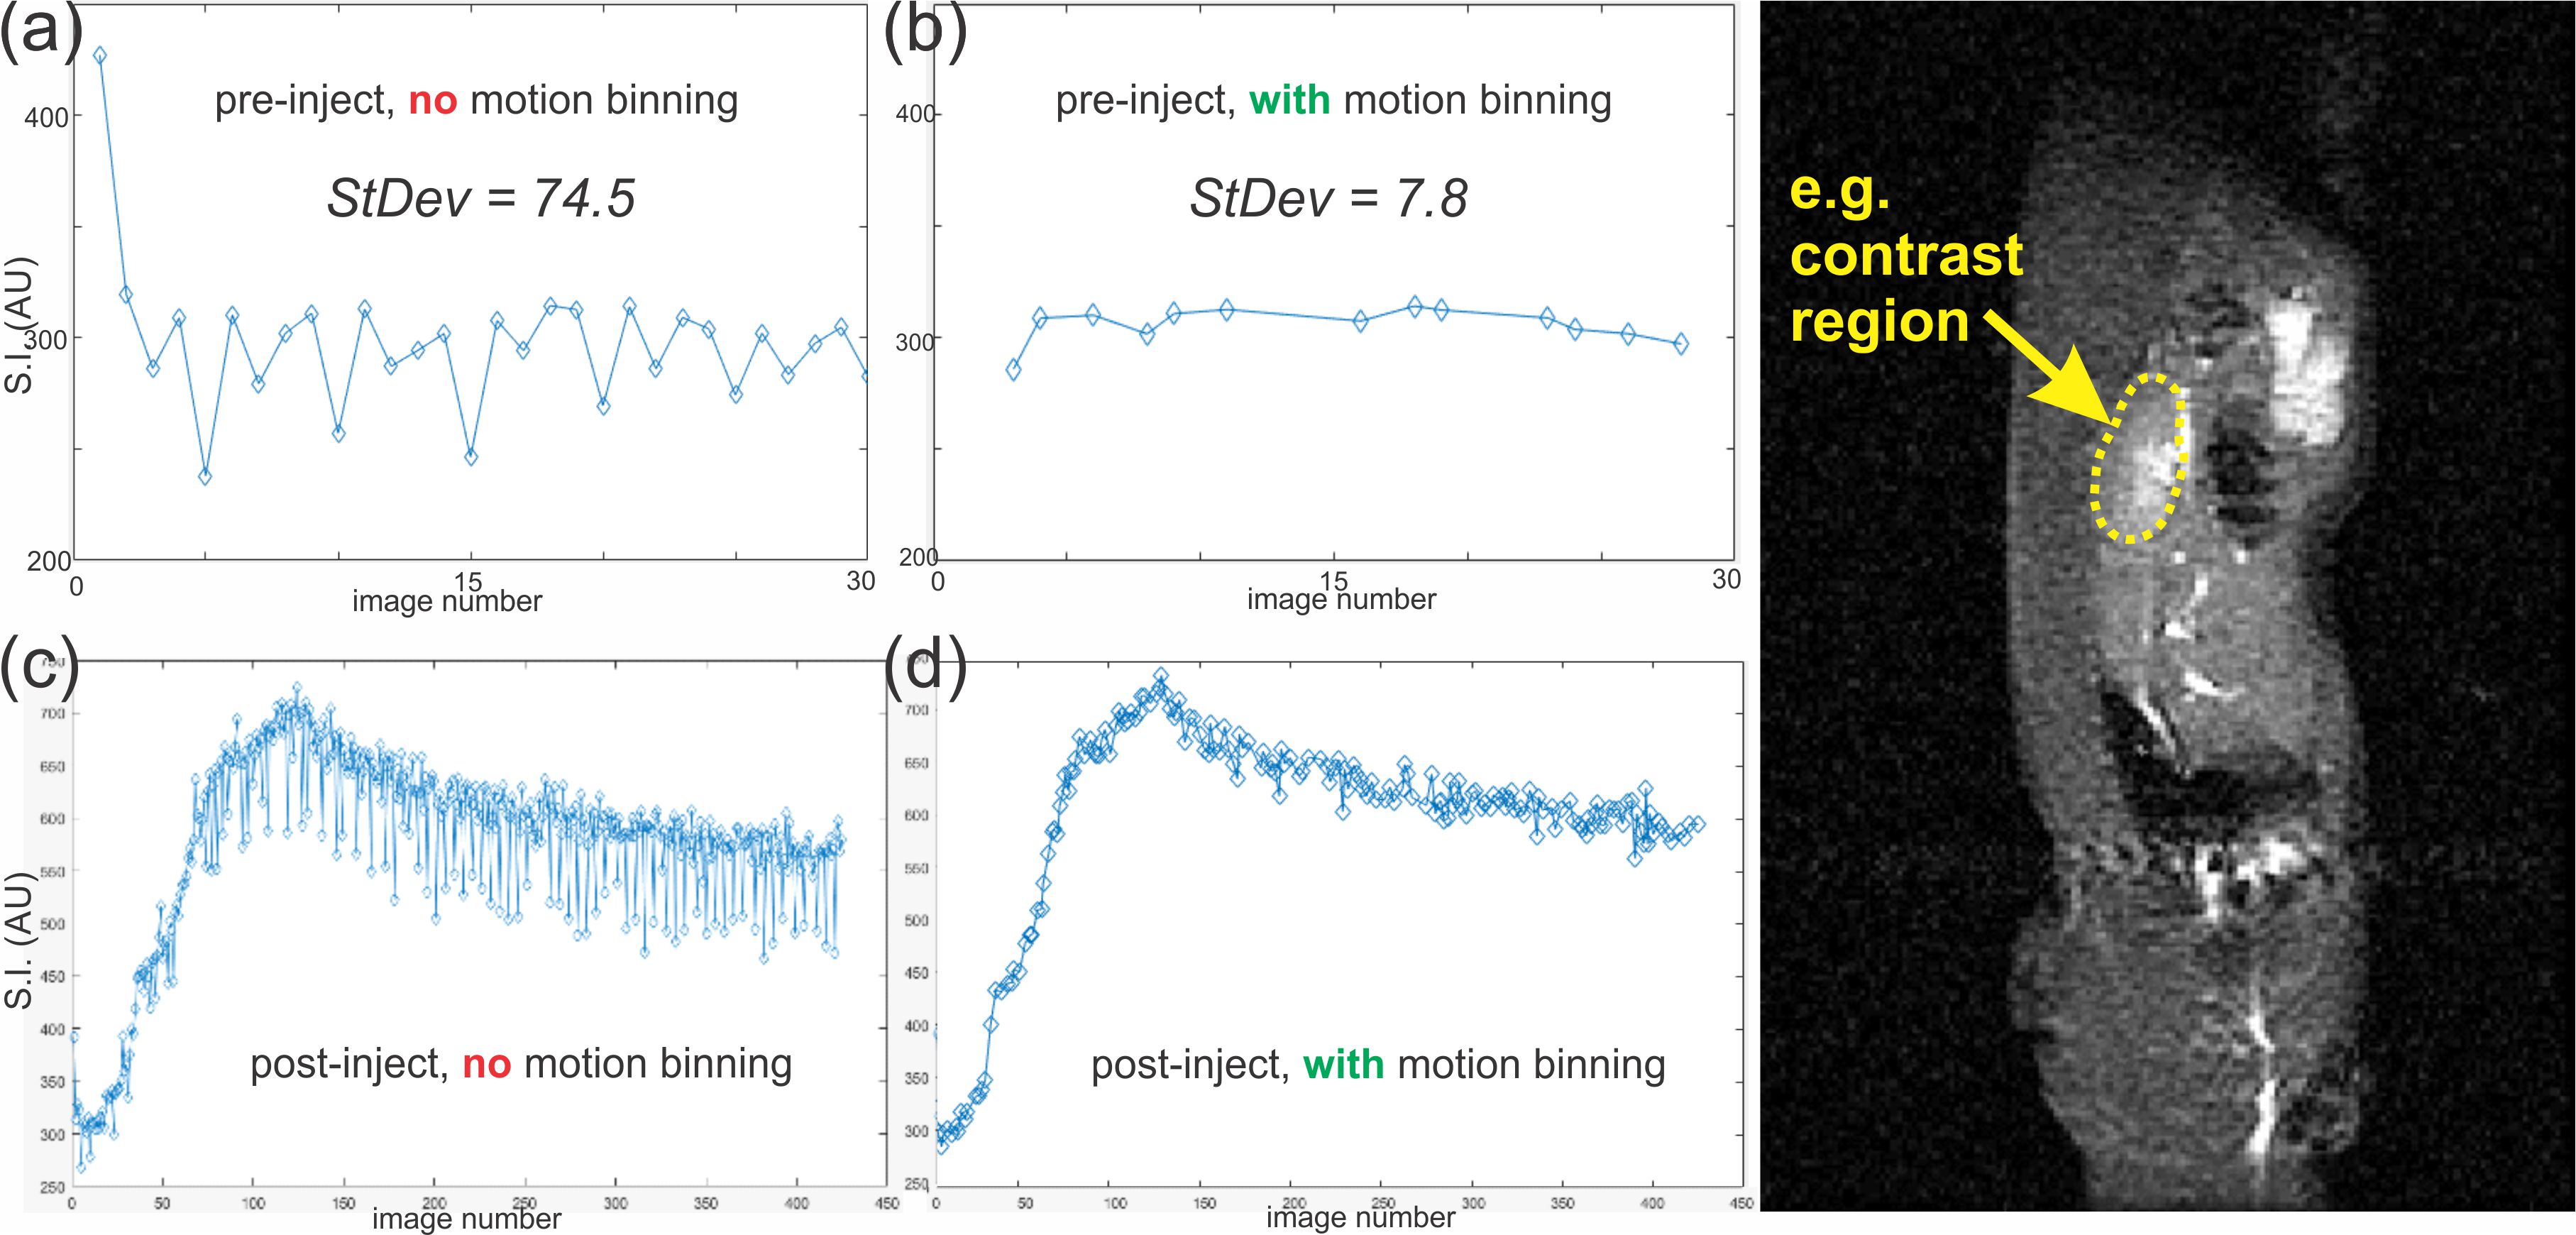
Fig. 3. Comparison of DCE-MR results
with (b,d) and without (a,c) S/I motion binning. Far right image indicates general
region where MR signal is averaged in all plots (i.e. the kidney).
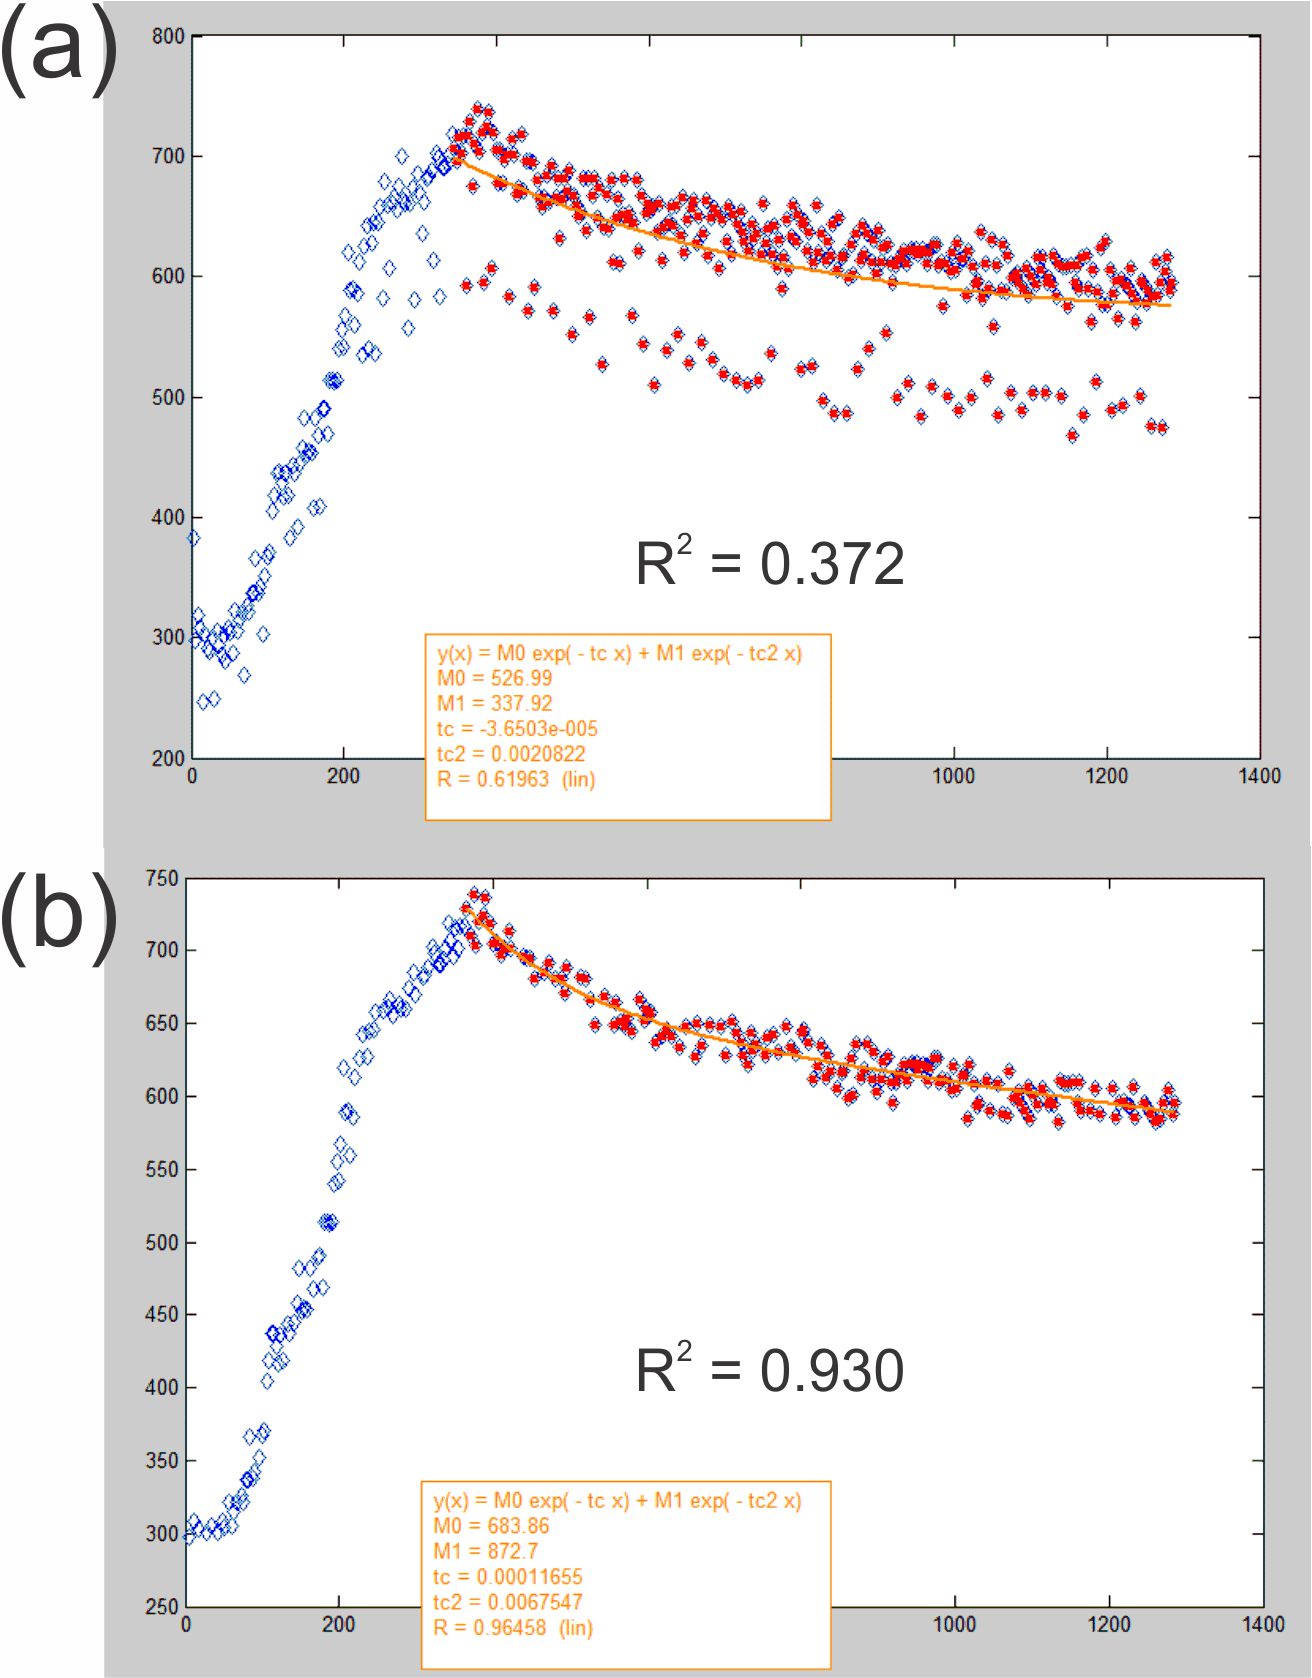
Fig. 4 Fitting/time-constant
estimation of data shown in Fig. 3(c,d) without
(a) and with (b) motion correction. Fitting
was performed using a bi-exponential signal decay model y(x) = A1*e^(-b1*x) + A2*e^(-b2*x) according to Tofts et al.5