4101
Separation And Quantification Of Head Motion Modes By Pilot Tone Measurements1Siemens Healthcare GmbH, Erlangen, Germany, 2Siemens Medical Solutions, New York, NY, United States, 3Siemens Healthcare GmbH, Lausanne, Switzerland
Synopsis
Pilot Tone Navigation, a new highly integrated electromagnetic navigation method, was applied to characterize head motion in a guided volunteer experiment. Nodding ("yes") and shaking ("no") motion could be separated and quantified by optimizing linear signal combinations from 20 receive channels on fluoroscopically acquired images. These initial results suggest that head motion can be continuously monitored via the regular MRI receive chain without interaction with the acquisition using a single Pilot Tone generator.
Introduction
Motion during head exams is a frequent source of artefacts. Proposed solutions1 apply motion-insensitive acquisition methods, external correction devices2 or MR-based navigator methods3.
Pilot Tone (PT) navigation4 is an electromagnetic navigation method that minimizes hardware requirements by utilizing the MR scanner for detection and signal processing. It enables continuous quantitative motion monitoring without interfering with the MR measurement. PT navigation has recently been evaluated for respiratory5 and cardiac navigation6. Here, we investigate if PT signals can be used to characterize head motion quantitatively using an approach resembling FID-based navigation7 with the additional advantage that the MR measurement is not disturbed.
Methods
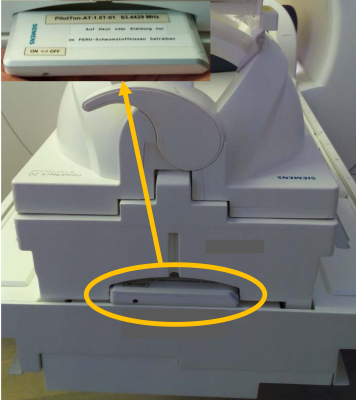
A volunteer experiment was conducted on a 1.5T clinical scanner (MAGNETOM Aera, Siemens Healthcare, Erlangen, Germany) equipped with a 20-channel receive-only head-neck coil. We placed a battery-powered prototype Pilot Tone generator6 just above the head in a recess of the head-neck coil, i.e. right under the head (Fig. 1). Head motion was monitored over 40s by a fluoroscopic GRE sequence that interleaved sagittally and transversally oriented images (TE=1.43ms,TR=2.5ms, frame rate 5Hz, 100 repetitions, flip angle 15°, PAT 2, 24 integrated reference lines, resolution: 192x192, 1.6x1.6x10mm3). Receive parameters were chosen adequately to place the PT signal at 64.44MHz into the two-fold oversampling region outside of the MR signal band.
The volunteer was asked to nod (“yes” motion) during scan A, and to shake his head (“no” motion) during scan B.PT signals were detected in a preprocessing step of a prototype image reconstruction program as described in4. Further analysis was done offline in Matlab (Mathworks, Natick, NJ): Head motion ground-truth during each scan was characterized by the in-plane rotation angle for all frames $$$\vec{R_{k}}$$$ in the image plane that contained the motion direction, relative to a chosen reference frame $$$k$$$ as detected by rigid registration (Matlab Image toolbox function imregcorr). Registration followed by removal of a constant offset was repeated for all possible reference frames, yielding a matrix of size 100x100 of rotation angles $$$\hat{R_k^{PT}}=[\vec{R_1}, ..., \vec{R_{100}}]$$$ .
PT signals were averaged over each image frame, followed by channel-wise offset removal, resulting in a 20-element vector $$$\vec{PT}$$$ . Coil combination coefficient vectors $$$\vec{C_k}$$$ were calculated by maximizing the correlation of $$$\vec{R_k^{PT}}=\vec{C_k}\cdot\vec{PT}$$$ with $$$\vec{R_k}$$$ . For each motion results were averaged over all reference frame choices, yielding rotation ground truth $$$\vec{R_A}$$$ and $$$\vec{R_B}$$$ , combination vectors $$$\vec{C_A}$$$ and $$$\vec{C_B}$$$ , and PT surrogate signals $$$\vec{R^{PT}_A}$$$ and $$$\vec{R^{PT}_B}$$$.Results
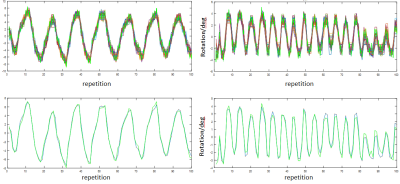
For the "yes" motion, the rotation angle range was 13° with eight periods; for the "no" motion, the rotation angle range was 7° with 18 periods. Fig. 2 compares head motion angles derived from image registration with angles derived from matched PT navigators. The averaged curves match well (bottom), their differences are smaller than the signal variations with reference frame choice (top). This indicates that the ground truth variance limits the accuracy of the PT calibration in our experiment.
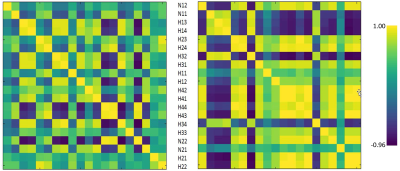
To be able to separate independent motion modes by PT measurements, their corresponding PT combination weight vectors have to be linearly independent. Figure 3 shows cross correlation plots for the raw PT signals for both scans. The substantially different structure suggests that orthogonality is achievable without substantial SNR loss.
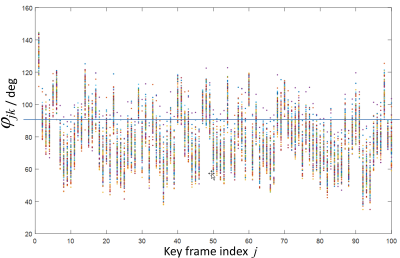
This is confirmed by calculating the angle $$$\phi_{jk}$$$ between all pairs of $$$\vec{C_{j,A}}$$$ and $$$\vec{C_{k,B}}$$$ for all choices of reference frames $$$j$$$ and $$$k$$$, shown in Fig. 4. Values for $$$\phi_{jk}$$$ vary between 40° and 145°, with the average around 73°. Orthogonality can be achieved by numerous combinations as indicated by the blue line.
Conclusion
We found in our model experiment for two orthogonal motions a high correlation between ground-truth motion angles and trained PT surrogate signals. The number of receive elements in a standard head coil provides enough degrees of freedom to choose PT surrogate signals that are linearly independent. Thus we conclude that PT signals from a single PT generator and received with a standard head coil can be used to distinguish between two orthogonal rotational motions.
Our encouraging initial results warrant further exploration of this method as an efficient means to detect and characterize head motion independently of the MR measurement. Next steps towards clinical usefulness include extending the method to all relevant degrees of freedom for head motion as well as further volunteer studies.
Acknowledgements
References
1. F. Godenschweger et al, 2016 Phys. Med. Biol. 61 R32
2. M. Zaitsev et al., NeuroImage 31 (2006) 1038
3. J. MacLaren et al., Magn Reson Med. 2011, 69:621
4. P. Speier et al, Proc. ESMRMB 2015, 129
5. T. Vahle et al, Proc. ISMRM 2017, 3897
6. M.Bacher et al, Proc. ESMRMB 2017, 259&360
7. T. Kober et al., Magn Reson Med. 2011, 66:135
Figures

Figure 1: Placement of the battery-powered prototype Pilot Tone generator inside the 20-channel head-neck coil

Figure 2: Comparison of head rotation angles around transverse axis for “no” motion (left) and around sagittal axis for “yes” motion (right). Top: Angles for all choices of reference frame from Pilot Tone (green dots) and image registration (solid lines). Bottom: Averaged rotation angles from Pilot Tone (green) and image registration (blue)

Figure 3: Cross correlation matrix of Pilot Tone signal across channels for "no" (left) and "yes" (right)

Figure 4: Unsigned angle $$$\phi_{jk}$$$ between PT combination coefficient vectors $$$\vec{C}_{j,A}$$$ for "yes" and $$$\vec{C}_{k,B}$$$ for "no" motion; blue line indicates orthogonality of the derived Pilot Tone navigators.