4093
Wasserstein GAN for Motion Artifact Reduction of MR imagesSandro Braun1, Pascal Ceccaldi1, Xiao Chen1, Benjamin Odry1, Boris Mailhe1, and Mariappan Nadar1
1Medical Imaging Technologies, Siemens Healthineers, Princeton, NJ, United States
Synopsis
Subject motion is a common artifact in MR acquisition that can severely degrade image quality. We take advantage of the recent advances in deep generative network to compensate motion and generate images of increased quality, measured by evaluating changes in MSSIM and normalized L2 distance (NRMSE). We trained an image to image network to predict motion compensated magnitude images given motion-corrupted input images, coupled with an adversarial network to help refine those predicted images. For the discriminator loss, we use the Wasserstein objective. The results suggest clear improvements on MSSIM and NRMSE metrics for the majority of cases.
Introduction
Subject motion is a common artifact in MR acquisition that can severely degrade image quality. Traditional methods have attempted to correct motion with markers and navigators1-3, while image entropy minimization has been tried with data driven approaches4, 5. We take advantage of the recent advances in deep generative network to compensate motion and generate images of increased quality, measured by evaluating changes in MSSIM and normalized L2 distance (NRMSE).Methods
We trained an image to image network to predict motion compensated magnitude images given motion-corrupted input images, coupled with an adversarial network to help refine those predicted images, as shown in figure 1. For the generator, a fully convolutional DenseNet6 is defined with 48 initial feature-maps, a growth rate of 12, 3 convolutional layers per dense-block and 4 levels of pooling are utilized. We use leaky-ReLU activations throughout and a sigmoid final activation. The network is trained to minimize the sum of two losses: the supervised L1 distance of the generator prediction $$$E_{(x,y)}\parallel y-G(x)\parallel_{1}$$$, and an unsupervised adversarial term $$$E_{(x)}D(Gx))$$$. D is trained to differentiate a motion-compensated image from the original no-motion image. The discriminator architecture is a patchGAN7 with a receptive field of 34. The discriminator tries to classify each 34x34 patch of the generated image. Scores for all patches are then aggregated via a mean pooling to give a prediction on the whole image. For the discriminator loss, we use the Wasserstein objective $$$max_{D\epsilon L(1)} E_{(x)}[D(G(x))] - E_{(y)}[D(y)]$$$ 8. We train our model on 127,854 simulated slices extracted from 90 T2 weighted cases of the HCP dataset9. Examples of simulated cases are shown in figure 2. The training is done slice-per-slice on all three orientations. Data augmentation included random transformations, such as identity, horizontal and vertical mirroring, and 90, 180 and 270 degrees rotations. The inputs are normalized by the maximum intensity in the training set and padded to 320 by 320. We train end-to-end with a batch-size of 5 and the ADAM optimizer10 with a learning rate of 0.002. The motion corrupted images were generated using a motion simulation. 2D in-plane translational motion for each slice is assumed. The k-space readout is assumed fast enough to freeze any patient motion and only inter-readout motion is simulated.Results
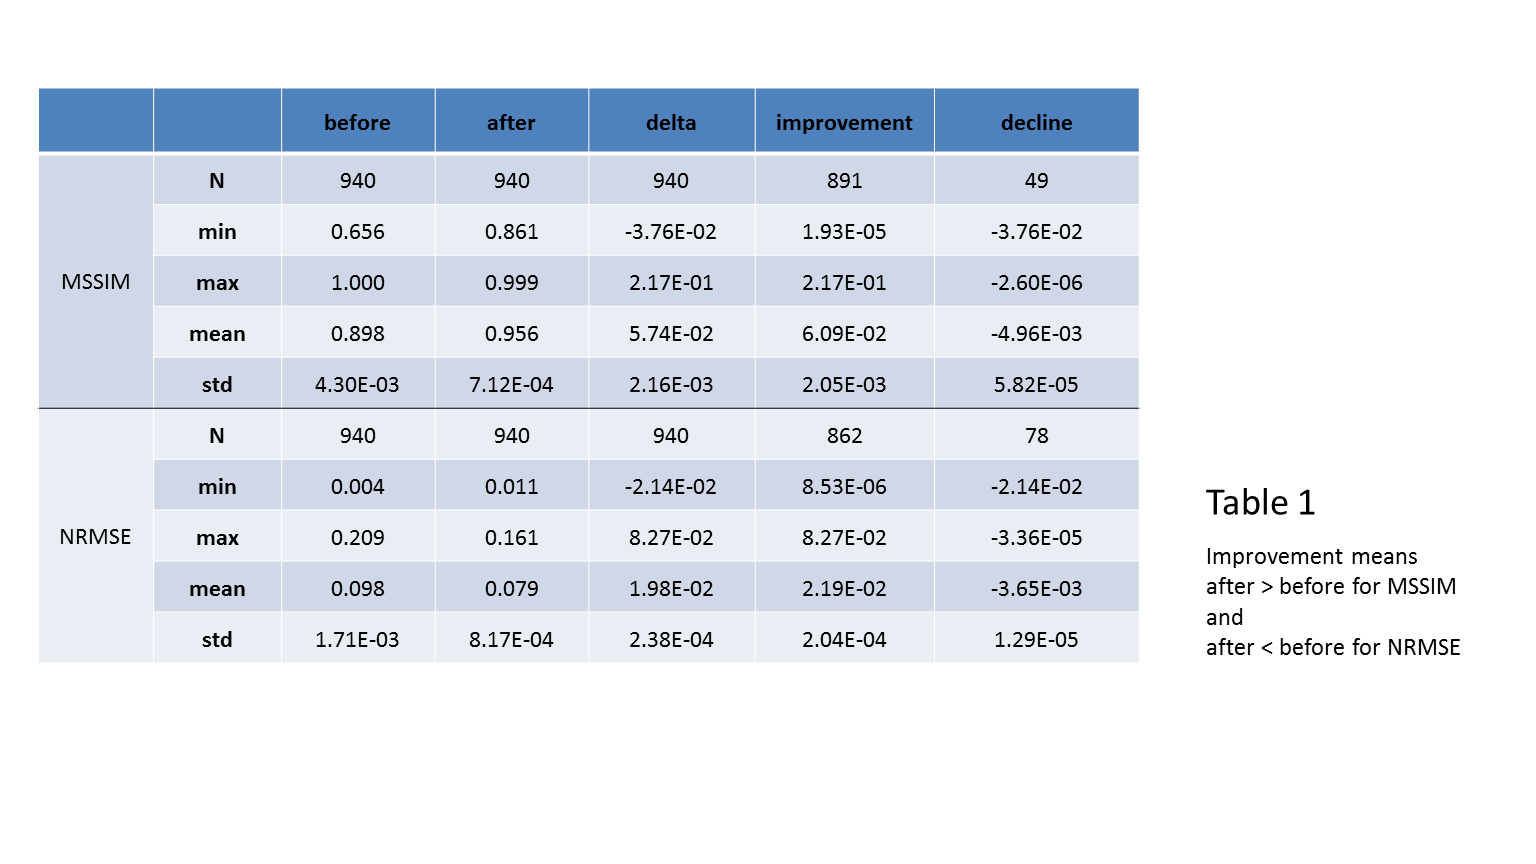
Figure 2 shows examples of motion corrected images and associated quality scores. To evaluate the networks performance, we calculate, the mean SSIM11 (MSSIM) and the normalized L2 distance (NRMSE) for 940 test slices of axial orientation and compare the before and after metrics. Figures 3 (a) and 1 (c) show the histogram for both metrics before and after the correction. Figures 3 (b) and (d) show the histogram of the quality increase (higher for MSSIM or lower for NRMSE). There are cases that show decreased quality for both metrics. The mean MSSIM (NRMSE) improved from 0.898 ± 0.004 (0.098 ± 0.002) to 0.956 ± 0.007 (0.79 ± 0.008). The improvement for MSSIM (NRMSE) is between 1.93e-5 and 0.21 (8.53e-6 and 0.082). The maximum decline is -2.6e-6 (-3.36e-5). Overall, there is a mean difference for MSSIM (NRMSE) of 0.0574 ± 0.002 (0.0198 ± 0.002). Refer to table 1 for more details. We show the pointwise before – after relationship in figure 4. Mostly cases with already high quality are affected by a small decrease.Conclusion
We propose a WGAN to compensate motion artifacts in MR. The results suggest clear improvements on MSSIM and NRMSE metrics for the majority of cases. There are a small number of cases with very small amount of motion that saw a small decrease in image quality. As a first step to address this problem, the proposed method could be paired with an image quality estimator to only compensate scans that are of insufficient quality. A validation of the model on real motion cases is necessary to confirm the performance of the network. The architecture could as well be applied to ghosting or other k-space related artifacts.Acknowledgements
No acknowledgement found.References
[1] Maclaren J, Armstrong BSR, Barrows RT, et al. Measurement and Correction of Microscopic Head Motion during Magnetic Resonance Imaging of the Brain. PLoS One. 2012;7(11):3-11. doi:10.1371/journal.pone.0048088. [2] Gallichan D, Marques JP, Gruetter R. Retrospective correction of involuntary microscopic head movement using highly accelerated fat image navigators (3D FatNavs) at 7T. Magn Reson Med. 2015;1039:1030-1039. doi:10.1002/mrm.25670. [3] Alhamud A, Tisdall MD, Hess AT, Hasan KM, Meintjes EM, Van Der Kouwe AJW. Volumetric navigators for real-time motion correction in diffusion tensor imaging. Magn Reson Med. 2012;68:1097-1108. doi:10.1002/mrm.23314 [4]Loktyushin A, Nickisch H, Pohmann R, Schölkopf B. Blind multirigid retrospective motion correction of MR images. Magn Reson Med. 2015;73(4):1457-1468. doi:10.1002/mrm.25266. [5]Haskell M., Cauley S., Wald L. “Retrospective motion correction of head rotations in 2D RARE brain images using Targeted Motion Estimation and Reduction (TAMER)”, Proc. Intl. Soc. Mag. Reson. Med 25 (2017) [6]: Jégou, Simon, Michal Drozdzal, David Vazquez, Adriana Romero, and Yoshua Bengio. “The One Hundred Layers Tiramisu: Fully Convolutional DenseNets for Semantic Segmentation.” arXiv Preprint arXiv:1611.09326, 2016. https://arxiv.org/abs/1611.09326. [7]: Isola, Phillip, Jun-Yan Zhu, Tinghui Zhou, and Alexei A. Efros. “Image-to-Image Translation with Conditional Adversarial Networks.” arXiv:1611.07004 [Cs], November 21, 2016. http://arxiv.org/abs/1611.07004. [8]: Arjovsky, Martin, Soumith Chintala, and Léon Bottou. “Wasserstein GAN.” arXiv:1701.07875 [Cs, Stat], January 26, 2017. http://arxiv.org/abs/1701.07875. [9]: David C. Van Essen, Stephen M. Smith, Deanna M. Barch, Timothy E.J. Behrens, Essa Yacoub, Kamil Ugurbil, for the WU-Minn HCP Consortium. (2013). The WU-Minn Human Connectome Project: An overview. NeuroImage 80(2013):62-79. [10]: Kingma, Diederik P., and Jimmy Ba. “Adam: A Method for Stochastic Optimization.” arXiv:1412.6980 [Cs], December 22, 2014. http://arxiv.org/abs/1412.6980. [11]: Wang, Z., A.C. Bovik, H.R. Sheikh, and E.P. Simoncelli. “Image Quality Assessment: From Error Visibility to Structural Similarity.” IEEE Transactions on Image Processing 13, no. 4 (April 2004): 600–612. https://doi.org/10.1109/TIP.2003.819861.Figures
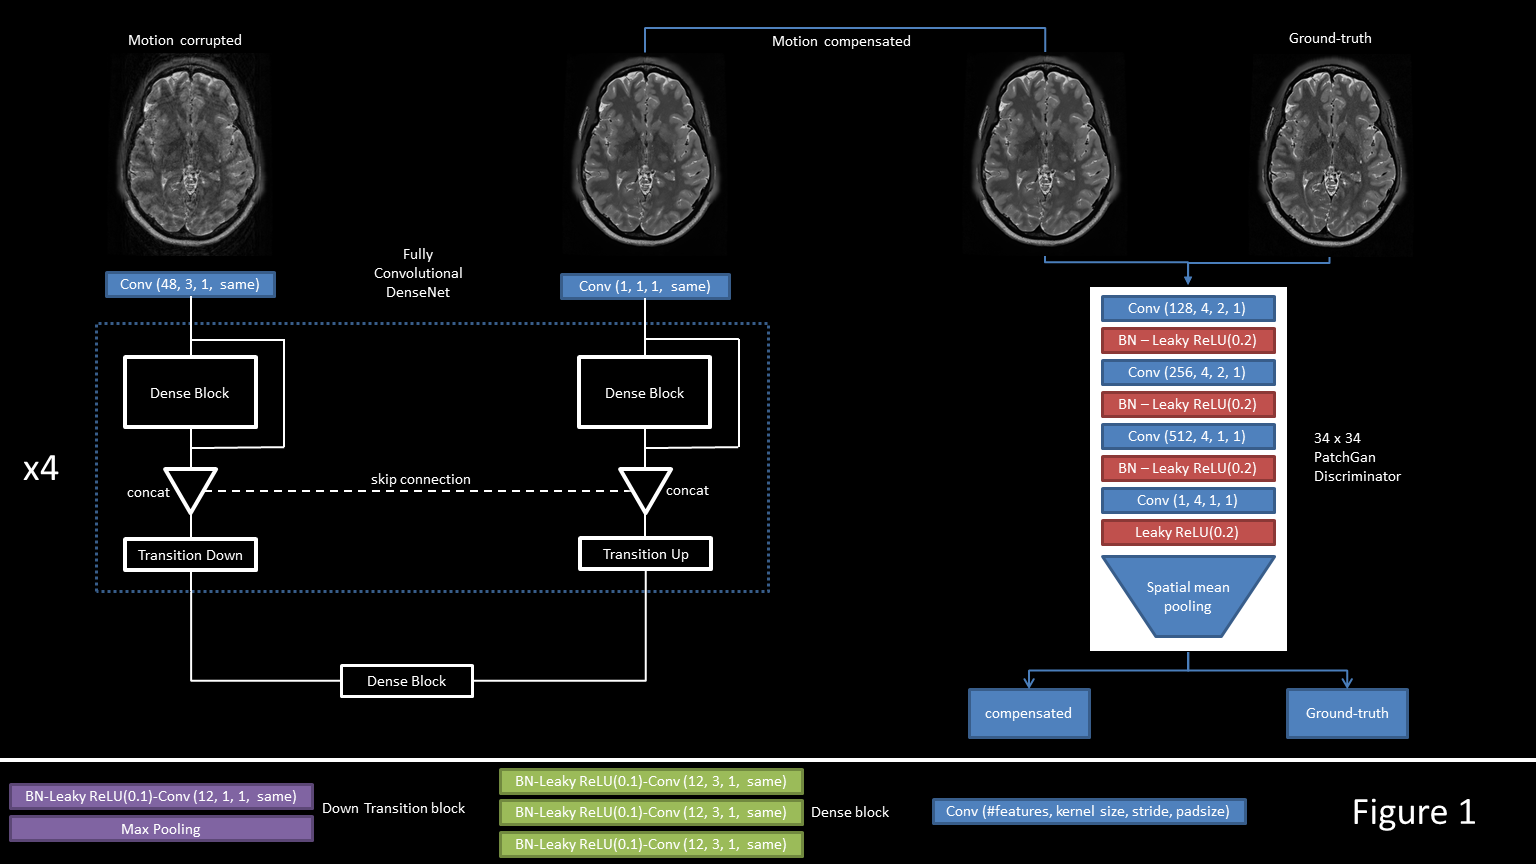
wGAN architecture for Motion Compensation.
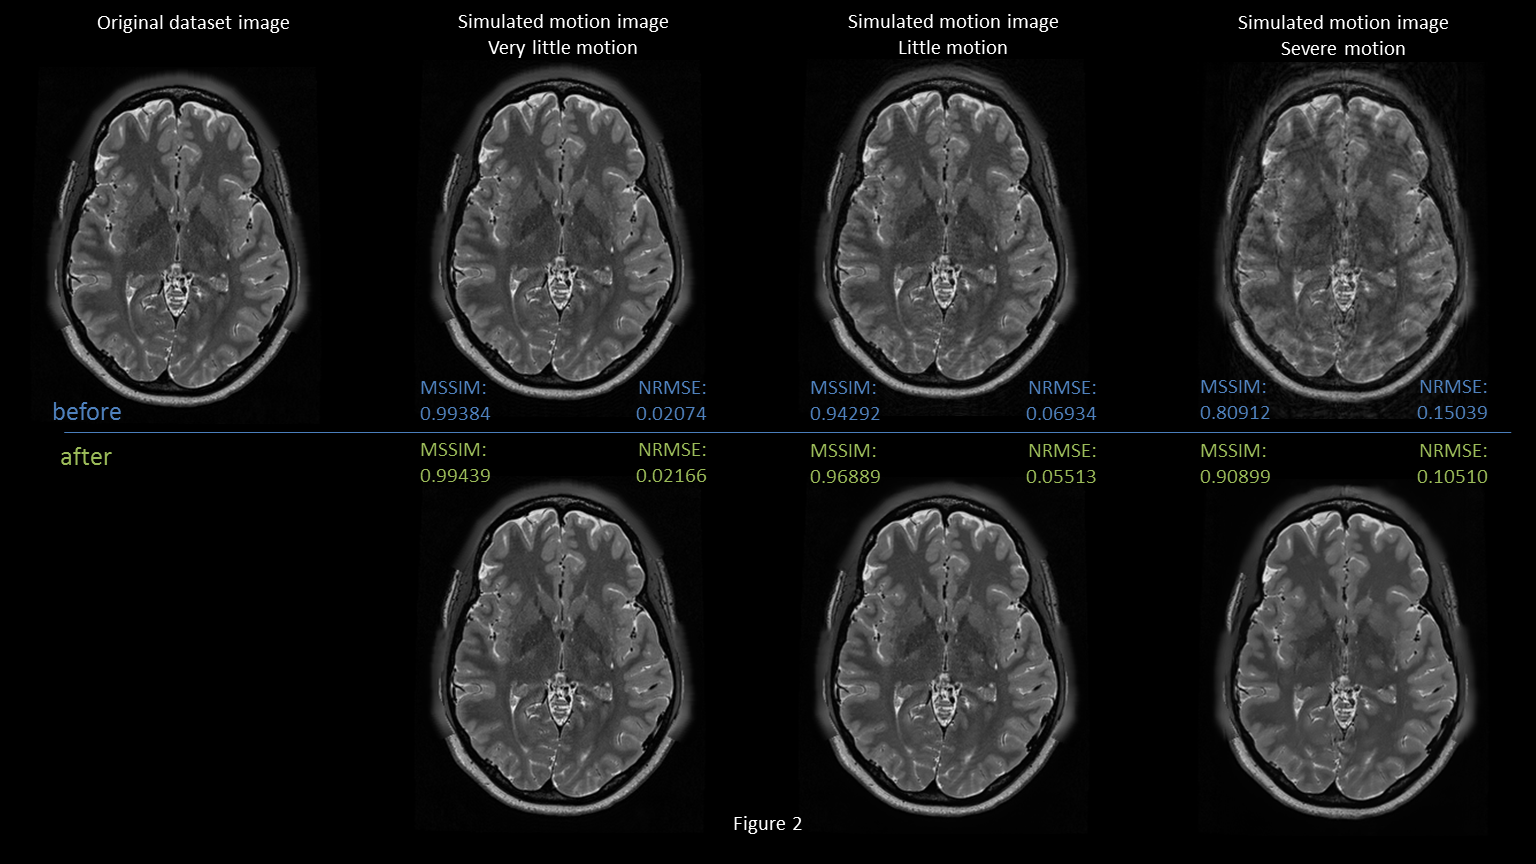
MR image comparison before and after Motion Compensation for a range of simulated motion.
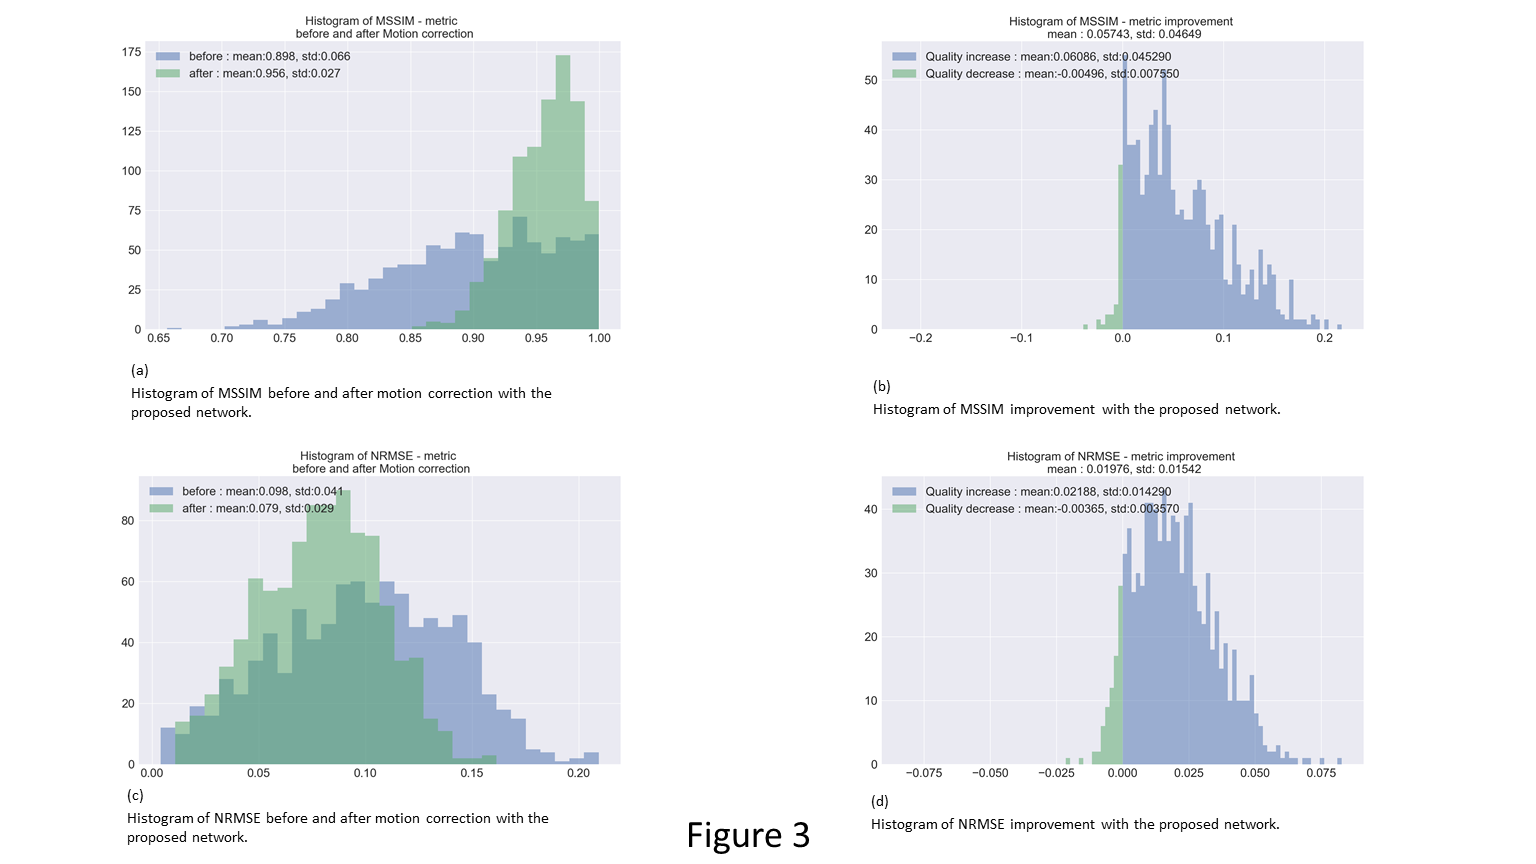
Distribution of quality metrics (MSSIM and NRMSE) before and after Motion Compensation. Figures a) and c) show the metric before compensation in Blue and after compensation in red. Figures b) and d) show the quality metric improvement.
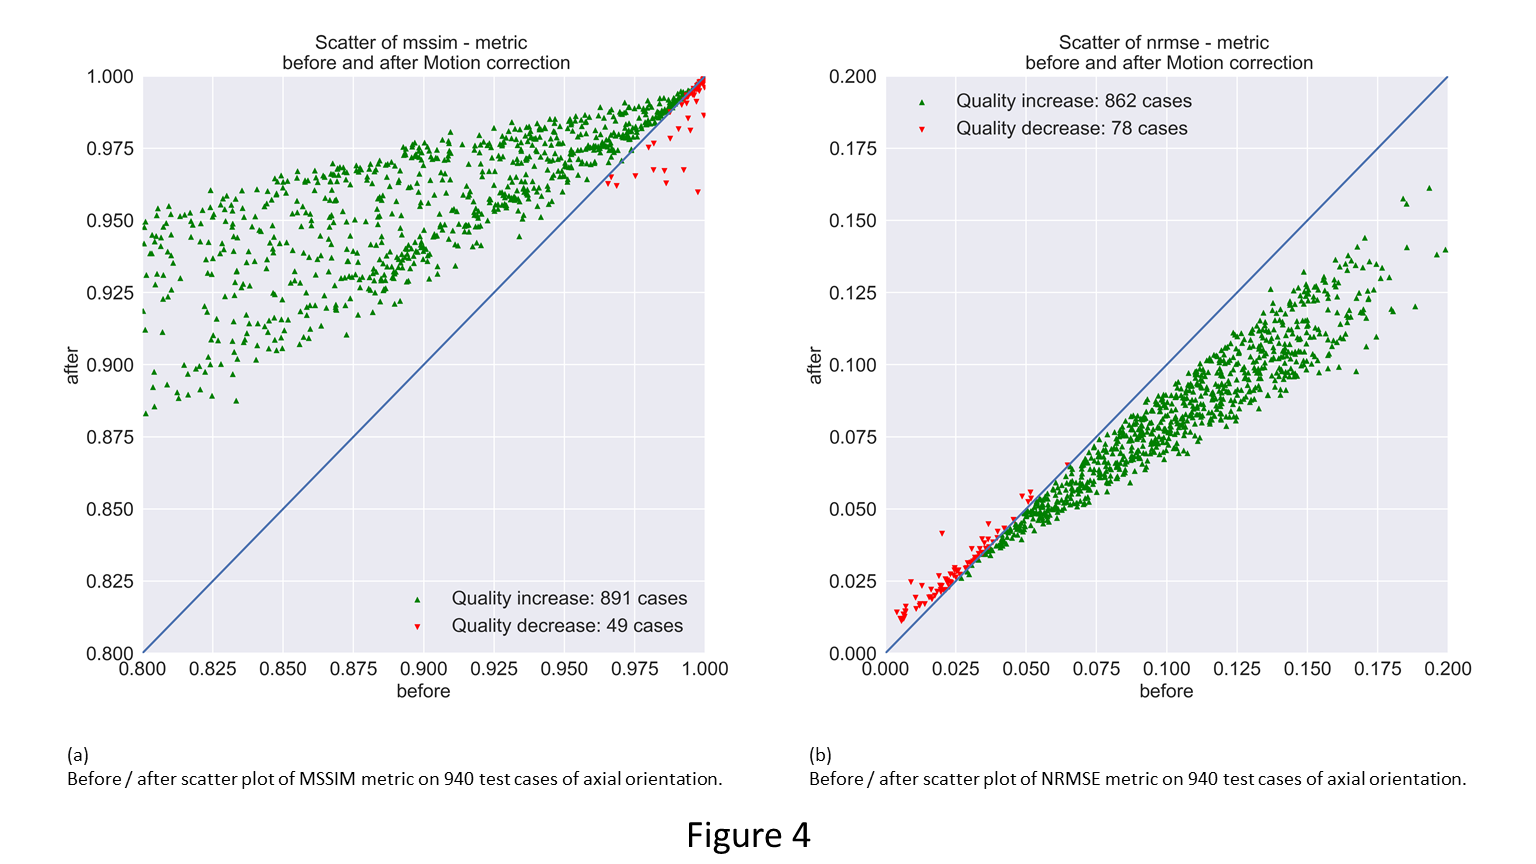
Scatter plot of Quality metric changes before and after motion compensation. In Green are all improvements in quality images. In Red, quality decrease, which occurs at initial high metric value.
Quality changes per metric