4077
Investigation of breast imaging SAR hotspot with posable human models1Toshiba Medical Research Institute USA, Mayfield Village, OH, United States
Synopsis
MR users are routinely instructed to eliminate large conducting loops in order to avoid skin/skin contact RF burns. Loops can be formed by skin folds, hands clasped (e.g. above head or on abdomen), hands touching thighs, or touching legs etc. Points of skin/skin contact are often associated with significant local SAR. Modeling with posable human models show that hands clasped skin/skin contact loops associated with prone breast imaging do not necessarily increase local SAR. This suggests that not all skin/skin contact situations are a patient safety concern.
Introduction
The number of breast MRI procedures is growing rapidly and it is important to investigate the possibility of RF burns and develop mitigations where necessary. A plausible burn condition occurs with clasped hands above the head where the skin/skin contact completes a large conducting loop through the arms and shoulders. It is theorized that skin/skin contact burns are the result of significant current flows across a restricted contact area resulting in ohmic heating. MR users are routinely instructed to avoid the formation of large conducting loops associated with skin/skin contact points either with pads or instructing the patient to not clasp hands. This abstract investigates the risks associated with clasped hands during breast imaging.Methods
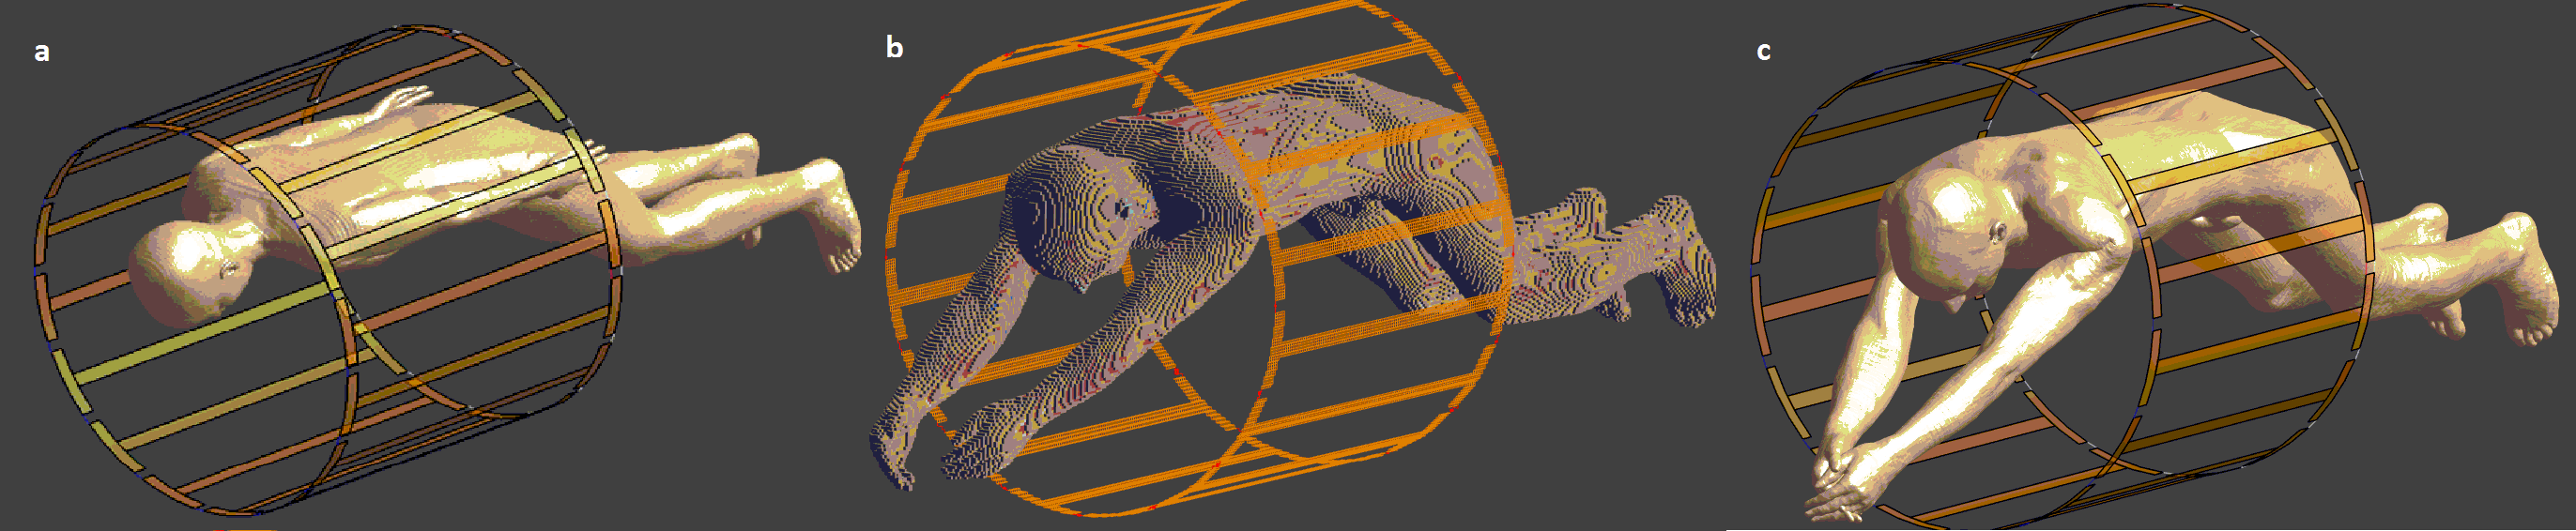
Numerical FDTD EM modeling was performed with software package Sim4Life (ZMT, Zurich, Switzerland). Posable human models Ella and Duke1 (ZMT, Zurich, Switzerland) were positioned in a generic whole body Tx coil based on ISO/TS109742 (16-rung high-pass birdcage, diameter 750mm, length 650mm. RF shield diameter 790mm, length 850mm3,4) with three common breast imaging configurations (Figure 1):
1) Arms at side with no hand/body skin contact
2) Arms above head with hands separated
3) Arms above head with hands clasped
The prone, feet first, human models were posed to reflect the abdominal curvature over a typical breast coil with a posterior elevation. The coil was driven in quadrature mode with 16 voltage sources in each end ring (ideal feed5). Modeling was done at both 1.5T and 3T by adjusting the frequency of all feeding voltage sources. The male model Duke, to test a substantially different body habitus than Ella, helped verify the Ella results were not unique.
Results
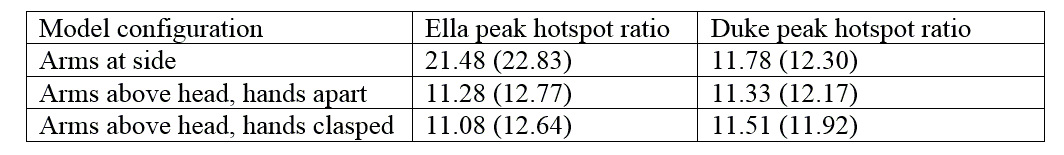
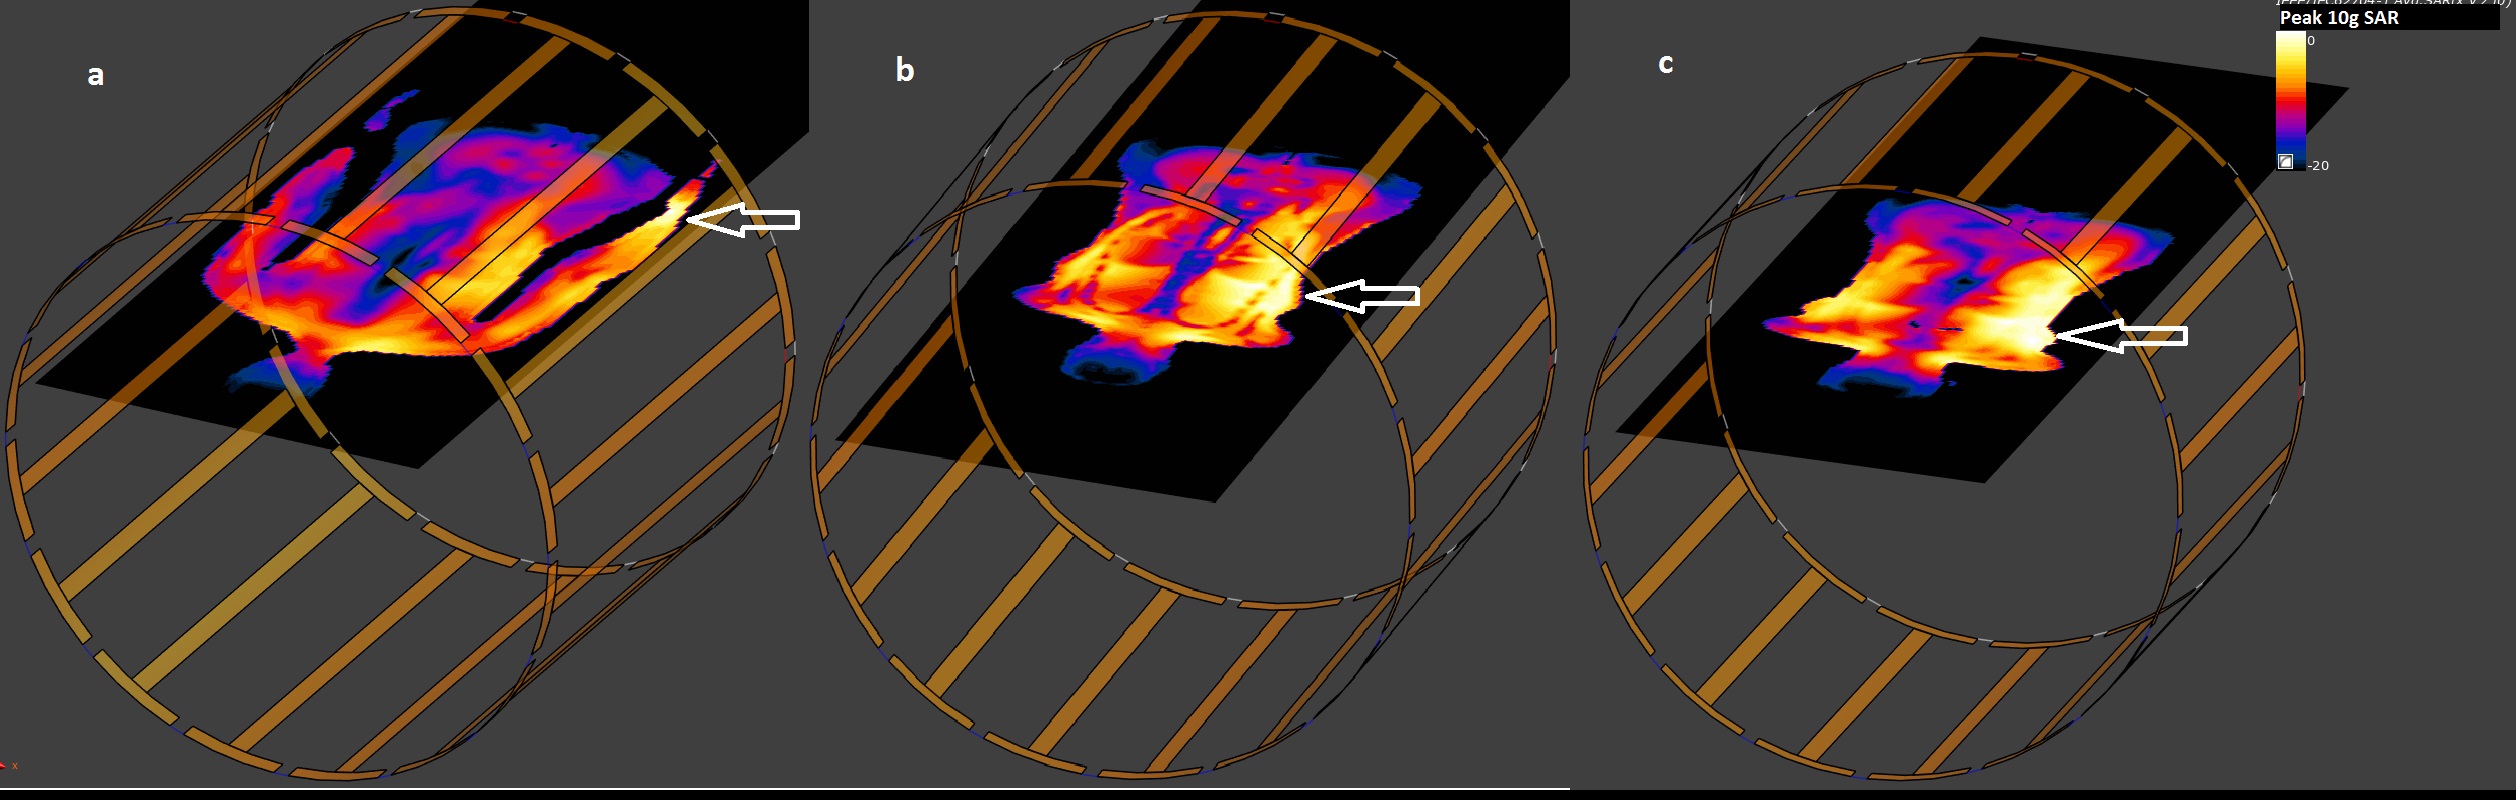
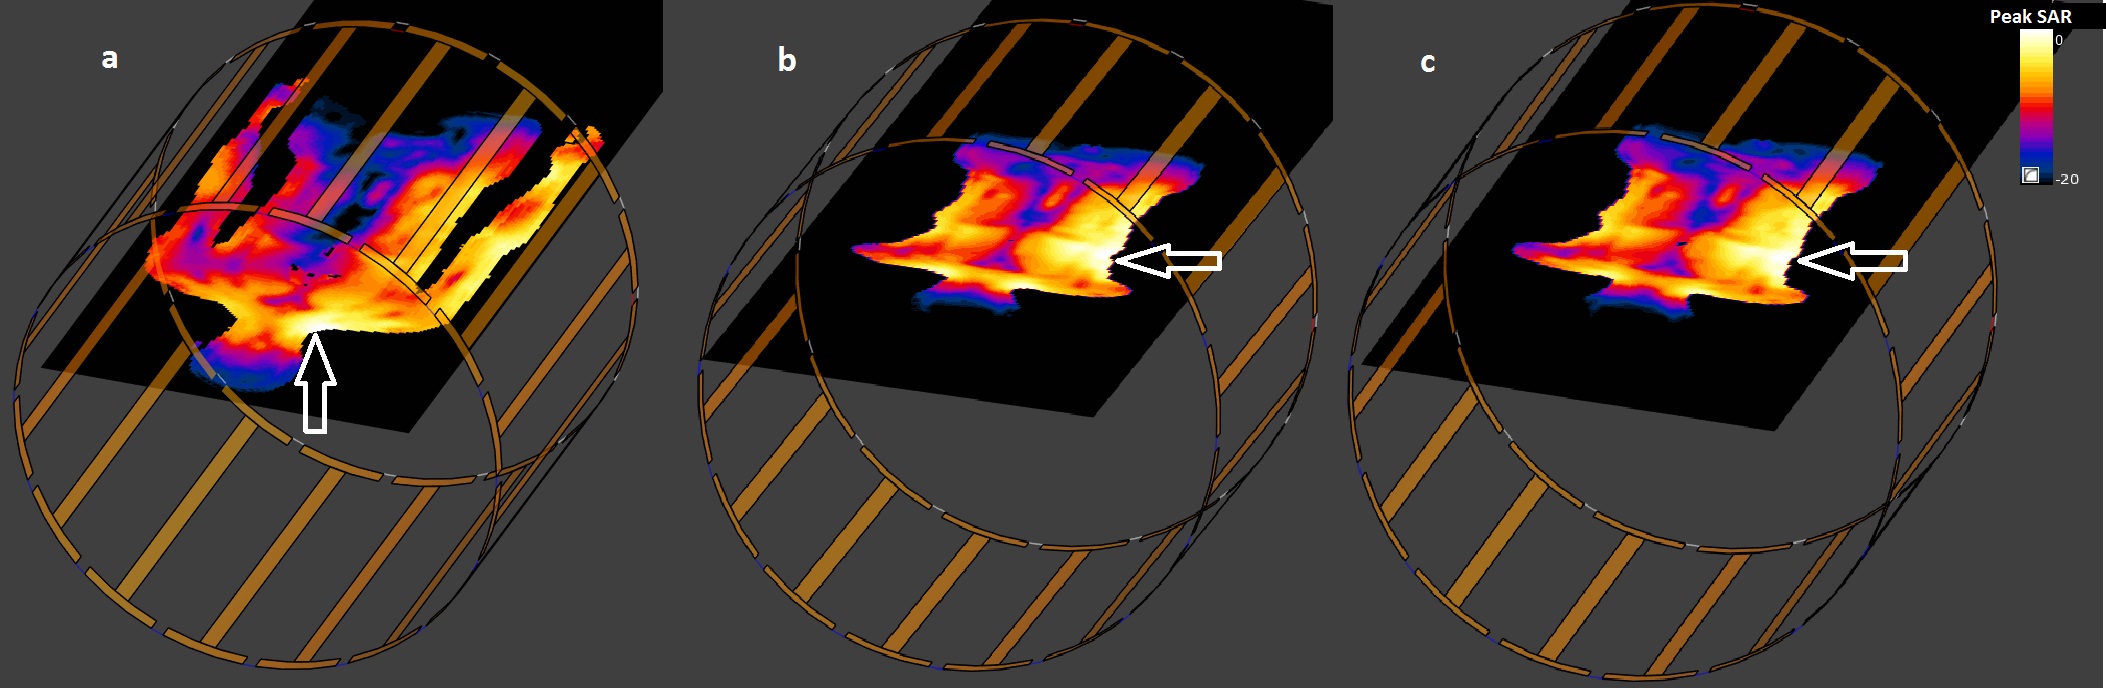
The 1.5T and 3T modeling results of peak local SAR hotspot ratio (peak 10g SAR/whole body averaged SAR) of Ella and Duke are shown in Table 1. Figures 2 and 3 show 10g SAR in the coronal slices where global peak values (shown by white arrows) are located corresponding to the three configurations shown in Figure 1 for Ella (1.5T) and Duke (3T) respectively. For both human models, results are similar between 1.5T and 3T. When arms are at side, peak SAR was found at Ella’s left wrist due to the proximity of the end ring capacitor. With arms raised above head and therefore outside of Tx coil, peak SAR was observed in the upper left side of Ella’s back, regardless of whether the hands were separated or clasped and were not significantly different. Duke’s peak SAR is in the neck/shoulder area (arms at side), and upper left side back (arms above head) (Figure 3).Discussion
Contrary to expectations, clasped hands above the head during breast imaging may lower local SAR levels when compared to arms at side. In this case, moving the arms away from the Tx coil can lower local SAR, even though clasped hands may inadvertently form a closed loop. No significant eddy currents appear in the loop, likely because it is mainly outside of Tx coil field exposure volume. The Duke results show that this result may be valid for a large range of body habitus, but only in the specific case of imaging at the breast landmark. However, the local SAR levels do not appear to reach significant levels in any of the configurations tested.Conclusion
Imaging at the breast landmark with hands above the head, hands clasped or not, may be a safer configuration than hands at side because the local SAR levels are either lower, or approximately the same, when the arms are positioned above the head.Acknowledgements
No acknowledgement found.References
1. Gosselin MC, Neufeld E, Moser H, et al. Development of a new generation of high-resolution anatomical models for medical device evaluation: the Virtual Population 3.0. Physics in Medicine and Biology. 2014; 59(18): 5287-5303.
2. ISO/TS 10974:2012 Assessment of the safety of magnetic resonance imaging for patients with an active implantable medical device. Geneva, Switzerland: International Organization for Standardization, 2012.
3. Murbach M, Neufeld E, Kainz W, et al. Whole-body and local RF absorption in human models as a function of anatomy and position within 1.5T MR body coil. Magn. Reson. Med. 2014; 71(2):839-845.
4. Murbach M, Cabot E, Neufeld E, et al. Local SAR enhancements in anatomically correct children and adult models as a function of position within 1.5T MR body coil. Prog Biophys Mol Biol. 2011; 107(3):428-433.
5. Liu, W., Collins, C.M. & Smith, M.B. Calculations of B1 distribution, specific energy absorption rate, and intrinsic signal-to-noise ratio for a body-size birdcage coil loaded with different human subjects at 64 and 128 MHz. Appl. Magn. Reson. 2005; 29: 5-18
Figures