4073
A robust experimental evaluation method for RF safety assessment of implants during 1.5 T and 3.0 T MRI1IT'IS Foundation, Zurich, Switzerland, 2ETH Zurich, Zurich, Switzerland
Synopsis
The accuracy of the traditional SAR-based evaluation is normally limited by the extreme spatial gradient of the induced SAR within the high-heating region. In this work, we propose a reconstruction evaluation method that improves upon the traditional method by using simple numerical modeling and image processing algorithm. The total combined uncertainty caused by the high SAR gradient and limited probe resolution is reduced dramatically from 3dB to 1 dB with the proposed method. A generic implant with helical conductor and single electrode is successfully validated against numerical simulations with less than 0.5 dB deviation at both 1.5 T and 3.0 T MRI RF frequencies.
Introduction
Traditional in vitro experiments generally entail a measurement of induced temperature rise or SAR at sampled locations in the vicinity of the implant by ways of temperature or dosimetry sensors 1,2, the sampled locations are typically within the regions of high heating, such as locations close to the interface between tissue and electrode contact. Due to the high spatial gradient of the induced temperature and SAR distributions (e.g., 2 dB/mm for temperature and 5 dB/mm for SAR is not uncommon), highly accurate positioning of the sensors (sub-mm accuracy) is required to obtain measurement values with reasonable experimental uncertainty. Based on the traditional SAR-based evaluation 1, we propose a complementary evaluation method that overcome the stringent requirement on the sensor positioning by using simple numerical modeling and image processing algorithms.Methods
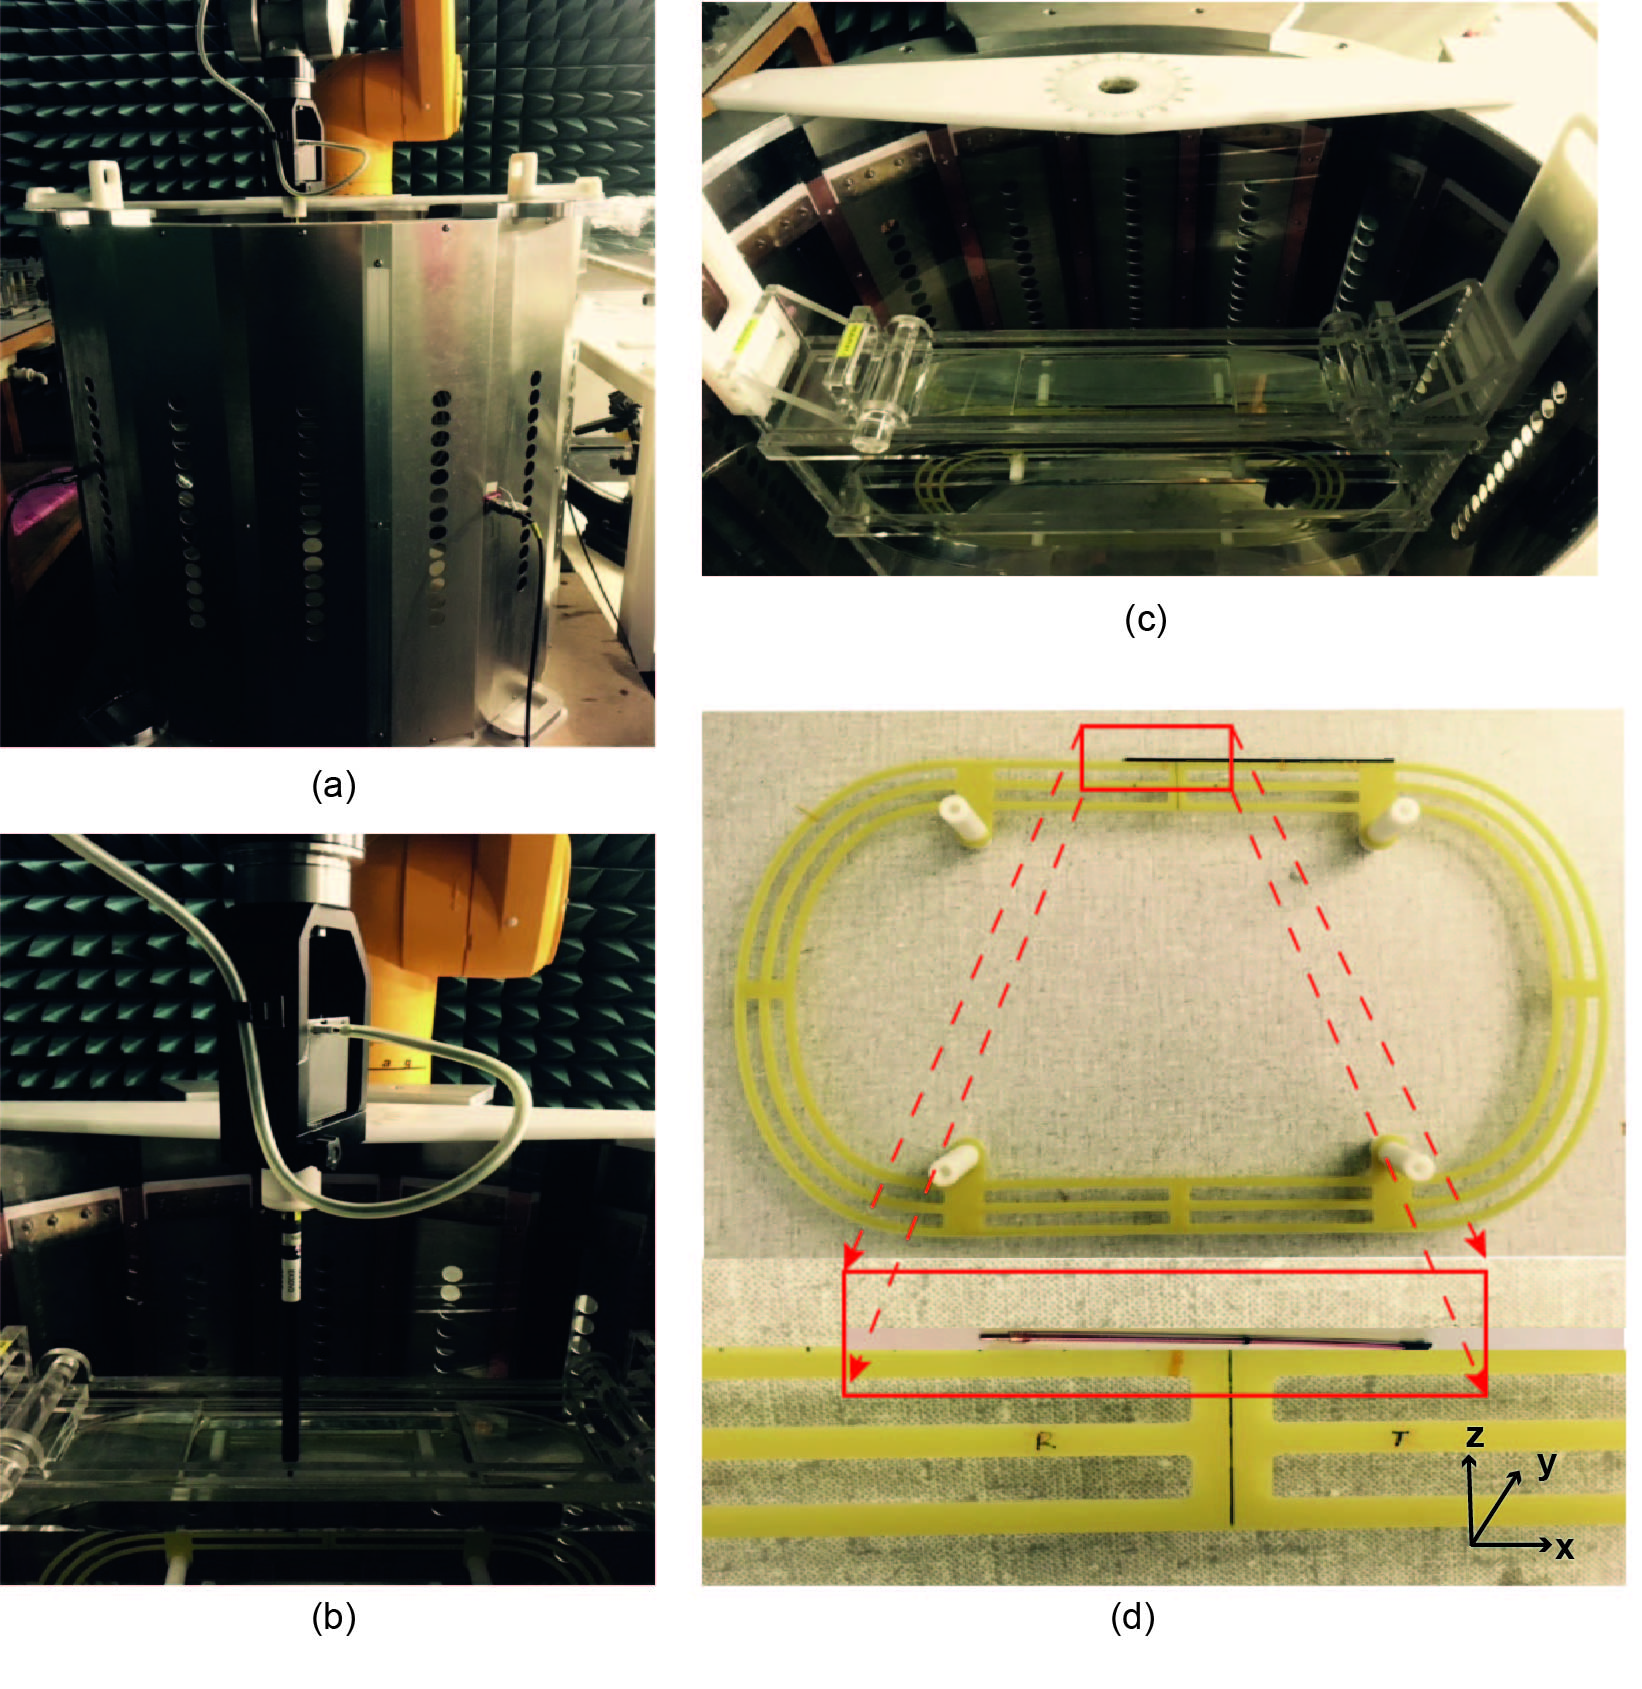
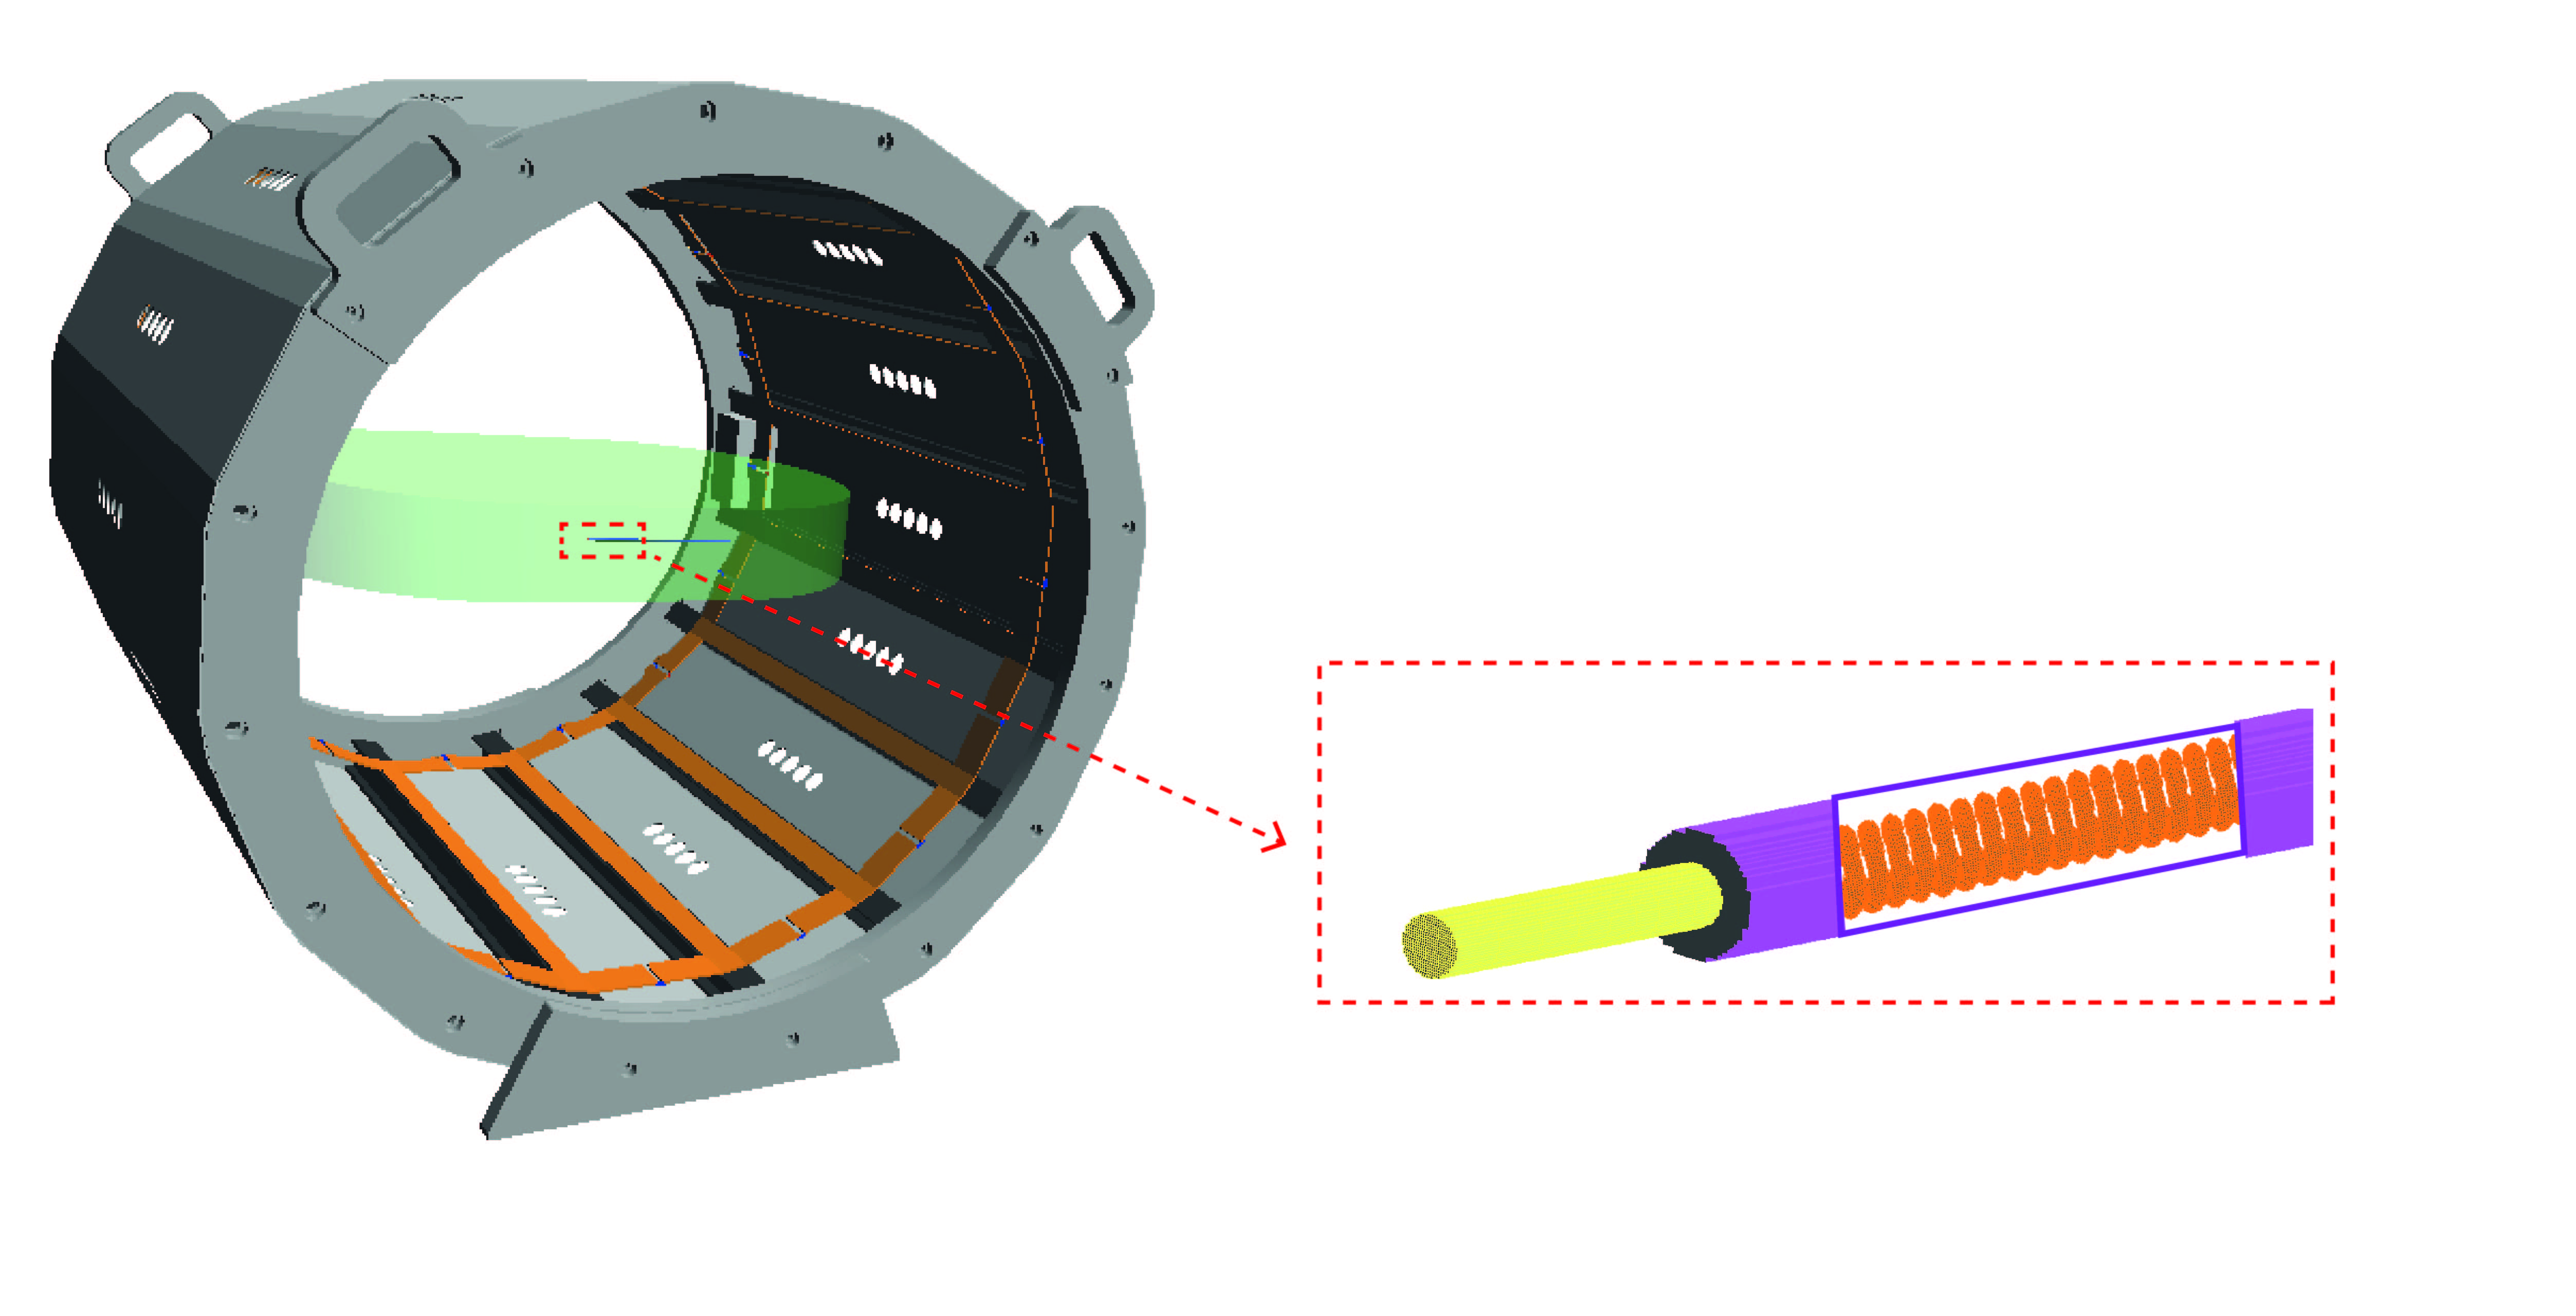
The implementation of proposed method is divided into three parts: 1) use an RF birdcage coil and elliptical phantom to provide a constant magnitude and phase electric field tangential along the implant as incident condition (figure 1 (a) and (c)). 2) high-precision robotic measurement system and data acquisition system with dosimetric probes are used to perform the RF-induced SAR measurement (figure 1 (b)). 3) a high-resolution induced SAR distribution of the electrode by numerically modeled (SARHR) is used as a feature-based registration of the induced SAR measured by the dosimetric probe (SARmeas). The co-registration is implemented as a simple translation of SARHR along the three cardinal axes by ∆ = (∆x, ∆y, ∆z), and down-sampling to the measurement locations, ri. In short, a linear least-square is applied to solve for the real-valued scalar, α, and the translation vector, ∆:
$$min_{\alpha, \triangle}\sum_{i=1}^b||\alpha SAR_{HR}(r_{i}+\triangle) - SAR_{meas}(r_{i})||^{2}$$
, where N is the number of sampled measurement points. An optimal solution set is determined by the set of α and ∆ that produces the minimum squared error. The power deposition of the electrode (P0) is calculated from a volume integral containing the -30 dB contour relative to the maximum deposition in SARHR. The estimated power deposition of the implant can be obtained from:
$$P_{est} = \alpha P_{0}$$
The results obtained from the proposed method is validated against a full-wave reference simulation as shown in Figure 2.
Results
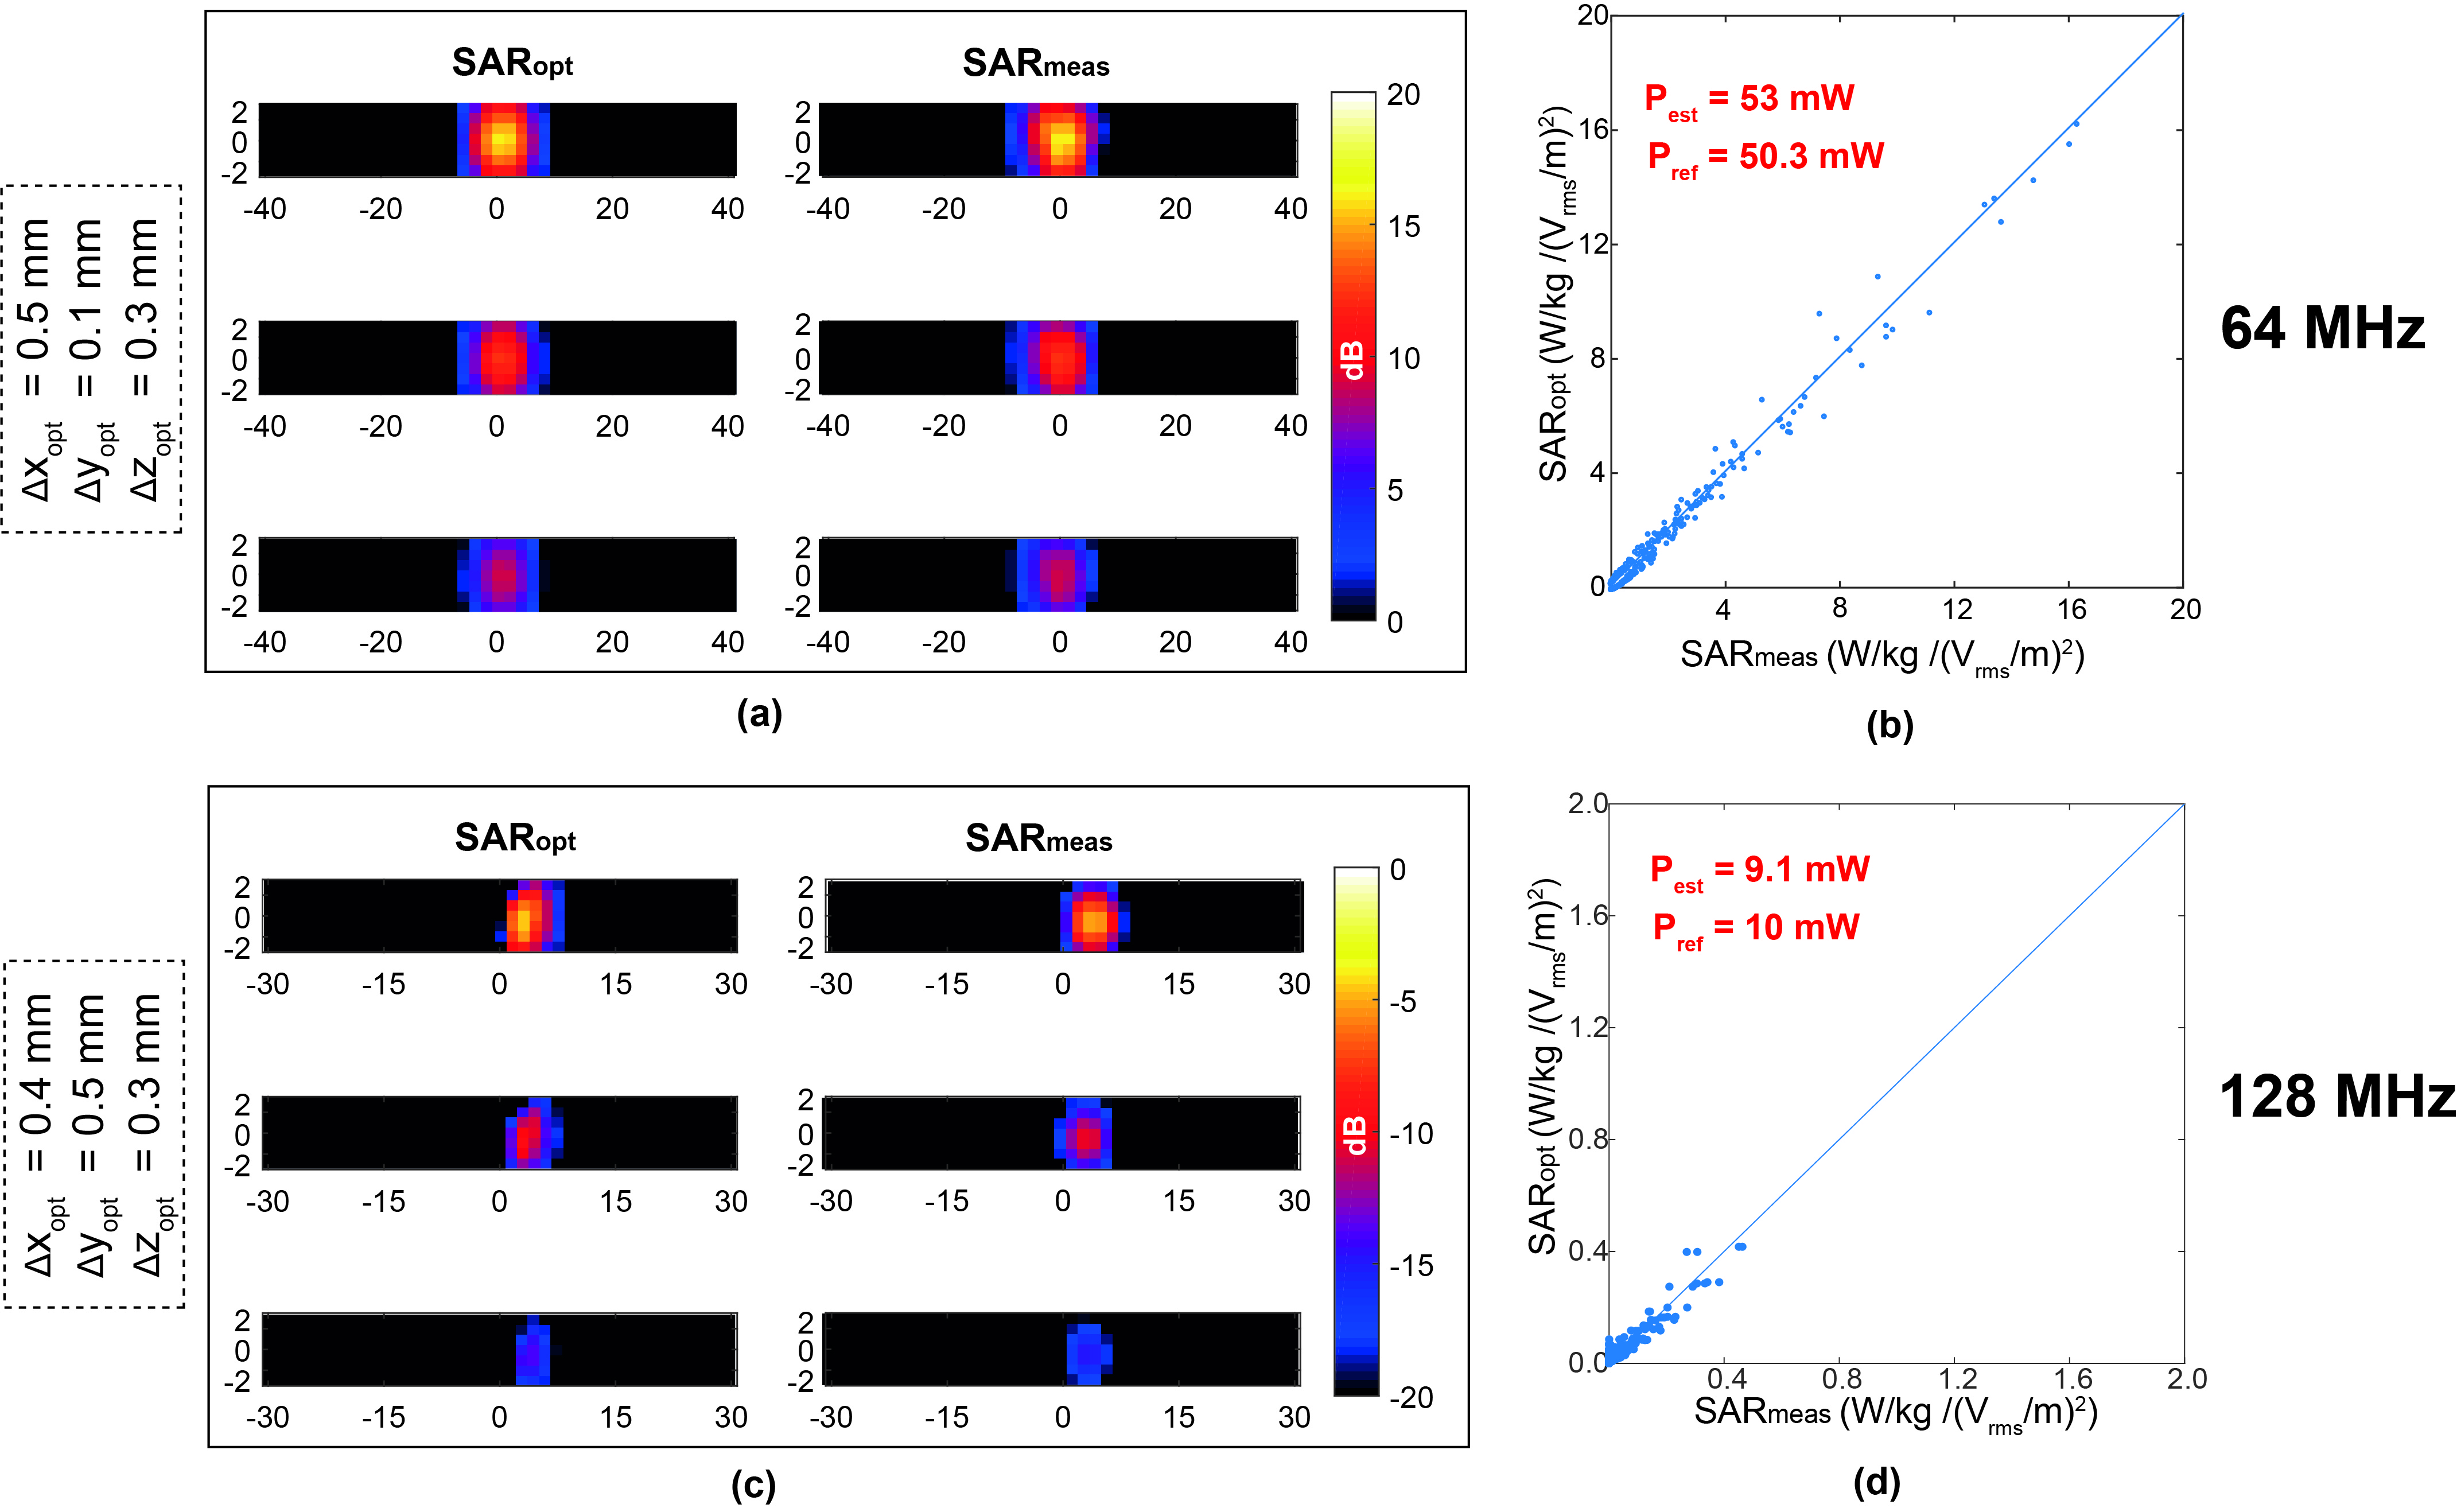
The proposed experimental method is applied to a 100 mm long generic helical implant sample shown in Figure 1(d) and the estimated power deposition (Pest) of the implant electrode is obtained for both 64 MHz and 128 MHz RF exposure. The uncertainty budget of Pest obtained with the proposed method and with the traditional method are 1 dB and 3 dB, respectively. Figure 3 shows the results of our evaluation for the helical implant sample at 64 MHz and 128 MHz RF exposure conditions. Figure 3(a) and (c) compared the SARmeas and SARopt 2D-distributions of the implant. Figure 3(b) and (d) show the pixel-to-pixel correlation of SARmeas and SARopt of Figure 3(a) and (b). Estimated power deposition obtained with proposed method, Pest , is compared with power deposition obtained from full-wave reference simulation, Pref .The deviation of the results is less than 0.5 dB for both 64 MHz and 128 MHz RF exposure conditions, which is well within the combined uncertainty budget.Conclusions
We proposed a method for the experimental assessment of RF-induced heating of an implant, by which a numerically-derived high-resolution induced SAR distribution over the region of high-heating is used to assist in the estimation of RF power locally deposited at the vicinity of the implant. The implant power estimation uncertainty obtained with our method is 1 dB --- significantly reduced from that of the traditional method, estimated to be 3 dB. The proposed method was successfully validated against full-wave computational electromagnetics simulations of the completely modeled implant and RF exposure conditions at 64 MHz and 128 MHz. The deviation between the power deposition estimated by the proposed method and full-wave simulations are less than 0.5 dB for both MRI frequencies.Acknowledgements
No acknowledgement found.References
1.Neufeld E, Kuhn S, Szekely G and Kuster N. Measurement, simulation and uncertainty assessment of implant heating during MRI. Phys Med Biol, 2009;13:4151-4169.
2.Ruggera P.S, Witters D.M, Maltzahn G.V and Bassen H.I. In vitro assessment of tissue heating near metallic medical implants by exposure to pulsed radio frequency diathermy. Phys Med Biol, 2003;48:2919-2928.
Figures