4072
MR based transfer matrix determination for a linear implant by joint estimation of the incident and scattered B$$$^+_1\hspace{2mm}$$$fields.1Center for Image Sciences, UMC Utrecht, Utrecht, Netherlands, 2Biomedical Image Analysis, Eindhoven University of technology, Eindhoven, Netherlands
Synopsis
Two findings that are steps towards fully MR-based TF determination in realistic situations are presented. Firstly, the transfer matrix, that is an extension of the transfer function (TF), can describe the RF response of an implant in a human model. Secondly, a joint minimization of the incident field and the scattered field, determined with the transfer matrix, can describe measured and simulated complex B$$$_1^+$$$ distributions in a phantom with a linear implant present. The TM and TF result from this minimization, which enables their determination from a single MRI acquisition with the implant in place.
Purpose
For RF safety assessment of elongated implants the transfer function (TF) has been introduced1, which describes the E-field enhancement at the tip of an implant due to an incident E-field. Contrarily to conventional TF determination methods1-3 that involve dedicated setups, a fully MR-based methodology has been presented where the TF is calculated from MR images4. Recently, this method was improved with the transfer matrix (TM)5 using standard RF coils without modifying the implant into a transmit-receive antenna. This opens up the opportunity for TF assessment of implants in realistic situations. However, for in-vivo TF determination two hurdles remain that are addressed in this study. A) it is investigated whether the TM concept is extendable from homogeneous phantoms to implants in a human tissue environment. B) the incident E-field and TM are determined from a single MR-acquisition with the implant in place offering the potential for TF determination under realistic circumstances.Theory
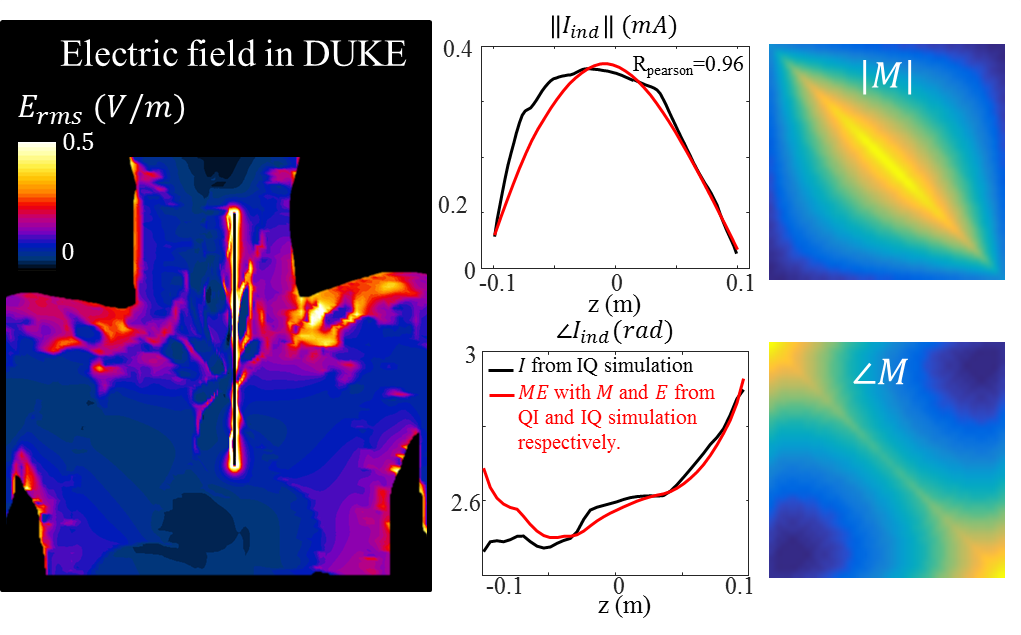
The transfer matrix, $$$M$$$, relates the induced current $$$I_{ind}$$$ in an implant to an incident electric field distribution, $$$E_{inc}$$$, on an implant trough, $$$I_{ind}=ME_{inc}$$$. Here $$$M$$$ can be parameterized with an attenuated wave model as $$$M(c_k)$$$ with $$$c_k$$$ being the set of three complex parameters, {$$$\sigma_{eff}$$$,$$$r$$$,$$$k$$$} characterizing the implant5. The incident magnetic field can be decomposed in SPherical And CYlindrical (SPACY) harmonics6, $$$f_n^m$$$,$$B_{1,inc}^+(\alpha_{mn})\approx\sum_{n=1}^{N}\sum_{m=-n}^{n}\alpha_{mn}f_n^m.$$From $$$B_{1,inc}^+$$$ the incident electric field can be calculated by a 1st order differentiation7. The scattered field due to the implant is subsequently calculated from the induced current (Ampere’s law) that is modeled by multiplying the incident E-field with the TM. For implants aligned along the z-axis, the total magnetic field is given by,$$\hspace{-50mm}B_{1,tot}^+(\alpha_{mn},c_k)=B_{1,inc}^+(\alpha_{mn})+B_{1,scatter}^+(\alpha_{mn},c_k)$$$$\hspace{-19mm}=B_{1,inc}^+(\alpha_{mn})+\frac{\mu_0I_{ind}(\alpha_{mn},c_k)\frac{e^{i\theta}}{2}}{2\pi\hspace{0.3mm}r},$$$$\hspace{-4mm}=B_{1,inc}^+(\alpha_{mn})+\frac{\mu_0M(c_k)E_{inc}(\alpha_{mn})\vert_{\vec{r}_{wire}}\frac{e^{i\theta}}{2}}{2\pi\hspace{0.3mm}r},$$$$\hspace{51mm}\approx\sum_{n=1}^{N}\sum_{m=-n}^n\alpha_{mn}f_n^m+\frac{\mu_0M(\alpha_{mn})\frac{1}{\sigma+i\omega\epsilon}(-2i\partial_x-2\partial_y)\alpha_{mn}f_n^m\vert_{\vec{r}_{wire}}\frac{e^{i\theta}}{2}}{2\pi\hspace{0.3mm}r},\hspace{8mm}(1)$$where $$$\theta$$$ is the azimuthal angle around the wire and $$$r$$$ is the distance to the wire. The differentiation provides the incident electric field from incident B$$$^+_1$$$ SPACY expansion.
Methods
A) Numerical simulations (Sim4Life, ZMT,Zurich) were performed to determine $$$M$$$ for a bare copper wire of 20cm in the aorta of the virtual family model Duke. Two independent RF exposures from a high pass birdcage coil at 1.5T (IQ and QI-feed) were used to verify that the TM correctly predicts the current distribution for various incident E-field distributions(these were determined seperately from simulations without an implant). The transfer matrix parameters $$$c_k$$$ were estimated by minimization of5,$$\textrm{arg}\min_{c_k\in\mathbb{R}}\|I_{ind}-M(c_k)E_{inc}\|,$$for the IQ-feed simulations. Subsequently, this TM was used to calculate the induced current for QI-feed and compared to the actual current. B) The main drawback of the previously presented method5 is the need for matching separate simulations to determine the incident, tangential E-field. Here we present an alternative. We estimate the TM and the incident E-field in a joint minimization approach from a simulated or measured distribution combined with the model of equation 1.$$\hspace{55mm}\textrm{arg}\hspace{-5.3mm}\min_{c_k\in\mathbb{R},\alpha_{mn}\in\mathbb{C}}\|B_{1,meas/sim}^+-B_{1,tot}^+(\alpha_{mn},c_k)\|.\hspace{40mm}(2)$$The parameters $$$c_k$$$ describing the TM of the implant follow from fitting $$$B_{1,meas/sim}$$$. The main advantage of this joint estimation is that no separate simulations or measurements of the incident electric fields are needed.
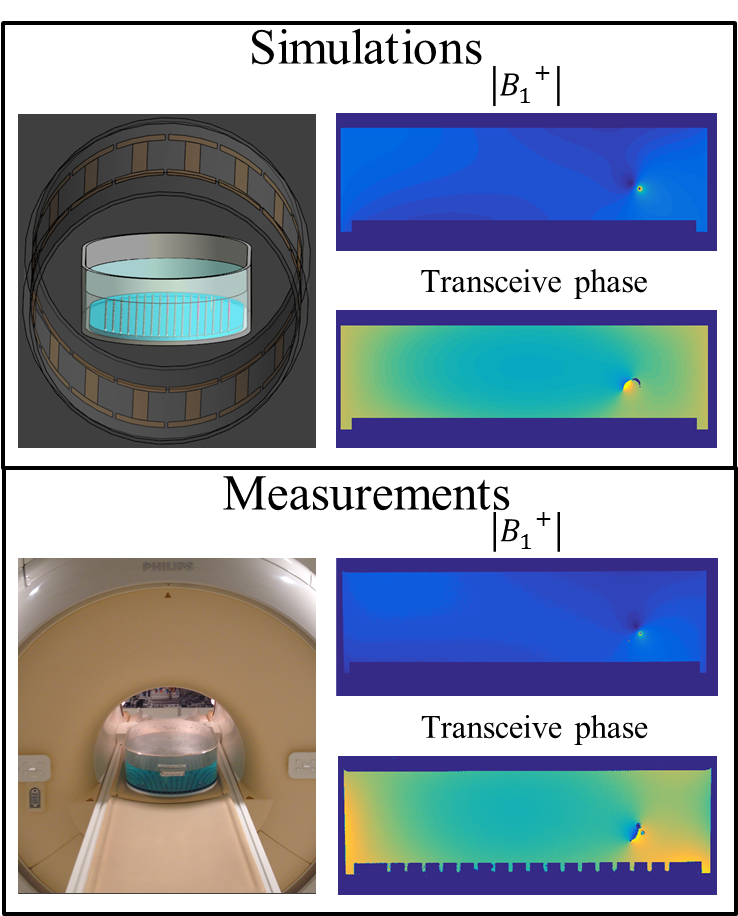
The distribution was measured with a multi-flip angle8 SPGR acquisition on a 1.5T MR system (Ingenia, Philips). The $$$B_1^+\hspace{0.1mm}$$$phase was considered to be half the transceive phase that is acquired with two multi-echo SPGR acquisitions with opposite gradient polarities9. Simulations are performed to validate the experiments. The measurement and simulation setup are shown in figure 2.
Results
Figure 1 shows the actual and predicted induced current in the implant. The agreement (Pearson correlation R=0.96) demonstrates that the TM can describe the implant response in a human subject reasonably well.
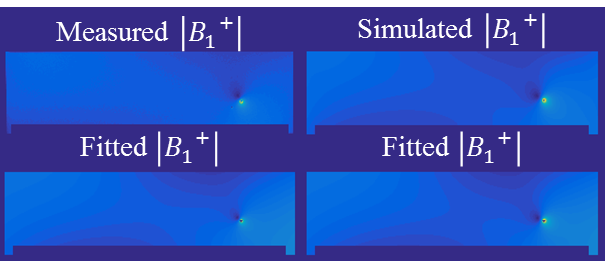
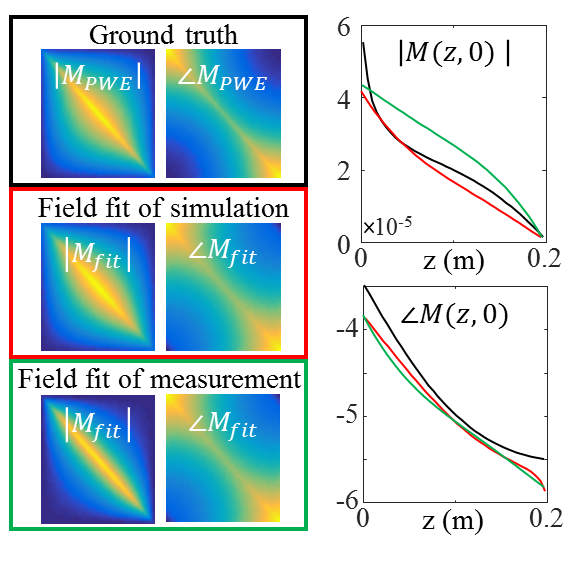
Figure 2 presents simulated and measured $$$|B_1^+|$$$ and transceive phase distributions for an implant in an elliptical phantom. From these distributions, with a region around the wire removed, the incident $$$B_1^+$$$ distributions can be estimated with a SPACY decomposition. (shown in figure 3). From the incident distribution the incident E-field is calculated7. The simulated E-field is shown for comparison. The coefficients from the SPACY decomposition of the background field are provided as initial guess in the joint minimization (equation 2) of the total field. The model is able to accurately fit the total measured and simulated field as shown in figure 4. From this fit the parameters that describe the TM and TF follow (figure 5).
Conclusion and discussion
The TM can correctly predict induced currents in a human subject. Measurement of the TM of an implant in a patient could become feasible by acquiring a $$$|B_1^+|$$$ map and by decomposing the incident field in SPACY harmonics and describing the scattered field using the TM. Using this method TF (and TM) assessment was demonstrated for a 20cm wire in a phantom. The performance of the SPACY decomposition in-vivo together with extensions of equation 1 to include implants not aligned with the z-axis are topics of future researchAcknowledgements
No acknowledgement found.References
1. Park SM, Kamondetdacha R, Nyenhuis JA. Calculation of MRI-induced heating of an implanted medical lead wire with an electric field transfer function. J. Magn. Reson. Imaging 2007;26:1278–1285. doi: 10.1002/jmri.21159.
2.ISO/TS 10974:2012(en). Assessment of the safety of magnetic resonance imaging for patients with an active implantable medical device.
3. Feng S, Qiang R, Kainz W, Chen J. A Technique to Evaluate MRI-Induced Electric Fields at the Ends of Practical Implanted Lead. IEEE Trans. Microwve Theory Tech. 2015;63:305–313. doi: 10.1109/TMTT.2014.2376523.
4. Tokaya JP, Raaijmakers AJE, Luijten PR, Bakker JF, van den Berg CAT. MRI-based transfer function determination for the assessment of implant safety. Magn Reson Med. 2017 Feb 5. doi: 10.1002/mrm.26613.
5. Tokaya JP, Raaijmakers AJE, Luijten PR, van den Berg CAT. MRI based RF safety characterization of implants using the implant response matrix: a simulation study. ISMRM proceedings 2017.
6. Sbrizzi A, Hoogduin H, Lagendijk JJ, Luijten P, van den Berg CAT. Robust reconstruction of B1+ maps by projection into a spherical functions space. Magn. Reson. Med. 2014;71:394–401. doi: 10.1002/mrm.24640.
7. Buchenau S, Haas M, Splitthoff DN, Hennig J, Zaitsev M. Iterative separation of transmit and receive phase contributions and B1+ -based estimation of the specific absorption rate for transmit arrays. Magn. Reson. Mater. Physics, Biol. Med. 2013;26:463–476. doi: 10.1007/s10334-013-0367-6.
8. van den Bosch MR, Moerland MA, Lagendijk JJW, Bartels LW, van den Berg CAT. New method to monitor RF safety in MRI-guided interventions based on RF induced image artefacts. Med. Phys. 2010;37:814–821. doi: 10.1118/1.3298006.
9. van Lier ALHMW, Brunner DO, Pruessmann KP, Klomp DWJ, Luijten PR, Lagendijk JJW, van den Berg CAT. B1+ Phase mapping at 7 T and its application for in vivo electrical conductivity mapping. Magn. Reson. Med. 2012;67:552–561. doi: 10.1002/mrm.22995.
10. Yarnykh VL. Actual flip-angle imaging in the pulsed steady state: A method for rapid three-dimensional mapping of the transmitted radiofrequency field. Magn. Reson. Med. 2007;57:192–200. doi: 10.1002/mrm.21120.
Figures