4070
Measuring dB/dt Induced Vibration in Medical Devices: Comparison of Discrete Frequencies Versus Use of a Variable-Frequency Chirp Pulse1The xMR Labs, Department of Physics and Astronomy, Western University, London, ON, Canada
Synopsis
Determining gradient field-induced vibration of a device typically involves multiple measurements at discrete frequencies. This study compares data from a frequency chirp to discrete frequencies in an effort to decrease testing time and obtain a larger range of information. Results confirm scaled displacement obtained through discrete frequency measurements and a frequency chirp matched for all measured frequencies.
Introduction
Time varying gradient fields can lead to eddy current induced vibration of conductive devices in an MR scanner1,2. Current ISO DTS 10974 recommends device vibration tests to be performed in an MR environment at discrete frequencies ranging 300-1500 Hz with maximal dB/dt exposure3. Considering vibration is scalable by dB/dt at a given magnetic field3, a linear frequency chirp may be able to replace discrete frequency measurements and allow for a full range of frequencies to be sampled quickly.Methods
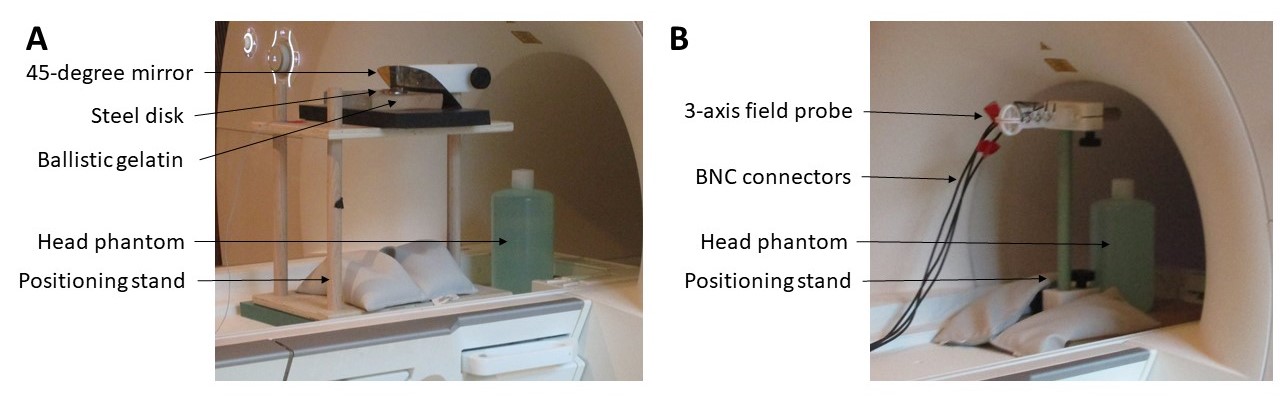
Experiments were performed at 3T (Siemens Prisma, Robarts Research Institute, Western University) using a steel disk with a 50 mm diameter and 3 mm thickness. The disk was positioned parallel to the scanner bed on a 2.5 cm block of synthetic ballistic gelatin (10% gelatin, Clear Ballistics, Fort Smith, AR) in a location in the bore measured to have a maximal dBy/dt (X=0, Y=+24 cm, Z=+30 cm). A coronal pulse sequence was used to generate 8 discrete tones at frequencies of 200-1500 Hz with gradient amplitudes ranging from 20-75 mT/m respectively (12800 Hz sampling rate for 3.2 seconds). In addition, the disk was also exposed to a 4.1 second linear frequency chirp from 200 to 2000 Hz at a constant amplitude of 15 mT/m. Vibration along the y-axis was measured with a Laser Doppler Vibrometer (OFV-505/5000, Polytec GmbH, Germany) positioned on a tripod at the edge of the scanner bed with the laser reflected off a 45-degree mirror and focused perpendicular to the edge of a steel disk (Figure 1A). To measure dB/dt, the disk was replaced by a 10-loop Faraday probe (5 cm diameter) and all pulse sequences were repeated (Figure 1B). All measured data (both vibration and field probe) were filtered with a Butterworth filter to remove low and high frequency noise. Discrete frequency data was filtered with a 100 Hz bandwidth centered around the driving frequency and the frequency chirp was filtered with a larger bandwidth of 100 to 2200 Hz. The peaks in the discrete frequency data were extracted and averaged using MATLAB (2016a) and the displacement was scaled to the measured dB/dt. The peaks from the frequency chirp were discretized into frequencies by dividing the exposure time linearly. The displacement obtained from the frequency chirp was scaled to the corresponding dB/dt and compared with the discrete frequency data. An exponential line of fit and 95% confidence interval for the displacement data was determined using MATLAB.Results
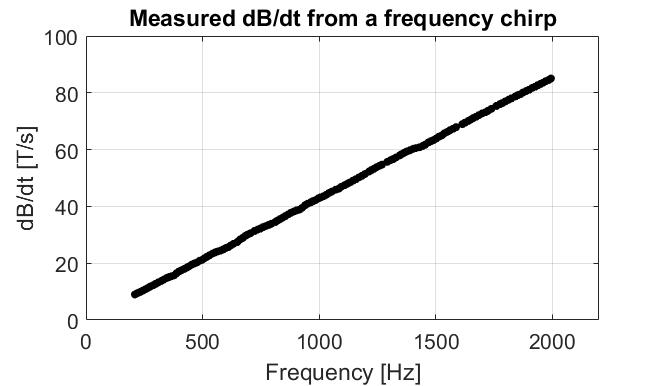
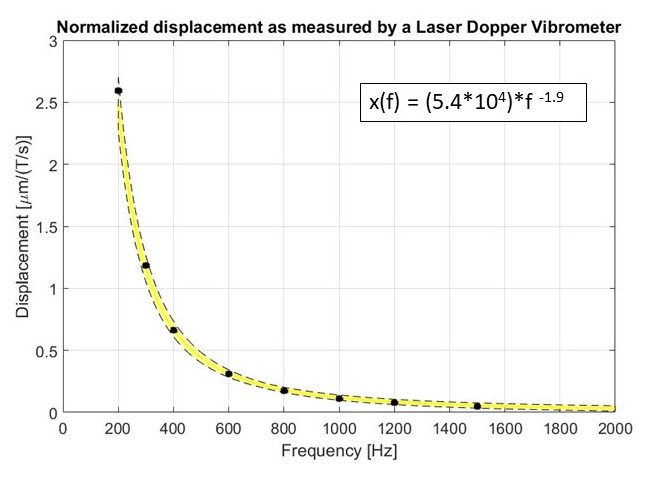
With a constant gradient amplitude, the dB/dt measured from a frequency chirp resulted in an increased dB/dt with increasing frequency from 200 to 2000 Hz as shown in Figure 2. Figure 3 shows the comparison between the scaled displacement obtained from discrete frequency measurements and a frequency chirp. All discrete frequency measurements fell within the 95% confidence interval of the frequency chirp showing no significant difference between the measurement methods. For all measurements, lower frequencies resulted in a larger displacement per dB/dt. The line of fit for the frequency chirp matched x(f) = (5.4E4)*f -1.9 where x(f) represents the scaled displacement in µm/(T/s) at a frequency, f, in Hz.Discussion
This study shows both discrete frequencies and a frequency chirp can be used to measure device vibration. By exposing devices to a large frequency range, potential device resonance will be evident allowing for an improved understanding of device vibration and potential safety considerations. A single chirp can decrease testing time and simultaneously cover the desired range of frequencies. The trade-off is an increased uncertainty for lower frequencies exposed to dB/dt ~ 5 times lower than the gradient maximum.Conclusion
Performing device tests at a maximum gradient amplitude may not be necessary as the displacement is scalable with dB/dt. A frequency chirp is beneficial to determine safe exposure levels for MRI conditional devices as it provides more information about device vibration within the specified frequency range.Acknowledgements
The authors would like to acknowledge the funding received from the NSERC Industrial Research Chairs Program, Ontario Research Fund Research Excellence Program, and Canadian Foundation for Innovation.References
1. Tarapacki, C, et al. Comparison of Laser Doppler Vibrometer and Accelerometer Measurements of MRI Gradient Field Induced Vibration in Conductive Materials. ISMRM; 2017.
2. Schaefers, G, and Andreas M. Testing methods for MR safety and compatibility of medical devices. Minimally invasive therapy & allied technologies; 2006;15(2): 71-75.
3. ISO, DTS 10970: Assessment of the safety of magnetic resonance imaging for patients with an active implantable medical device. Geneva, Switzerland: International Organization for Standardization; 2016.
Figures