4068
Measuring Radio-Frequency Induced Currents On Metallic Leads Using Parallel Imaging1CMRR, University of Minnesota, Minneapolis, MN, United States, 2Mortimer B. Zuckerman Mind Brain Behavior Institute,Columbia University, New York, NY, United States
Synopsis
We present a method that can be used to calculate the RF induced currents flowing on metallic leads. Proposed method relies on analyzing MR magnitude images (acquired by parallel imaging) , and modeling/matching the null location at the vicinity of the lead. The calculated induced current can be used to predict safe excitation scenarios and reduce heating around the lead.
Introduction
Electromagnetic fields in MRI induce RF currents on elongated metallic leads which may critically increase the temperature at the lead tip1. Various methods were proposed to estimate the magnitude of induced currents, based on MR image-artifact analysis2,3. These methods utilized tx/rx coils to acquire the images of the MR artifact. In order to utilize accelerated imaging methods (i.e parallel imaging) using multi-channel receiver coils is always favorable. In this work we present a method that can be used to measure the RF induced currents using multi-channel receiver coils and parallel imaging. We demonstrate the performance of the proposed method on a commercial Deep Brain Stimulation (DBS ) lead.
Methods and Results
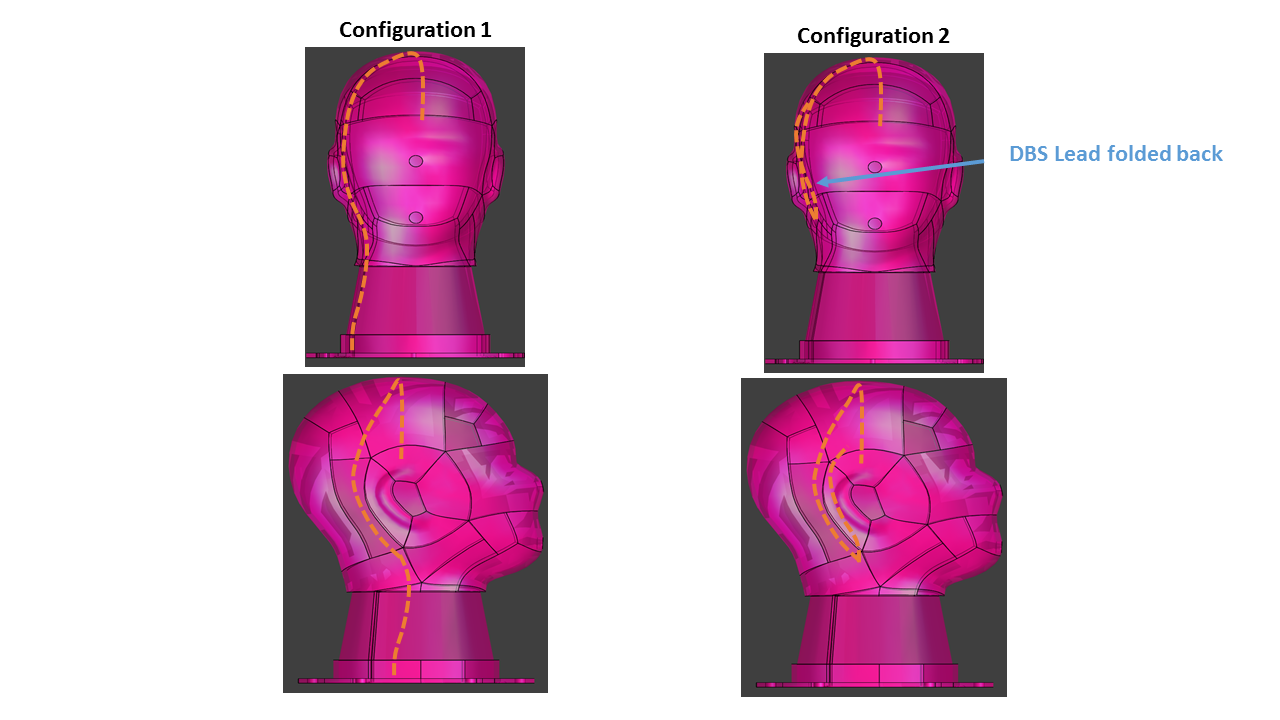
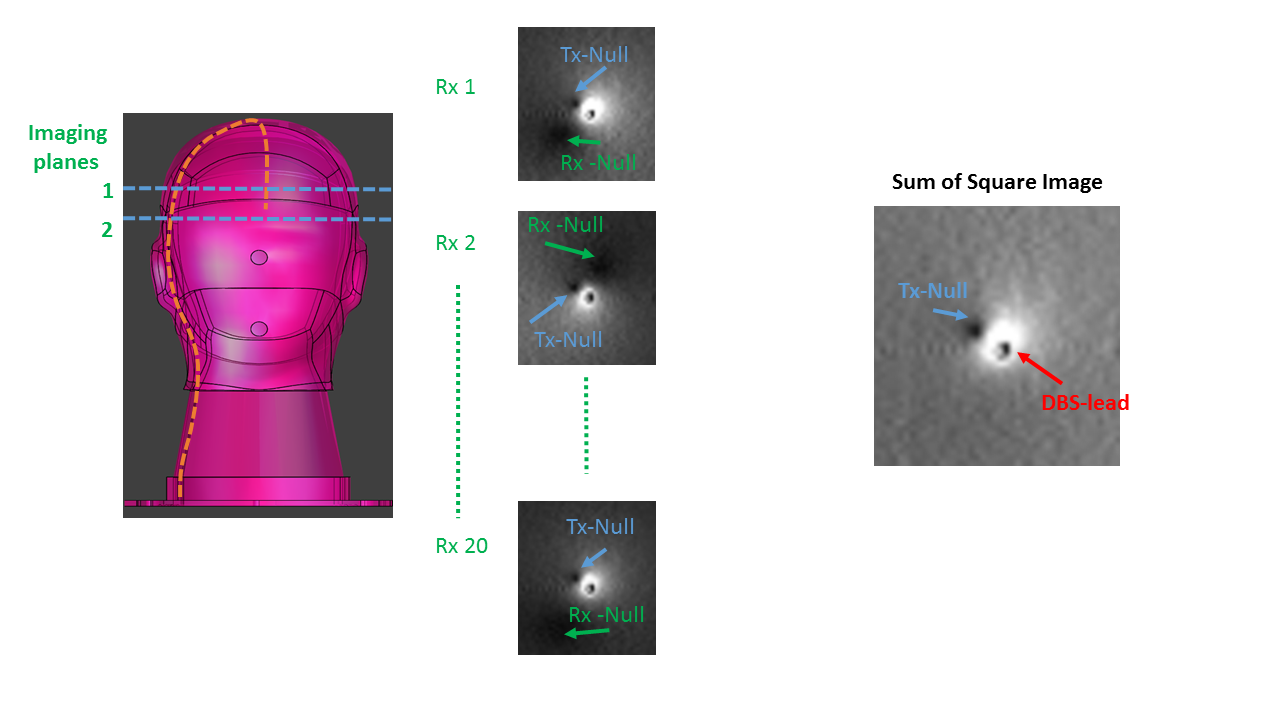
We performed imaging/heating experiments with a Siemens 3 T system using the Siemens 20 CH head receiver coil and the body transmit coil. We experimented with a DBS lead ( Directional Lead for Infinity™ DBS System, Abott,IL) that was placed in a head shaped phantom, filled with Hydroxyl Ethyl Cellulose (HEC) gel We experimented with two lead configurations to test our method (see Figure 1). We used the Siemens Gradient Echo sequence (Flip Angle=30o , TR=200 msec, TE=3.16 msec, 1x1x5mm) to acquire images around the lead tip. Grappa4 option was used to accelerate the image acquisition (acc=8). Figure 2 shows the imaging plane and the artifact around the lead acquired by the individual receiver channels. As it can be noticed, there exists two null-points in each individual image, one caused by the coupling to the receiver coil (rx-null), and the other one caused by the coupling to the body coil (tx-null). The location of the rx-null is different for each receiver channel due to different orientation, distance and coupling of each individual coil element. On the other hand, the location of the tx-null does not vary among images acquired by individual receivers. Therefore a simple square sum image obtained from all channels should yield a single null whose location depends on the body coil excitation but not the receive coil sensitivity. This observation enables us to solve the RF induced current by mathematically modeling the location of the null around the lead. Calculation also requires knowing the artifact free incident B1+ field generated by the body coil. That quantity was calculated by dividing the prescribed flip angle (for quadrature pattern only) with the integral of the RF pulse. For other excitation patterns, the flip angle was normalized by the mean image intensity acquired from a small window in a second imaging plane( artifact-free) located underneath the lead (see Figure 2).
We modeled the image intensity around the lead and solved for the amplitude of the induced current that generates a null location matching to the experimental image. We repeated this procedure for different excitation patterns (i.e Quadrature, Ch1, Ch2, Ch1+Ch2, Ch1-Ch2). Based on this data, we predicted a safe-excitation pattern (i.e optimal amplitudes and phases at the two channels of the body coil) which results in minimal induced current and heating at the tip.
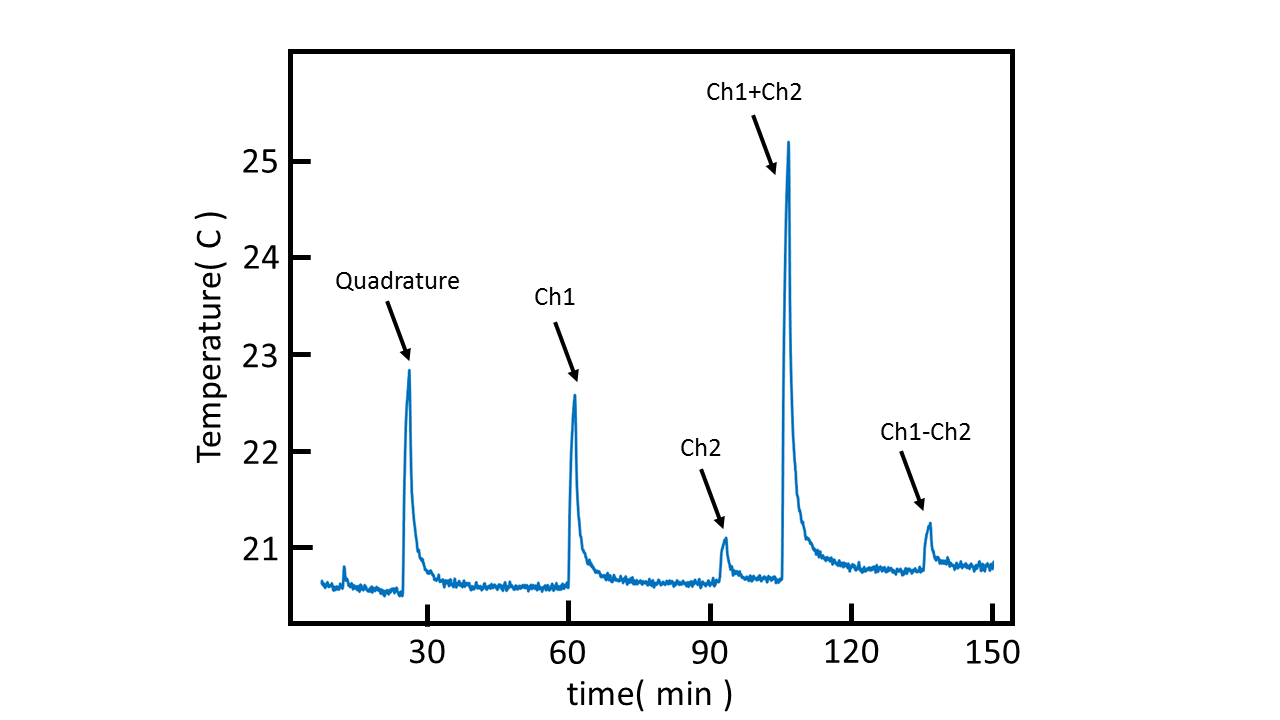
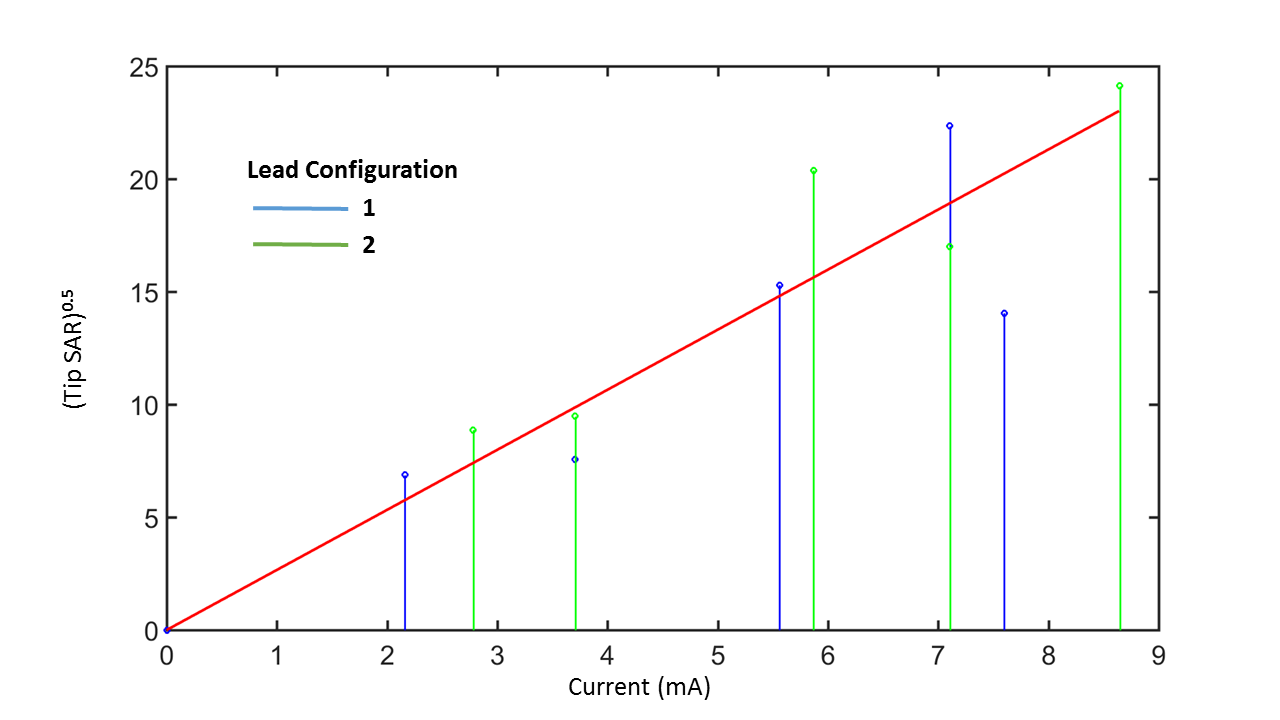
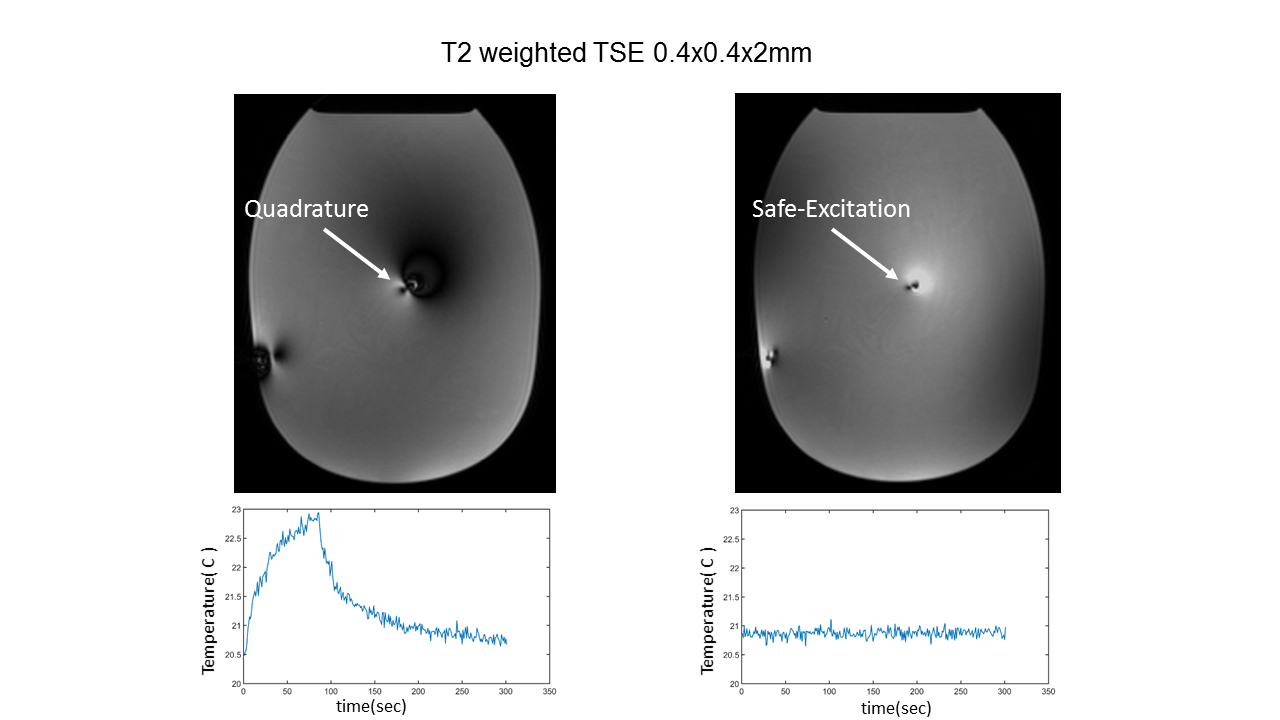
We performed RF heating studies with the Siemens T2 weighted -Turbo Spin Echo sequence(Flip Angle=[120o,150o], TR=[5000,6000] msec, Echo Train Length=15 ). We compared the induced current values with the square-root of SAR levels calculated from the rate of change of the tip temperature (dT/dt). Figure 4 shows the time series of the temperature caused by the different excitation patterns. Figure 5 shows the comparison of the square root of SAR measured from different excitation patterns and the magnitude of the currents predicted by our code. Finally, Figure 6 shows the images acquired by the safe excitation pattern and the observed temperature increase in comparison to the quadrature pattern. Note that the safe excitation pattern resulted not only in minimal temperature increase but also enhanced the visibility near the lead.(see Figure 6)
Discussions
We used a commercially available lead ( Directional Lead for Infinity™ DBS System, Abott,IL) to perform our experiments. The DBS lead was used in an off-label worst case scenario (i.e DBS electrode was disconnected from the extension lead/IPG device) to generate heating at the lead tip.
In this work, we did not attempt to model/mitigate the geometric image distortion around the lead. It may be meaningful to include the distortion effects in the analysis to improve the accuracy of locating the tx-null and calculating the induced current.
Conclusions
We present a method that utilizes multi-channel receiver coils and parallel imaging to predict RF induced currents on metallic leads. Proposed method can be used to calculate safe excitation patterns and to reduce RF heating at the lead tip.Acknowledgements
This work is supported by the NIH grants P41 EB015894,K99EB021173.References
1)Henderson JM, Tkach J, Phillips M, Baker K, Shellock FG, Rezai AR.Permanent neurological deficit related to magnetic resonance imagingin a patient with implanted deep brain stimulation electrodes for Par-kinson’s disease: case report. Neurosurgery 2005;57:E1063.
2)Griffin, G. H., Anderson, K. J.T., Celik, H. and Wright, G. A. (2015), Safely assessing radiofrequency heating potential of conductive devices using image-based current measurements. Magn. Reson. Med., 73: 427–441. doi:10.1002/mrm.25103
3)van den Bosch, M.R., et al., New method to monitor RF safety in MRI-‐guided interventions based on RF induced image artefacts. Med Phys, 2010. 37(2): p. 814-‐21.
4)Griswold, M. A., Jakob, P. M., Heidemann, R. M., Nittka, M., Jellus, V., Wang, J., Kiefer, B. and Haase, A. (2002), Generalized autocalibrating partially parallel acquisitions (GRAPPA). Magn. Reson. Med., 47: 1202–1210. doi:10.1002/mrm.10171
Figures