4065
Image-Based MR Safety Evaluation of Heating in Implanted Devices1School of Medicine, Case Western Reserve University, Cleveland, OH, United States, 2Imaging Institute, The Cleveland Clinic, Cleveland, OH, United States, 3Department of Biomedical Engineering, Hankuk University of Foreign Studies, Yongin, Republic of Korea
Synopsis
A thermal contrast agent with high sensitivity, thulium 1,4,7,10-tetramethyl-1,4,7,10-tetraazacyclododecane-1,4,7,10-tetraacetate (TmDOTMA-), was investigated for use in measuring the three-dimensional heating profile surrounding implantable devices with a goal of simplifying the safety assessment process. The technique was first demonstrated by imaging a vertical temperature gradient and was subsequently used to measure the heating profile surrounding a copper wire. We found gross agreement of this technique with concurrent fiber-optic temperature probe measurements, with the TmDOTMA- measurement complicated by a number of technical challenges and imaging artifacts.
Introduction
Heating of implanted devices under magnetic resonance imaging (MRI) carries a risk of damage to surrounding tissue, especially within the brain, which necessitates rigorous safety testing before such devices can be used in the MRI setting1,2. The dearth of MRI-approved devices negatively affects research as well as clinical diagnostic and treatment options. One reason devices remain unapproved for MRI use is that the safety validation process is time consuming and expensive, requiring many point temperature measurements with fiber-optic temperature probes (FOPs) which are ill-suited to evaluate the three-dimensional (3D) nature of the heating1,3. We aim to simplify the safety assessment of implanted devices by directly measuring the 3D heating profile of a brain implant using thulium 1,4,7,10-tetramethyl-1,4,7,10-tetraazacyclododecane-1,4,7,10-tetraacetate (TmDOTMA-), a thermally sensitive contrast agent, in an extension of previous work on an external device4.Methods
MRI images were acquired on a Siemens 7 tesla whole-body scanner (Magnetom; Siemens Healthcare, Erlangen, Germany). TmDOTMA- was obtained from Macrocyclics (Plano, TX) and prepared in two 40 mL vials to a concentration of 4 mM using normal saline. TmDOTMA- signal was acquired by a manual shift of the center frequency -106 ppm (-31.5 kHz) from water using a spoiled gradient echo (GRE) pulse sequence. A time bandwidth product of ≥5.4 was necessary in order to excite the sample over the experimental temperature range due to the relatively large temperature coefficient. Relative temperatures were calculated using the proton resonance frequency shift (PRF) shift equation:
$$\Delta T=\frac{\Delta\phi}{2\pi\gamma{B_{0}}cTE}$$
where $$$\Delta\phi$$$ is the difference in phase between two voxels, $$$\gamma$$$ is the gyromagnetic ratio, $$$B_{0}$$$ is the magnetic field strength, $$$c$$$ is the temperature coefficient of the frequency shift (water: -0.01 ppm / °C, TmDOTMA-: 0.6 ppm / °C), and $$$TE$$$ is the echo time in milliseconds5,6. Analysis performed in MATLAB (MathWorks, Natick, MA, USA).
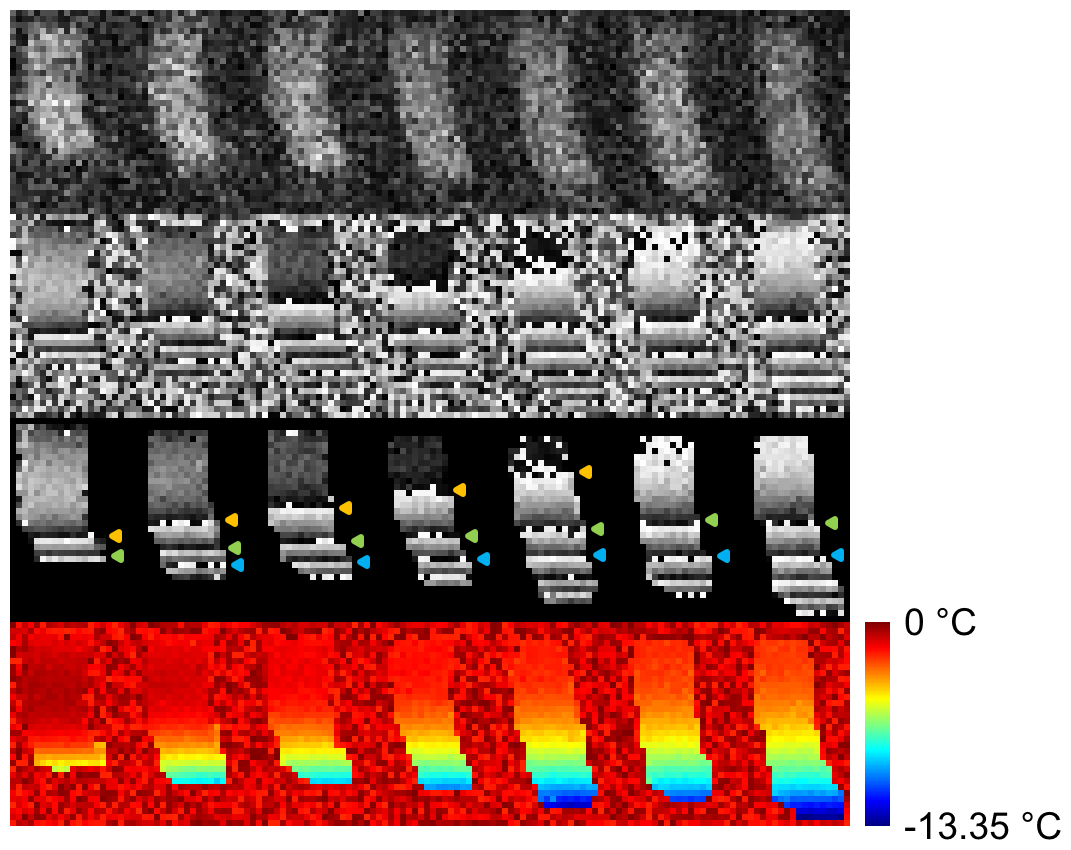
As a preliminary demonstration, a vertical temperature gradient was created in a single vial of TmDOTMA- by placing the vial on a block of chilled agar and making repeated scans while allowing the vial-agar system to thermally equilibrate. FOPs were placed at the top and bottom of the vial.
Subsequently, heating was induced in a 65 cm 22 AWG
solid-core copper wire placed in a TmDOTMA- vial while simultaneously
measuring the resulting 3D temperature profile. Heating
was accomplished using the radiofrequency (RF) pulse (500 ms pulse, 7.0 ms repetition
time, 22° flip angle, 128 averages,
30.6 min acquisition). Heating was limited to the tip of the wire, located
in the center of the solution, by leaving the original insulation on all but
the final 2 mm. Another TmDOTMA-
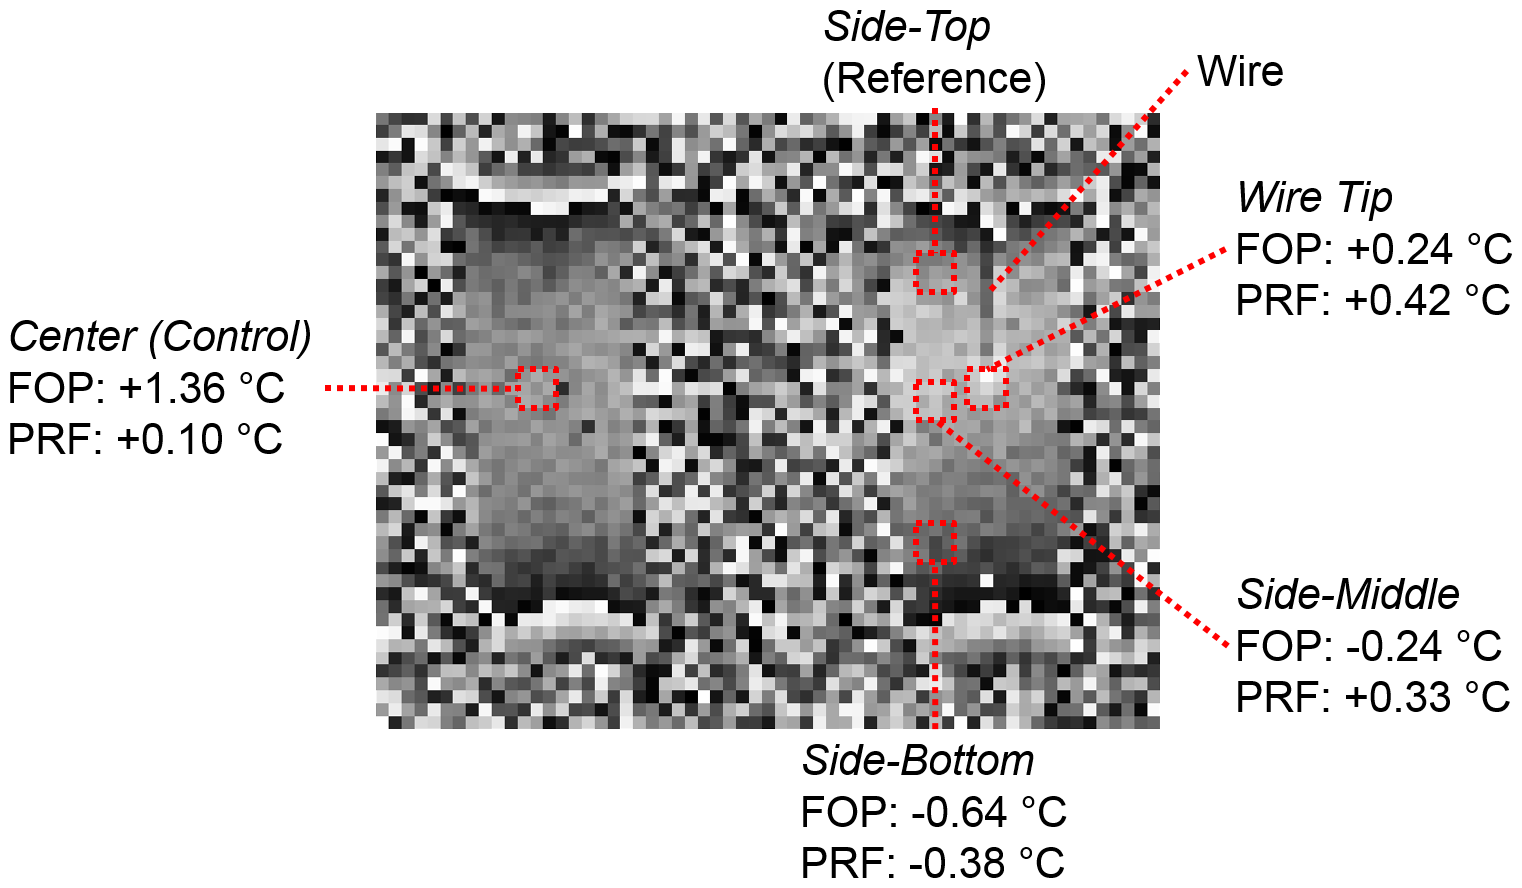
vial lacking a wire was also present as a control. In the experimental vial 4 FOPs were placed: side-top, side-middle, side-bottom, and wire tip. A single FOP was placed in the center of the
control vial.
Results
Using TmDOTMA- in aqueous solution we have successfully imaged both a thermal gradient (Figure 1) and the 3D heating profile induced by the MRI scan in a copper wire (Figure 2). Temperature readings obtained by concurrent measurement with FOPs are on the whole consistent, but not identical, to those calculated from the PRF shift equation.Discussion
While we successfully imaged gross and localized thermal gradients using TmDOTMA- there are a number of limitations to the data obtained thus far. First and foremost is a lack of quantitative agreement of the calculated temperature values with the FOPs. Second is the model system used, which is not suitable for robust characterization of the technique in human tissue. Finally, we did not use an implant with clinical utility. Ideally, a realistic head phantom and agar gel would be used along with a deep-brain stimulation electrode.
There are a number of factors which make this measurement challenging and require further investigation before the technique can be used for precision safety measurements. Most prominent are a number of artifacts, such as pi bounces (from changes in magnetic susceptibility) and signal pileup (known to occur with the GRE pulse sequence) at material interfaces, which convolute the TmDOTMA- signal. Additionally, the expense of TmDOTMA- necessitated the dilute and small-volume samples used here and contributes to a weak signal that limits flexibility in scanning parameters. The combination of complicating factors interferes with a quantitative analysis of the phase signal and makes correlation with FOPs challenging.
Conclusion
While TmDOTMA- shows promise as a temperature-sensitive contrast agent to investigate the 3D heating profile surrounding implantable devices there are a number of technical challenges to the measurement that need to be overcome before it can be used in the assessment of device safety.Acknowledgements
This work was supported by the Imaging Institute, Cleveland Clinic. Authors acknowledge technical support by Siemens Medical Solutions.References
- Finelli DA, Rezai AR, Ruggieri PM, et al. MR imaging-related heating of deep brain stimulation electrodes: in vitro study. AJNR Am J Neuroradiol. 2002;23:1795-802.
- Henderson JM, Tkach J, Phillips M, Baker K, Shellock FG, and Rezai AR. Permanent neurological deficit related to magnetic resonance imaging in a patient with implanted deep brain stimulation electrodes for Parkinson's disease: case report. Neurosurgery. 2005;57:E1063.
- Kahan J, Papadaki A, White M, et al. The safety of using body-transmit MRI in patients with implanted deep brain stimulation devices. PLoS One. 2015;10:e0129077.
- Graedel NN, Polimeni JR, Guerin B, Gagoski B, Wald LL. An anatomically realistic temperature phantom for radiofrequency heating measurements. Magn Reson Med. 2015;73:442-50.
- Ishihara Y, Calderon A, Watanabe H, et al. A Precise and Fast Temperature Mapping Using Water Proton Chemical Shift. Magn Reson Med. 1995;34:814-23.
- Pakin SK, Hekmatyar SK, Hopewell P, Babsky A, Bansal N. Non-invasive temperature imaging with thulium 1,4,7,10-tetraazacyclododecane-1,4,7,10-tetramethyl-1,4,7,10-tetraacetic acid (TmDOTMA-). NMR Biomed. 2006;19:116-24.
Figures