4063
Torque abnormality of Ti alloy in a static magnetic field1Faculty of Health Sciences, Hokkaido University, Sapporo, Japan, 2Graduate School of Health Sciences, Hokkaido University, Sappro, Japan, 3Graduate School of Engineering, Tohoku University, Sendai, Japan
Synopsis
Ti alloy has been introduced for medical implants to reduce MRI artifacts for its lower susceptibility than the preceding material of Elgiloy. The magnetic torque of metallic materials theoretically increases with an increase in the susceptibility. However, it was reported that the torque of cerebral aneurysm clips was comparable for both materials. In this study, we accurately measured the torque of Elgiloy and Ti alloy rods in an MR scanner and found that the small susceptibility anisotropy of Ti alloy rod causes a torque that is more than 100 times of the value expected from the conventional torque theory.
Purpose
Co-Cr-Ni alloy (Elgiloy) has been used as a material for MR-safe implantable medical devices. Ti alloy has been introduced for those devices to reduce MR artifacts for its low susceptibility (approximately 1/10 that of Elgiloy). The torque applied to metallic materials in a static magnetic field theoretically increases with an increase in the susceptibility of the material. However, a visual inspection study reported the torque applied to cerebral aneurysm clips was comparable for both materials.1 To confirm the results of this visual inspection study, we accurately measured the torque applied to Ti alloy and Elgiloy rods. Subsequently, the susceptibility of each rod was calculated from the torque value using the conventional torque theory. These values of susceptibility were compared to the susceptibility measured from susceptometer to understand the discrepancy between the comparable torques of the materials with large differences in susceptibility.Materials and Methods
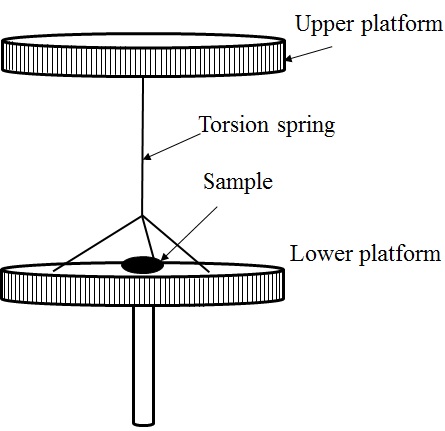
The torque applied to the Elgiloy and Ti alloy (Ti-4Al-6V) rods (3 mm diameter, 20 mm length) were measured using a torque measurement apparatus (Fig. 1) placed in the center of a 3-T MRI scanner (MAGNETOM Prisma, Siemens). The torsional angle between the upper and lower platforms was obtained at every angle of the upper platform from 0° to 360° changed by 20° step. The torque values for the torsion spring (τ) were then calculated from the torsional angle. The plot (torque waveform) of τ versus the lower platform angle ―the direction of the long axis of the rod― was obtained. Since the lower plastic platform showed torque, we measured the same plot without a sample. To separate the torque waveforms of the rod and the lower platform, the obtained torque waveform was fitted using the method of least squares. Then the maximum torques of each rod ($$$\tau_{max}$$$) were obtained from the waveform of the rod. The susceptibility of each rod ($$$\chi_{\tau}$$$) was calculated from $$$\tau_{max}$$$ using the following conventional torque theory:
$$$\tau_{max}=\frac{B_{0}^{2}}{\mu_{0}}\times\frac{\chi_{\tau}^{2}}{4}\times{V}$$$ (1),
where B0 is the static magnetic field strength, $$$\mu_{0}$$$ is the permeability of vacuum (4π×10-7 H/m), and V is the volume of the rod. The susceptibility ($$$\chi_{m}$$$) of each material was measured by using a susceptometer (Magway, Sherwood scientific).
Results and Discussion
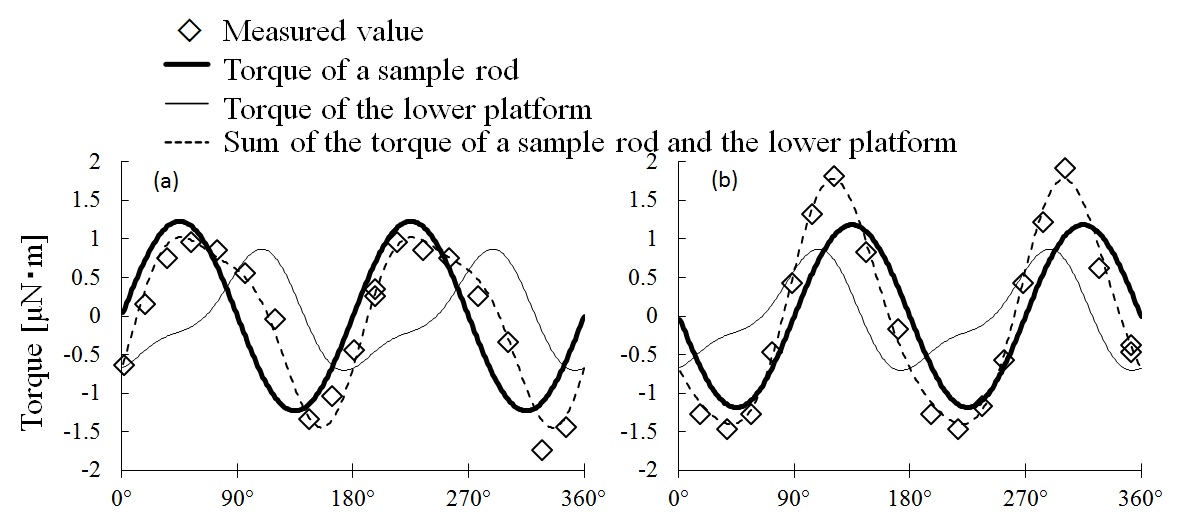
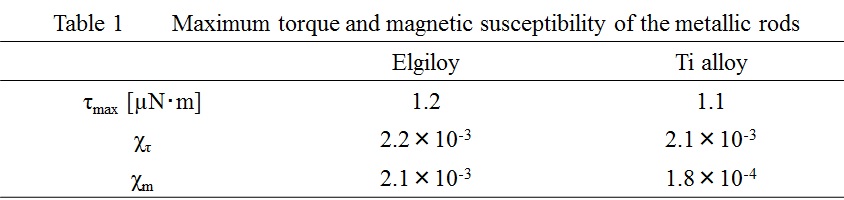
The $$$\tau_{max}$$$ of the Elgiloy rod was measured at 1.2 μN・m. This value yielded $$$\chi_{\tau}$$$ as 2.2×10⁻³ (SI volume unit), which agreed with the $$$\chi_{m}$$$ (2.1×10⁻³) obtained from the susceptometer (Table 1). This proves the accurate measurement of the torque in this study. Although the spectrometer measured the $$$\chi_{m}$$$ of the Ti alloy as 1.8 ×10⁻⁴ which is 1/12 of the $$$\chi_{m}$$$ of Elgiloy, the $$$\tau_{max}$$$ of the Ti alloy rod showed an abnormal value of 1.1 μN・m which was almost equivalent to the $$$\tau_{max}$$$ of the Elgiloy rod (Table 1). These comparable results of $$$\tau_{max}$$$ of Elgiloy and Ti alloy agreed with the visual inspection study.1 Interestingly, the phase of the torque waveform of the Ti alloy rod was shifted 90° from that of Elgiloy rod (Figure 2), which reflects the evidence of free suspension of each rod in an MR scanner; the long axis of the Ti alloy rod was perpendicularly oriented to the static magnetic field, while that of the Elgiloy rod was oriented parallel to it. This evidence indicates the existence of the susceptibility anisotropy in Ti alloy. The abnormally large value of $$$\tau_{max}$$$ of the Ti alloy rod could be explained by incorporating the susceptibility anisotropy effect into Eq. 1, given by:
$$$\acute\tau_{max}=\frac{B_{0}^{2}}{\mu_{0}}\times{\chi_{n}}(\frac{\chi_{n}}{4}+r)\times{V}$$$ (2),
where $$$\chi_{n}$$$ is the susceptibility along the short axis of the rod, and r is the anisotropy index of susceptibility given by:
$$$r=1-\frac{\chi_{tr}}{\chi_{n}}$$$ (3),
where $$$\chi_{tr}$$$ is the susceptibility along the long axis of the rod. Substituting the measured values of $$$\tau_{max}$$$ (1.1 μN・m) and $$$\chi_{m}$$$ (1.8×10⁻⁴) of the Ti alloy rod into $$$\acute\tau_{max}$$$ and $$$\chi_{n}$$$, respectively in Eq. 2, r was calculated as 0.007. Therefore, the abnormally large torque of the Ti alloy rod (140 times larger than the expected value from the conventional torque theory (Eq. 1)) was explained by the existence of a small (approximately 1%) difference in the directional susceptibility between the short and long axes of the rod.
Conclusions
The maximum torque applied to the Elgiloy and Ti alloy rods were accurately measured in an MRI scanner. The Ti alloy rod showed an extraordinary larger torque than the value estimated by the conventional torque theory. This abnormal torque value can be explained by incorporating the susceptibility anisotropy effect into the theory.Acknowledgements
This study was supported by Strategic Promotion of Innovative Research and Development (S-Innovation) from the Japan Agency for Medical Research and Development (AMED).References
1. Kakizawa Y, Seguchi T, Horiuchi T, et al. Cerebral aneurysm clips in the 3-Tesla magnetic field: laboratory investigation. J. Neurosurg., 2010;113(4):859-869.Figures