4061
RF Safety of Transcranial Direct Current Stimulation Equipment during MRI1Max Planck Institute for Human Cognitive and Brain Sciences, Leipzig, Germany
Synopsis
We calculated the RF-induced power deposition at 3T due to the presence of tDCS equipment using an approximation of the human body by a single tissue numerical model. Influences of the tDCS lead including a built-in serial resistor on the power deposition were evaluated. Our case study provided strong evidence that the tDCS setup has a relevant impact on power deposition in proximity of the electrode edges at 3T. These particular conditions are not explicitly considered in the procedures that are used for SAR monitoring on the MRI scanner. The peak voltage across the serial resistor has to be carefully considered in terms of sufficient electrical strength to safely prevent sparks.
Introduction:
An increasing number of MRI investigations to study the human brain employ multi-modal setups, where additional devices are used to record complementary information or to manipulate brain states. In the case of transcranial direct current stimulation (tDCS) this requires additional sensor setups that entail two external wires with an electrode that is in contact with the human skin. The wire enters the radio-frequency (RF) coil’s effective exposure volume and operates as an antenna whose performance depends on the relative positioning of the wire and human body as well as the electrical contact of the electrode with the skin. In general, RF-induced power deposition (p) may heat up the area where the tDCS electrode contacts the skin. In current commercial tDCS devices, a serial resistor is used to reduce this unwanted (and potentially harmful) temperature rise. Although computational power is increasing constantly, it remains a challenge to perform 3D electromagnetic (EM) simulations of tDCS equipment with high resolution human body models located inside the MRI whole-body coil. Goals of the current study were: (a) to calculate the RF-induced power deposition at 3T (123.2 MHz) due to presence of tDCS equipment labeled MR “conditional” using an approximation of the human body by a single tissue numerical model; (b) to evaluate the influences of the serial resistor as well as the tDCS lead positioning on the power deposition.Methods:
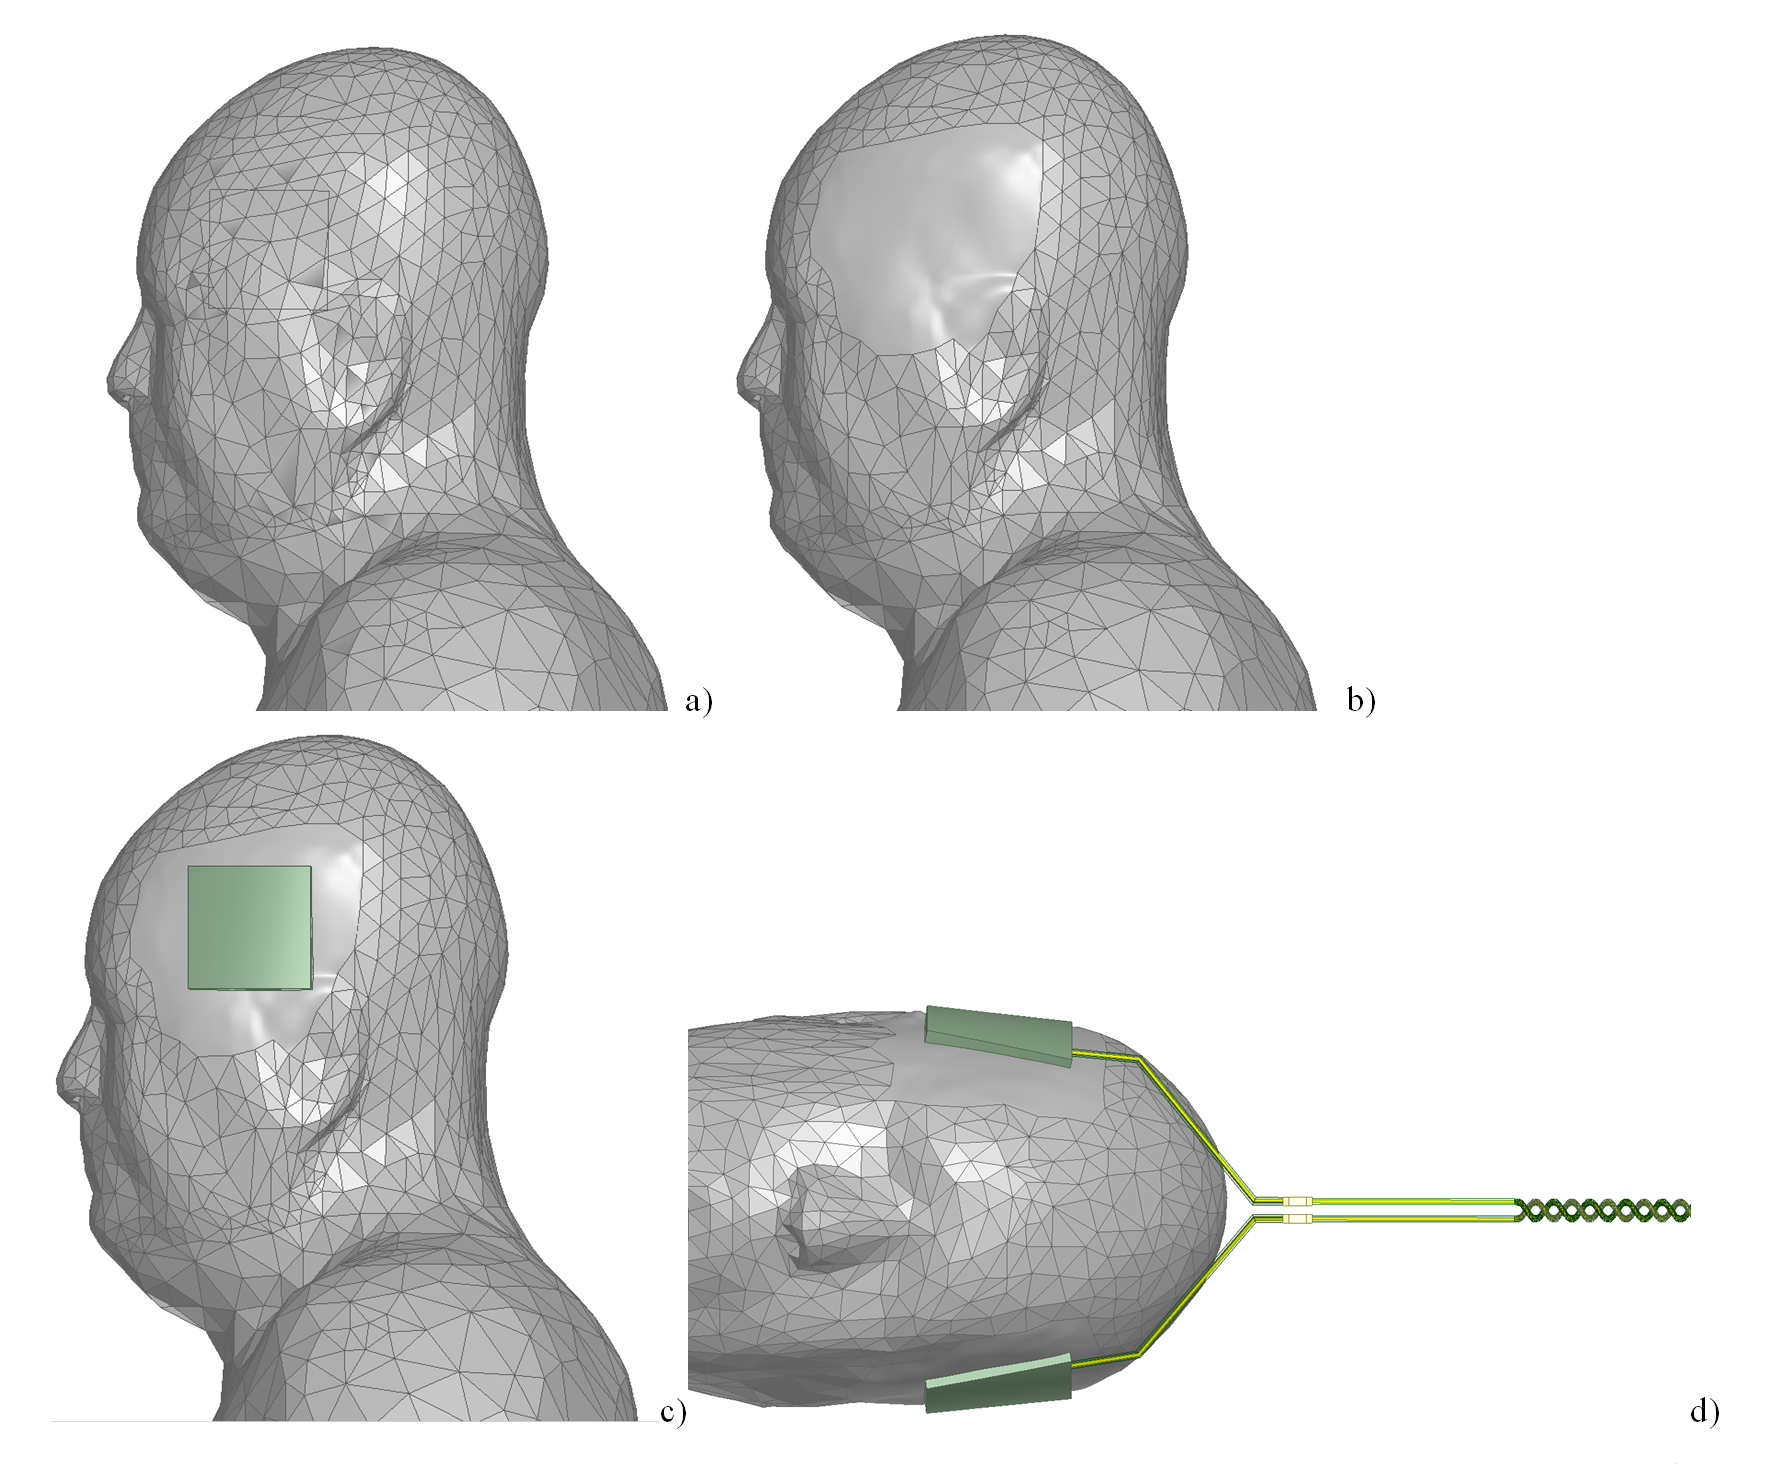
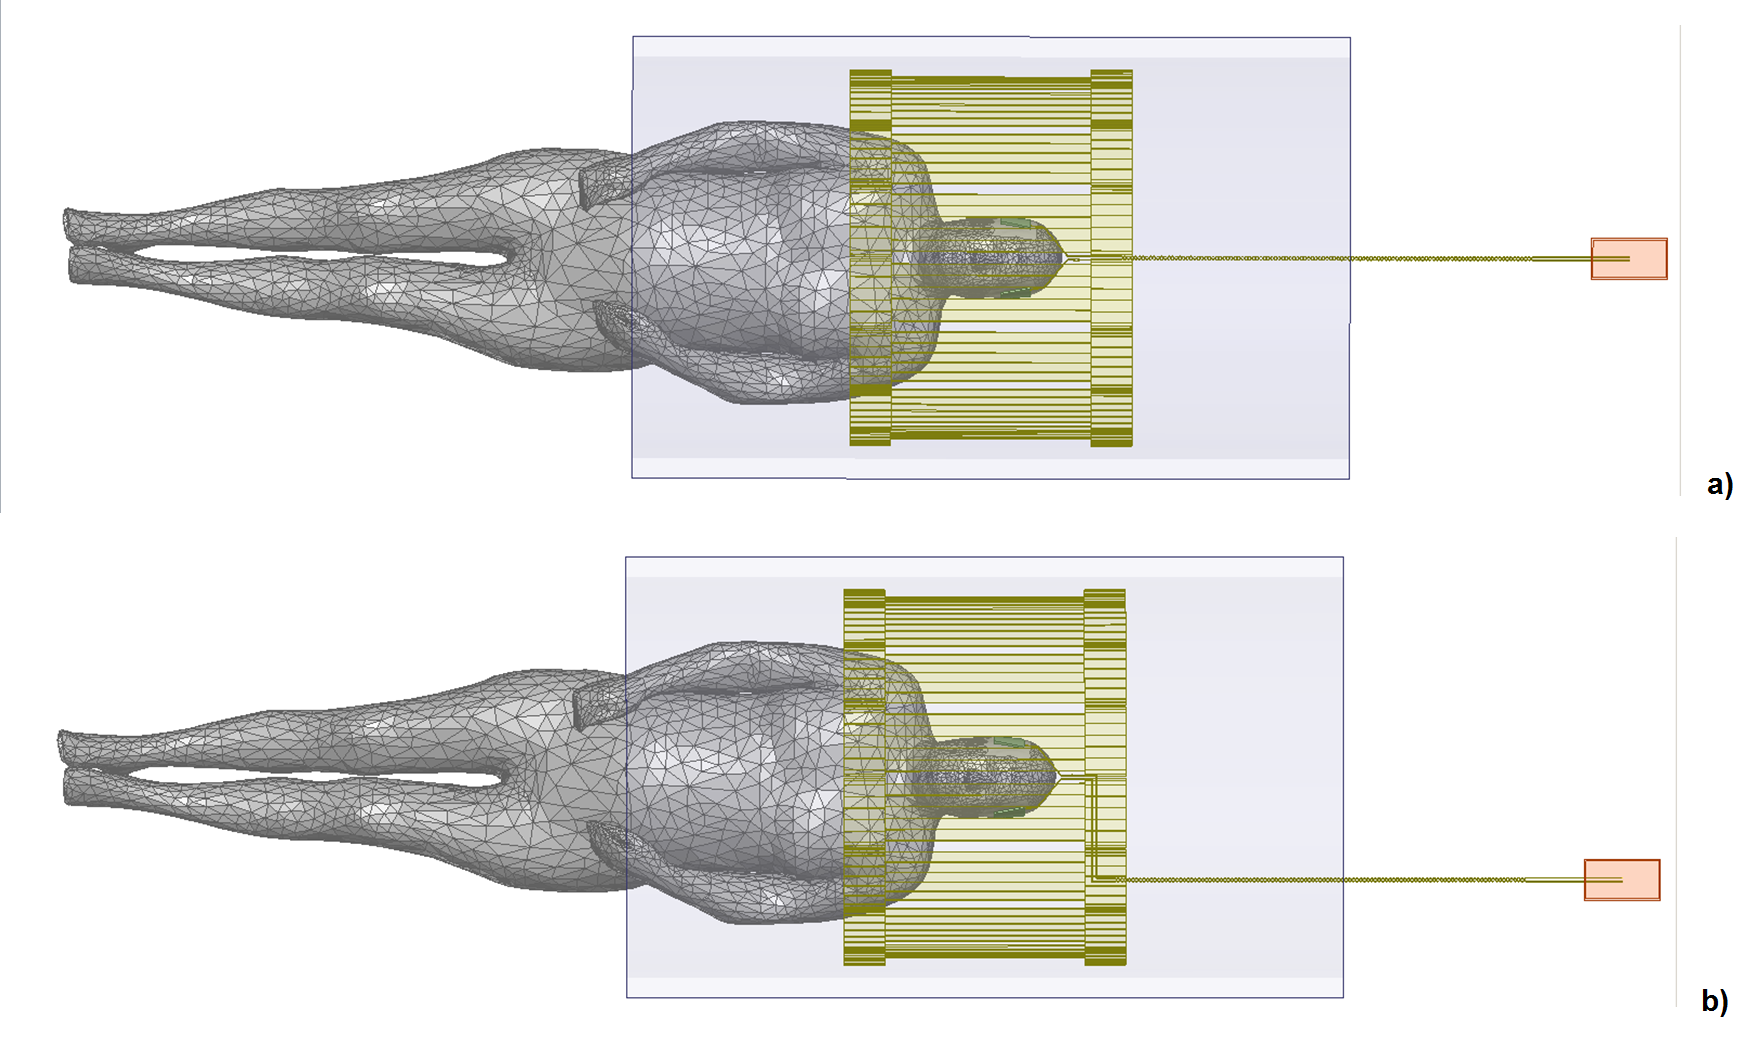
The tDCS setup consisted of two electrodes, two leads, and a metal connection box located 410mm away from the coil shield. The serial resistors integrated in the leads were located 100 mm away from the electrodes. Three resistor values were simulated: 1 mΩ, 5kΩ, and 1GΩ to simulate conditions of a short (potential manufacturing fault), normal operation, and an open connection (resistor failure after long-term operation), respectively. To ensure proper electrical contact between the tDCS electrode and the skin as well as high quality numerical mesh generation, the triangular faces of the skin object in areas around both electrodes were merged into a single face (see Figs. 1a and b). The skin object of the Visible Human Project (VHP) model [1] was used with a scaling factor 0.9 and εr=66.5 and σ=0.518S/m. The model head was positioned in the coil’s isocenter. The whole-body coil was a 3T (123.2 MHz) 16-rung high-pass birdcage with inner diameter 615mm; total length 480mm (Fig.2). Two lead positions were simulated: on axis of the scanner bore and shifted towards the edge of the patient table.
Results and Discussion:
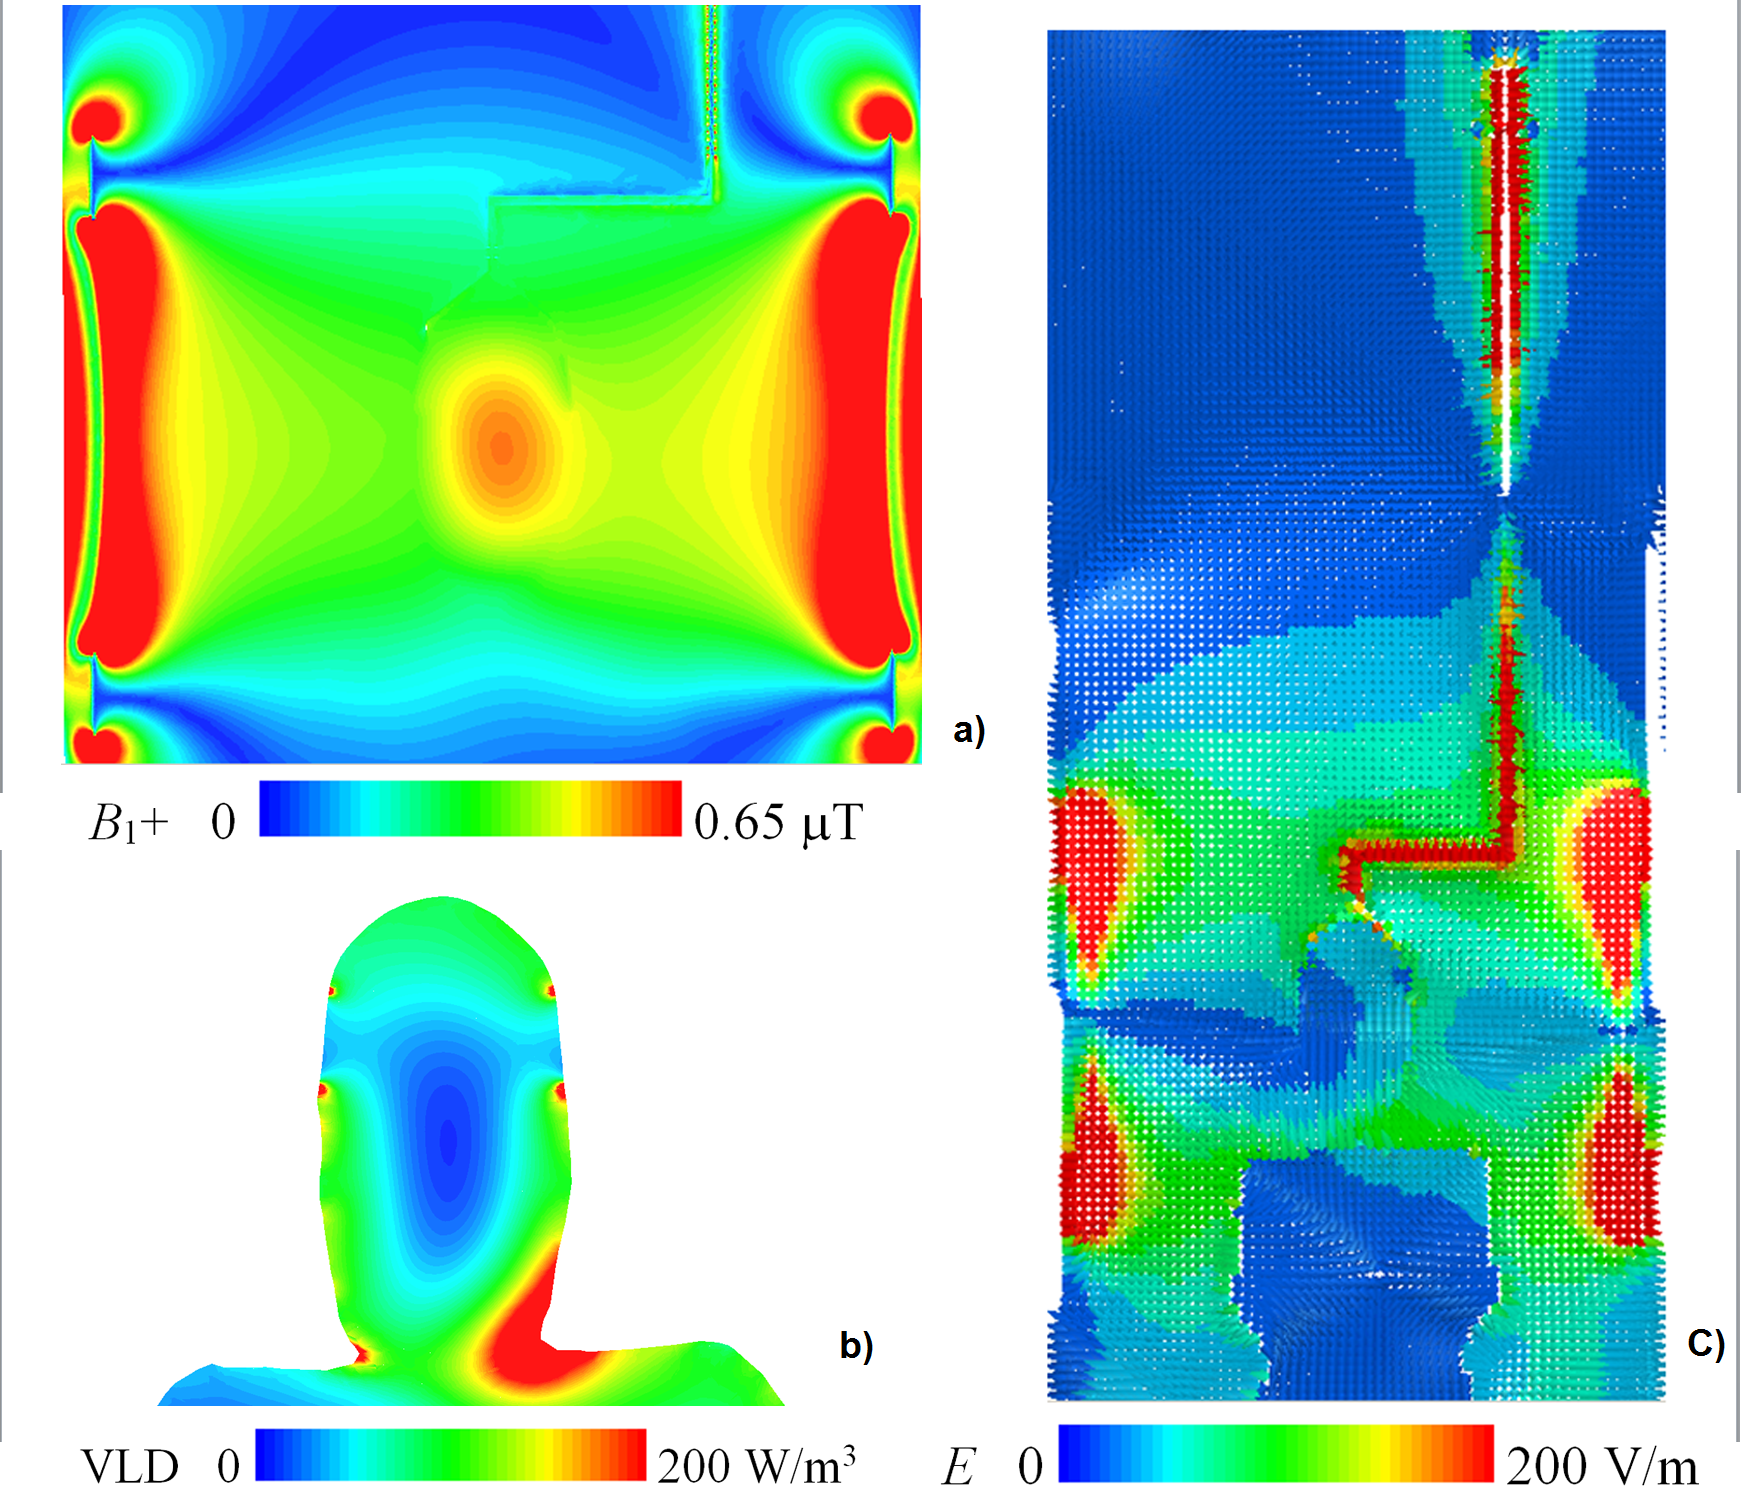
Results obtained without consideration of tDCS equipment were consistent with the literature [2]: B1+ was rather homogeneously distributed across the head and the power deposition showed a maximum in the neck region (Fig. 3). Upon adding the tDCS setup with the lead directed along the magnet axis, substantial power deposition was observed in close proximity of the tDCS electrode edges for all values of the serial resistor (Fig. 3). Unsurprisingly, the B1+ disturbance was highest for a short (R=1mΩ). For normal operation (R=5kΩ), repositioning of the tDCS lead resulted in a small variation of the power deposition in proximity of the electrode edges (Fig. 5). Assuming a (pulsed) peak value of 30kW of the total transmit power (which can be generated by the scanner’s transmitter) yielded voltages across the serial resistor up to 850 V for normal tDCS operation (R=5kΩ) and up to 1.4 kV for an open connection (R=1GΩ). For a whole-body SAR level of 4 W/kg, average voltages across the serial resistor were 130V and 225 V for R=5kΩ and R=1GΩ, respectively. The results indicated that the 1206-sized resistors with a voltage rating of 200V do not provide sufficient electrical strength for safe operation under all possible conditions. Due to the similarity of the power deposition in proximity of the electrode edges for all investigated conditions, we conclude that the tDCS electrodes and the straight segments of the leads between them and the serial resistor predominantly determine the power deposition.Conclusion:
Our simulations provide strong evidence that the tDCS setup has a relevant impact on power deposition in proximity of the electrode edges at 3T. These particular conditions are not explicitly considered in the procedures that are used for SAR monitoring on the MRI scanner. The peak voltage across the serial resistor has to be carefully considered in terms of sufficient electrical strength to safely prevent sparks. Future work should include investigations of RF-induced heating and experimental validation of simulation results. While our results were derived assuming realistic conditions that may occur with commercially available equipment, it is to note that they cannot be readily generalized because only a single coil geometry and a single tDCS device were included in our investigation.Acknowledgements
No acknowledgement found.References
[1] J. Yanamadala, G. M. Noetscher, V. K. Rathi, S. Maliye, H. A. Win, A. L. Tran, X. J. Jackson, A. T. Htet, M. Kozlov, A. Nazarian, S. Louie, S. N. Makarov, “New VHP-Female v. 2.0 Full-Body Computational Phantom and Its Performance Metrics Using FEM Simulator ANSYS HFSS,” 37th Annual Int. Conf. of the IEEE Eng. in Medicine and Biology Society, Milano, Italy, Aug. 25-29, 2015, pp. 3237-3241.
[2] Z. Yu, X. Xin, and C. M. Collins, “Potential for High-Permittivity Materials to Reduce Local SAR at a Pacemaker Lead Tip During MRI of the Head With a Body Transmit Coil at 3 T,” Magnetic Resonance in Medicine 78:383–386 (2017)
Figures