4056
Safety of Active Catheters in MRI: Termination Impedance vs. RF-induced Heating1Dept.of Radiology, Medical Physics, Medical Center - University of Freiburg, Freiburg, Germany, 2German Consortium for Translational Cancer Research Freiburg Site, German Cancer Research Center (DKFZ), Heidelberg, Germany
Synopsis
RF-induced heating of the active catheters was analyzed and analytically modeled to demonstrate that it can be controlled by adjusting the termination impedance. Current distribution of a single-loop active guiding catheter was formulated as a function of the incident electric field, propagation constants, and termination impedances. The tip SAR was displayed on a color-coded Smith chart in terms of the normalized input impedance. For the first time, analytical modeling and transfer function measurements were applied to active catheters. A novel signal level and impedance control unit was introduced, which is applicable also to other interventional devices.
Introduction
Active catheters offer advantages over other tracking techniques, since the active tracking coil can be identified and localized unambiguously[1–4]. So far, studies on MR safety of active catheters have been limited to experimental setups[5–7], and theoretical approaches have included only single conductor wires[8–11]. In practice, an active guiding catheter consists of an imaging/tracking coil at the tip that is connected to an interface circuit via a long coaxial cable.
The interface circuit can be modified to control the tip signal brightness by analog means[12]. This study shows that the input impedance at the side of interface circuit connected to the coaxial cable, $$$Z_{in}$$$, effects also the specific absorption rate at the tip ($$$SAR_{tip}$$$). To analyze the relationship between $$$Z_{in}\>$$$and$$$\>SAR_{tip}$$$, the active catheter was analytically modeled as a multiconductor transmission line(TL) embedded in a conducting medium, and was represented on a color-coded Smith chart as a function of $$$Z_{in}$$$. The results were consistent with the transfer function(TF) measurements, as well as with the FDTD simulations. Temperature measurements were also performed to prove the principle.
Theory
The effect of an incident E-field on a terminated coaxial cable immersed in a lossy medium is two-fold: the E-field is scattered on the outer conductor, and it is coupled to the line through the coil at the tip. The currents due to these interactions are called antenna-mode and TL-mode currents, respectively. Using buried wire models[11,13–15], we define common impedance and admittance parameters to describe the effect of per-unit-length internal wire impedance, $$$Z_{w}$$$, inductive per-unit-length series impedance of the insulation, $$$Z_{i}$$$, per-unit-length ground return impedance, $$$Z_{g}$$$[16], capacitive per-unit-length shunt admittance of the insulation, $$$Y_{i}$$$, and the ground admittance $$$Y_{g}\>$$$(Fig.1,Eqn.1): $$Z=Z_w+Z_i+Z_g,\>Y^{-1}=Y_i^{-1}+Y_g^{-1}$$
The corresponding inhomogeneous wave equations for this model can be solved for current $$$i(z)\>$$$and voltage $$$u(z)\>$$$distributions using the Green’s function approach. During interventions, however, the catheter is never completely located inside the body. Therefore, the model is modified as cascaded TLs inside two media: tissue/blood and air.
Methods
An active catheter was constructed with a loop coil at the tip (1.6x18mm2) using 35μm copper etched on polyimide film of 50μm thickness. A 225μm-diameter coaxial cable (Picocoax PCX40C05, Axon’ Kabel GmbH, Germany) was connected to the loop, and was connected to the interface circuit via a $$$(2n+1)\lambda$$$-long (i.e., 165cm) coaxial cable. The interface circuit was modified to change $$$Z_{in}$$$ during external RF transmission (i.e., detune state) (Fig.2). The Smith chart was covered uniformly by 22 points. The TF measurements[17] were performed for each $$$Z_{in}$$$ at 128 MHz using the 'piX System' (ZMT Zurich Med Tech AG, Switzerland).
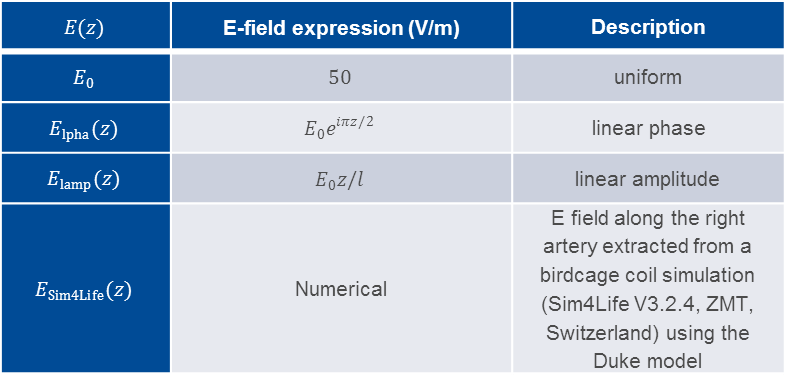
The analytical model was implemented in Matlab R2017a (The MathWorks, Inc., MA) and tested for different $$$E(z)$$$ functions (Table-1) considering fairly uniform E-field of a standart 3T birdcage body coil. Smith chart was covered more densely by 64x64 equidistant $$$Z_{in}$$$, and $$$SAR_{tip}$$$ was plotted in color in the chart.
Temperature measurements were performed using a 3T MRI system (Siemens AG, Germany). The catheter was immersed in a homogeneous ASTM phantom [18] and the optical probes (Optocone AG, Dresden, Germany) were placed in close vicinity of the tip of the catheter.
Results
TFs from analytical model, FDTD simulations and piX setup measurements exhibit similar behaviors including the oscillations and locations of abrupt phase changes (Fig.3a). As an example, the response is shown for the uniform incident field, $$$E_{0}$$$: in the color-coded Smith chart $$$SAR_{tip}$$$ is lower by at least 40% for a broad range of termination impedance values (Fig.3b).
In Fig.4, $$$SAR_{tip}$$$ vs. $$$Z_{in}$$$ is plotted for each incident field $$$E(z)$$$ for both analytical and measured TFs. $$$E_{0}$$$ and $$$E_{Sim4Life}$$$ resulted in similar and lower $$$SAR_{tip}$$$ values than the others, both in measured and analytical calculations. $$$SAR_{tip}$$$ due to $$$E_{lamp}$$$ was greater than that of $$$E_{lpha}$$$. A similar behavior was observed in the analytical model, yet with a stronger dependence on $$$Z_{in}$$$ for $$$E_{lpha}\>$$$(Fig.4b). 83.3% decrease in SAR is estimated if $$$Z_{in}$$$ is changed from $$$16.8+j30.4\>$$$(Scan5) to $$$30.4-j43.5$$$(Scan13). 73.4% difference was observed between the two extreme cases due to $$$E_{lamp}$$$ with the analytical model.
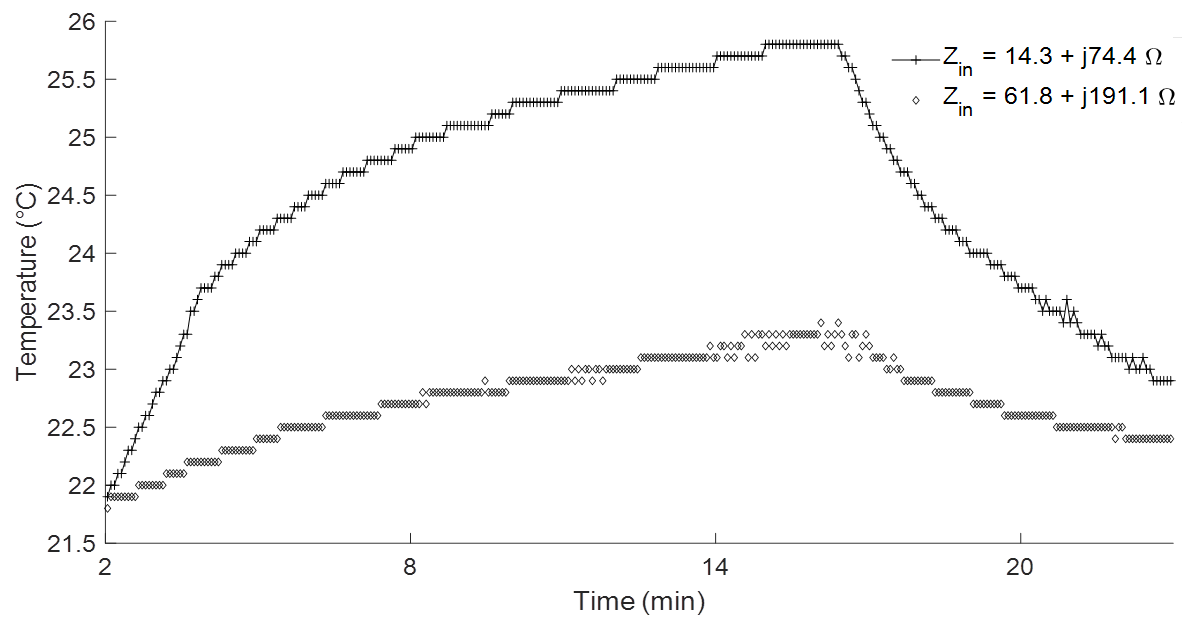
Temperature measurements during high SAR protocol are shown for two extreme cases corresponding to $$$Z_{in}=61.8+j191.1$$$Ω and $$$Z_{in}=14.3+j74.4\>$$$Ω(Fig.5). A difference of $$$\triangle\>T=2.9$$$°C at the tip of the catheter was measured.
Discussion
Analytical modeling is a promising alternative to FDTD simulations, and experimental methods, as it is useful to analyze the effects of parameters, such as $$$Z_{in}$$$, efficiently. The analysis shows that heating characteristics of devices can be changed by electrical means, and that results are in good agreement with TF and temperature measurements. This concept might be extended to other devices and implants if wire structures are transformed to coaxial structures, e.g. by embedding an outer conductor, without affecting the functionality.Acknowledgements
We gratefully acknowledge generous support from Dr. Tolga Goren of IT’IS Foundation, Zurich, Switzerland, and Dr. Michael Oberle of ZMT Zürich MedTech AG, Zurich, Switzerland.References
1. Ackerman JL, Offutt MC, Buxton RB, Brady TJ. Rapid 3D tracking of small rf coils. In: Proc Soc Magn Reson Med 5. Montreal, Quebec; 1986. p. 1131.
2. Dumoulin CL, Souza SP, Darrow RD. Real-time position monitoring of invasive devices using magnetic resonance. Magn. Reson. Med. 1993;29:411–415. doi: 10.1002/mrm.1910290322.
3. Susil RC, Yeung CJ, Halperin HR, Lardo AC, Atalar E. Multifunctional interventional devices for MRI: A combined electrophysiology/MRI catheter. Magn. Reson. Med. 2002;47:594–600. doi: 10.1002/mrm.10088.
4. Spuentrup E, Ruebben A, Schaeffter T, Manning WJ, Günther RW, Buecker A. Magnetic Resonance–Guided Coronary Artery Stent Placement in a Swine Model. Circulation 2002;105:874–879. doi: https://doi.org/10.1161/hc0702.104165.
5. Maier SE, Wildermuth S, Darrow RD, Watkins RD, Debatin JF, Dumoulin CL. Safety of MR tracking catheters. In: Proc Soc Magn Reson 3. ; 1995. p. 497.
6. Ladd ME, Quick HH, Debatin JF, von Schulthess GK, Mckinnon GC. Resonant heating of intravascular RF coils. In: Proc Intl Soc Mag Reson Med 6. Sydney, Australia; 1998. p. 473.
7. Krafft A, Müller S, Umathum R, Semmler W, Bock M. B1 field-insensitive transformers for RF-safe transmission lines. Magn. Reson. Mater. Physics, Biol. Med. 2006;19:257–266. doi: 10.1007/s10334-006-0055-x.
8. Nitz WR, Oppelt a, Renz W, Manke C, Lenhart M, Link J. On the heating of linear conductive structures as guide wires and catheters in interventional MRI. J. Magn. Reson. Imaging 2001;13:105–14.
9. Yeung CJ, Susil RC, Atalar E. RF heating due to conductive wires during MRI depends on the phase distribution of the transmit field. Magn. Reson. Med. 2002;48:1096–1098. doi: 10.1002/mrm.10310.
10. Acikel V, Atalar E. Modeling of radio-frequency induced currents on lead wires during MR imaging using a modified transmission line method. Med. Phys. 2011;38:6623–32. doi: 10.1118/1.3662865.
11. Zemann D, Moertlbauer K. Using transmission line theory to analyze RF induced tissue heating at implant lead tips. In: Proc Intl Soc Mag Reson Med 20. Melbourne, Australia; 2012. p. 2710.
12. Özen AC, Lottner T, Reiss S, Krafft AJ, Heidt T, von zur Mühlen C, Bock M. Operator Controlled Illumination of Active Catheter Tips using a Variable Attenuator. In: Proc Intl Soc Mag Reson Med 25. Honolulu, Hawai’i; 2017. p. 741.
13. Taylor CD, Satterwhite RS, Harrison JCW. The response of a Terminated Two-wire Transmission Line Excited by a Nonuniform Electromagnetic Field. IEEE Trans. Antennas Propag. 1965;13:987–989.
14. Agrawal A, Price H, Gurbaxani S. Transient Response of Multiconductor Transmission Lines Excited by a Nonuniform Electromagnetic Field. IEEE Trans. Electromagn. Compat. 1980;EMC-22:119–129. doi: 10.1109/TEMC.1980.303824.
15. Shafai L, Bridges GEJ. Plane wave coupling to multiple conductor transmission lines above a lossy earth. IEEE Trans. Electromagn. Compat. 1989;31:21–33. doi: 10.1109/15.19904.
16. Tesche FM. Comparison of the transmission line and scattering models for computing the HEMP response of overhead cables. IEEE Trans. Electromagn. Compat. 1992;34:93–99. doi: 10.1109/15.135621.
17. Park SM, Kamondetdacha R, Nyenhuis J a. Calculation of MRI-induced heating of an implanted medical lead wire with an electric field transfer function. J. Magn. Reson. Imaging 2007;26:1278–1285. doi: 10.1002/jmri.21159.
18. American Society for Testing and Materials International. Designation: ASTM F2182-11a, standard test method for measurement of radio frequency induced heating near passive implants during magnetic resonance imaging. West Conshohocken, PA; 2011.
Figures