4049
Shear stiffness determination using MR-acoustic radiation force imagingBradley D. Bolster, Jr.1, Henrik Odéen2, Hailey McLean2, Dennis L. Parker2, and Allison Payne2
1Siemens Medical Solutions USA, Inc., Salt Lake City, UT, United States, 2Radiology and Imaging Sciences, University of Utah, Salt Lake City, UT, United States
Synopsis
Magnetic resonance acoustic radiation force imaging (MR-ARFI) has been used pre-clinically to detect tissue displacement changes during magnetic resonance guided focused ultrasound treatments. Although displacement is a quantitative metric, shear stiffness is typically used to clinically describe disease states. This work develops and evaluates a model-based technique to determine tissue shear stiffness from MR-ARFI displacement measurements. The MR-ARFI derived values are compared to conventional MR elastography shear stiffness values in a phantom study.
Introduction
Tissue shear stiffness is an inherent tissue property that can be used in both diagnostic and therapeutic medical applications. MR elastography (MRE) is a non-invasive technique that uses phase-difference imaging techniques to determine tissue stiffness through detection of propagating harmonic shear waves generated by an external driver (1). MR acoustic radiation force imaging (MR-ARFI) is another non-invasive technique that can measure internal tissue displacements over a localized region caused by the radiation force of a focused ultrasound beam. While still pre-clinical, MR-ARFI has been used to assess the change of tissue displacement due to thermal therapy (2,3). Although displacement is a quantitative metric that is a surrogate for tissue stiffness, the shear stiffness of the tissue is used clinically to describe disease states (4,5). We have developed a technique to determine tissue shear stiffness using MR-ARFI displacement measurements. This work compares this new technique to MRE measurements using a controlled, tissue-mimicking phantom study.Methods
Phantoms: Two tissue-mimicking phantoms (cylindrical, 10x15 cm) were fabricated (6) to evaluate the MR-ARFI technique. Two porcine gelatins of different stiffness were used: 125-bloom (Vyse Gelatin Co., IL, USA) and 175-bloom (Sigma-Aldrich Co. MO, USA). One phantom was homogeneous (125-bloom) and the other, a hybrid, had two semicircular compartments composed of the 125- and 175-bloom gelatins (Figure 1). Acoustic properties were measured with through transmission and radiation force balance techniques (6).MRE was performed using a prototype 2D segmented-EPI based MRE pulse sequence and a pneumatic MRE driver system (Resoundant, Rochester, MN, USA). The mechanical excitation was applied at the base of the phantom and MRE data was acquired coronally to maximize in-plane shear wave propagation. Elastograms were acquired in both phantoms at steady state mechanical excitation frequencies of 30, 40, 50, 60,100 and 150Hz.
MR-ARFI was performed in the phantoms using a pre-clinical MRgFUS system (256-element transducer, 940 kHz, IGT, Inc., Pessac, France). Individual sonications were performed in both phantoms in the 125- (N=6) and 175-bloom (N=3) regions and 3D displacement maps were measured using a simultaneous MR-ARFI and temperature sequence (7). MRE and MR-ARFI setups and relevant parameters are shown in Figure 1 and Table 1.
Shear stiffness calculation: MR images were used to create acoustic models of each phantom. The shear stiffness was determined using an optimization routine that iterated on the shear stiffness to minimize the cost function $$$J = \sum\mid D_{EXP} - D_{SIM} \mid^2$$$ where the sum is over the 3D ROI surrounding the MRgFUS focal spot. DEXP is the MR-ARFI measured displacement and DSIM is the simulated MR-ARFI displacement (8). The algorithm was implemented in MATLAB (Mathworks, Natick, MA) and required approximately 2 minutes to converge on a standard PC.
Results
Given the shear wavelengths and the relatively small geometry of the phantoms, MRE derived shear stiffness was estimated by averaging measured shear stiffness in identical ROIs at 100Hz and 150Hz. While the utilization of higher mechanical excitation frequencies were required due to phantom geometry, separate MRE measurements (not shown) of larger phantoms created from the same batches of gelatin demonstrated only minor frequency dependence in stiffness measures over the 30 – 150 Hz mechanical frequency range.Examples of the wave displacement and elastogram for both the homogenous and dual compartment phantom are shown in Figure 2. An example of the measured and simulated displacement maps for an optimized shear stiffness value in the 125-bloom homogeneous phantom is shown in Figure 3.
As shown in Figure 4, MRE derived shear stiffness values were were 4.88±0.26, 5.03 ±0.19 kPa and 8.73±0.81 kPa in the homogenous 125-bloom, hybrid 125- and 175-bloom compartments respectively versus 5.47±0.64, 6.10±0.90 and 8.50±1.5 kPa for the MR-ARFI derived values.
Discussion & Conclusion
Acute estimation of stiffness change is a potentially valuable parameter when assessing thermal therapies. While MRE is used clinically for estimation of tissue stiffness, it requires a separate mechanical driver that is not easily inserted into the MRgFUS environment. MR-ARFI uses existing MRgFUS hardware, but only measures tissue displacement. We have demonstrated a model-based algorithm that derives accurate shear stiffness from MR-ARFI displacement measurements. These MR-ARFI derived measurements compared well to those derived directly from MRE.Compared to clinical MRE, MR-ARFI measurements are highly localized. This is not an inherent limitation in the MRgFUS setting as ablation and stiffness assessment pulses are roughly equivalent in size. Further, multi-point MR-ARFI techniques (9) can be applied to interrogate larger areas throughout the treated area. Further studies are necessary to fully characterize this technique and optimize its application in the MRgFUS therapy setting.
Acknowledgements
No acknowledgement found.References
1. Muthupillai R, Ehman RL. Magnetic resonance elastography. Nat Med. 1996;2(5):601-3. PubMed PMID: 8616724.2. Bitton RR, Kaye E, Dirbas FM, Daniel BL, Pauly KB. Toward MR-guided high intensity focused ultrasound for presurgical localization: focused ultrasound lesions in cadaveric breast tissue. J Magn Reson Imaging. 2012;35(5):1089-97. Epub 2011/12/16. doi: 10.1002/jmri.23529. PubMed PMID: 22170814.
3. McDannold N, Maier SE. Magnetic resonance acoustic radiation force imaging. Med Phys. 2008;35(8):3748-58. Epub 2008/09/10. PubMed PMID: 18777934.
4. Venkatesh SK, Yin M, Ehman RL. Magnetic resonance elastography of liver: technique, analysis, and clinical applications. J Magn Reson Imaging. 2013;37(3):544-55. doi: 10.1002/jmri.23731. PubMed PMID: 23423795; PMCID: PMC3579218.
5. Wang QB, Zhu H, Liu HL, Zhang B. Performance of magnetic resonance elastography and diffusion-weighted imaging for the staging of hepatic fibrosis: A meta-analysis. Hepatology. 2012;56(1):239-47. doi: 10.1002/hep.25610. PubMed PMID: 22278368.
6. Farrer A, Odeen H, de Bever J, Coats B, Parker D, Payne A, Christensen D. Characterization and evaluation of tissue-mimicking gelatin phantoms for use with MRgFUS. Journal of Therapeutic Ultrasound. 2015;3(9).
7. de Bever JT, Odeen H, Hofstetter LW, Parker DL. Simultaneous MR thermometry and acoustic radiation force imaging using interleaved acquisition. Magn Reson Med. 2017. doi: 10.1002/mrm.26827. PubMed PMID: 28795419.
Figures
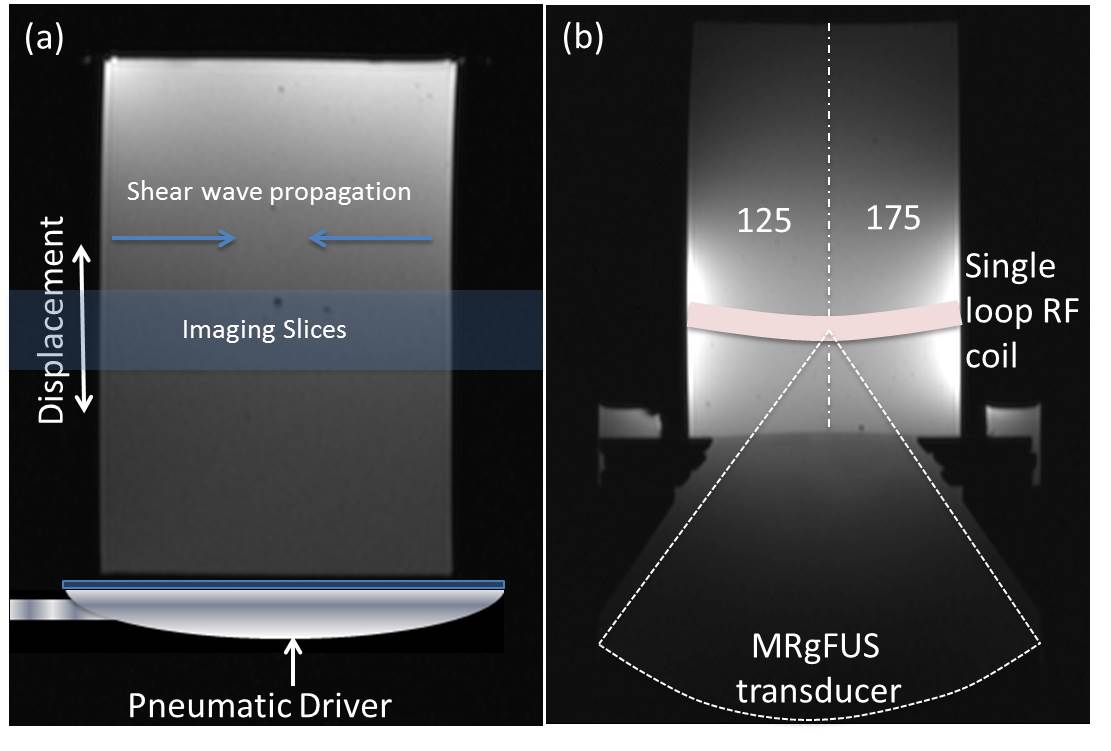
Figure 1: Experimental setups for both the (a) MRE and (b) MR-ARFI measurements. The configuration of the dual-compartment phantom is shown in (b).

Table 1: MR parameters for the MRE and MR-ARFI sequences. ++Acquisition of MR temperature and displacement maps requires 2*Tacq = 16.2s.

Figure 2: MRE elastogram and single timepoint wave displacement images for the homogeneous and dual compartment phantoms. The colorbar for the elastogram covers the range of 0 - 8kPa.
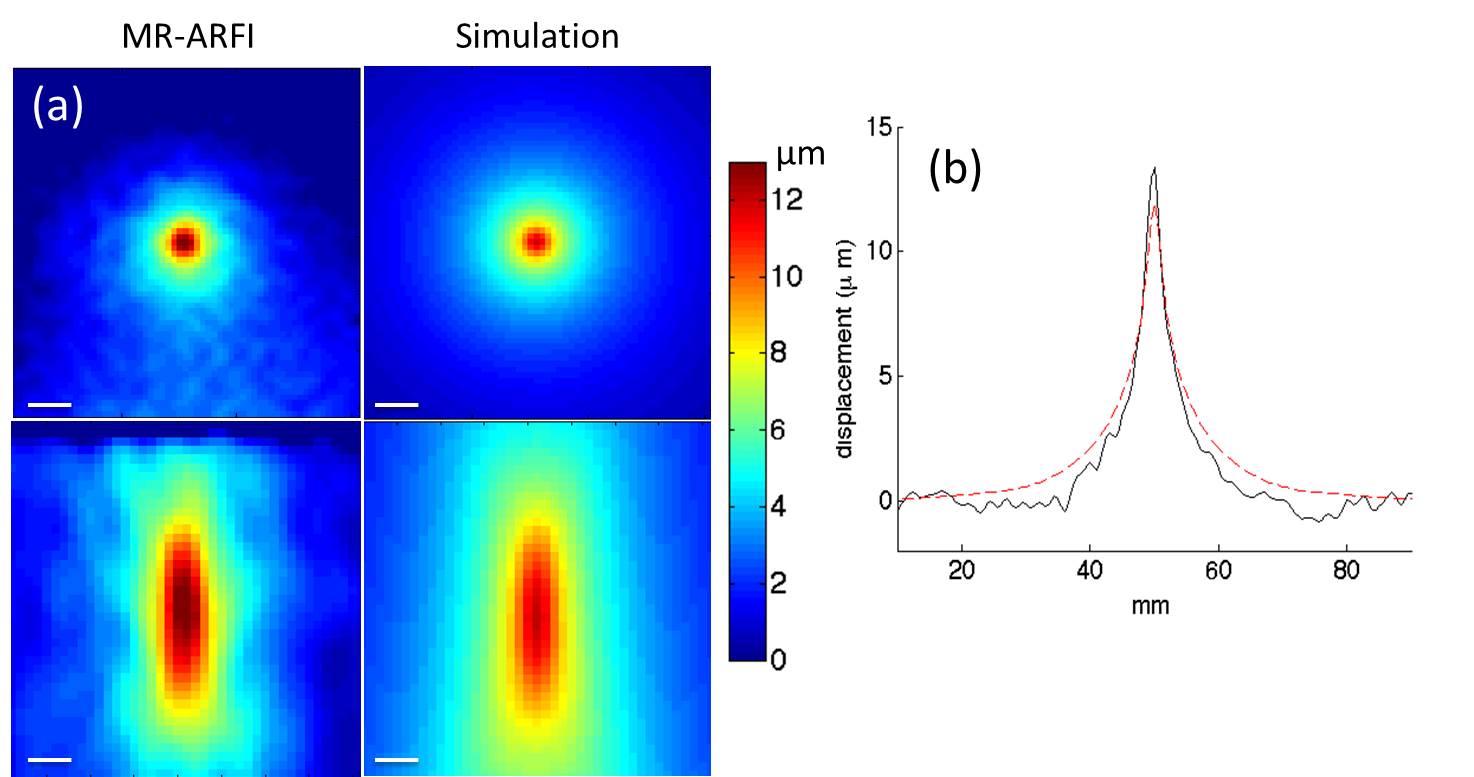
Figure 3: Comparison of simulated and MR-ARFI displacement maps in the 125-bloom homogeneous gelatin phantom. Simulated results show displacement for an optimized shear stiffness values of 5.2 kPa. (a) Coronal (top) and axial (bottom) views of displacement maps. (b) Comparison of simulated and MR-ARFI displacement through the transverse plane. The scale bar is 5mm.
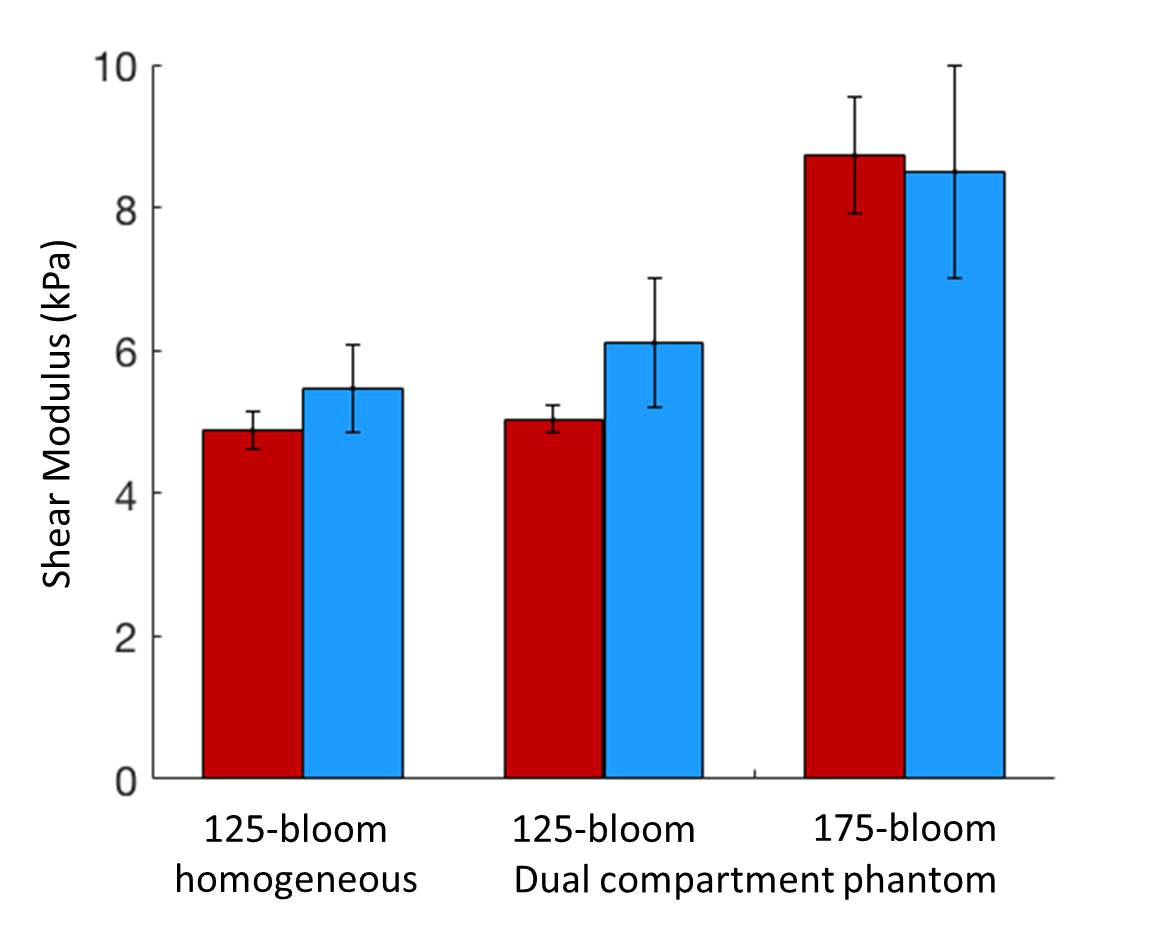
Figure 4: Comparison of shear modulus estimates for the MR-ARFI (blue) and MRE (red) methods. Values are shown for 125-bloom homogeneous and 125- and 175-bloom dual-compartment phantoms.