4045
Longitudinal multi-parametric MRI follow-up of ultrasound induced blood-brain barrier disruption in ratsAllegra Conti1, Françoise Geffroy1, Hermes Kamimura1, Fawzi Boumezbeur1, Sébastien Mériaux1, and Benoit Larrat1
1CEA/DRF/JOLIOT/NeuroSpin, Gif sur Yvette, France
Synopsis
Focused Ultrasound in conjunction with microbubbles allows the reversible and safe opening of the BBB in a narrow range of Acoustic Pressure (AP). Here we wanted to investigate what happens to the brain tissues at short- and long-terms in case of an excessive AP is reached in vivo. Passive Cavitation Detection has been used to register inertial cavitation during the opening. At 1,3,7,14 and 28 days after the BBB opening, T1,2-weighted images, T2*-maps, DWI, MRS acquisitions and histological analysis have been performed. P-gp and myelin expression, cells deaths, and astrocytes/microglial activations have been also imaged postmortem within 28 days.
INTRODUCTION
Low power Focused Ultrasound (FUS) in conjunction to intravenously injected microbubbles allows to locally open the Blood-Brain Barrier enabling drugs delivery to the brain1. Although FUS induced BBB opening have recently started to be used also for treating brain diseases in humans, many questions about the safety of this technique still need to be addressed. It has been shown, in rodents, that the BBB is safely open at 1.5MHz by an Acoustic Pressure (AP) below 0.5 MPa2. However, the damages occurring at higher AP have been always investigated in short-term studies3,4. Here we investigated what happens to the brain biologically and radiologically, if an AP significantly larger than the safe one is used. An AP of 0.8 MPa has been tested to open the BBB in rats. During the BBB opening session, Passive Cavitation Detection (PCD) allowed to record stable and inertial cavitation activity of the microbubbles. The effects of the sonication to the brain structure have been followed by MRI for 4 weeks after FUS. T2* maps, MRS and DWI acquisitions have been performed to evaluate local structural changes induced by FUS. Histological evaluations of myelin expression, cells deaths, and astrocytes/microglial activations have been studied within 28 days. At the same time, the characterization of the multidrug resistance P-glycoprotein (P-gp) expression has been investigated.METHODS
FUS-induced BBB permeabilization was performed under MRI guidance5 in one area of the striatum of 15 Fischer rats (350 g), by using a monoelement transducer working at 1.5 MHz (DC=3%, AP=0.8 MPa, sonication of 120 s). Sonovue (Bracco,Italie) microbubbles were intravenously injected right before sonications. After BBB opening Gd-based MR-Contrast Agent (CA) (Dotarem,Guerbet,France) has been injected. The CA concentration [CA] delivered to the brain has been quantified by acquiring T1-maps before and after the BBB opening6 (IR-FGE sequence7, TE/TR1=2.5/5 ms, 6 segments, 90 TI,from 75ms to 8975ms, FA=5°, resolution=0.250x0.250x1.25 mm3, delay between two segments TR2=15000ms, NA=6). At 1, 3, 7, 14 and 28 days after the BBB opening T2* maps, MRS and DWI acquisitions have been performed by using a MGE sequence (11 echo times from 3 to 25 ms, TR=813 ms, resolution=0.2x0.2x1 mm3, NA=2), a LASER sequence (TE/TR=2.5/2500 ms, voxel size=4mm3,NA=256) and a diffusion-weighted EPI sequence (8 segments, 21 directions, NA=4, b-value=1000 s/mm², resolution=0.2x0.2x1 mm3). At each time points, histological evaluations of the brain tissue have been performed on three rats.RESULTS
The total amount of CA delivered to the brain increased with increasing presence of edema after the sonication. For the rats exhibiting edema, PCD have recorded Inertial Cavitation phenomena. Figure1(A) shows T2*-maps acquired at 1 and 3 days after BBB opening. Only 2 over 15 rats showed T2* values increase in the sonicated area at day 1. No difference between the T2* values in the sonicated and in the controlateral area was observed from day 3 to day 28. Figure1(B) highlights that where T2* values increase Mean Diffusivities also increase. From MD, λ//, λ⊥ and FA maps, it was possible to notice an increasing diffusivity where the BBB has been opened, until 3 days from the sonication. In Figure 2, examples of those maps are shown: after 1 week there was no more difference in diffusivities between the sonicated and the controlateral hemisphere. Histological data have revealed a P-gP down-expression at Focal Spot (FS) location until 3 days after sonication, while between 7 and 14 days a down-expression spreads also in the controlateral hemisphere. At 1 month, the P-gp expression has recovered. Myelin stainings showed an hyper-intense signal at the FS until 3 days. Microglial and astrocyte activations are also localized in the sonicated area until 3 days, appearing in both hemispheres from 3 to 14 days after BBB opening. After 28 days only astrocytes activation has been observed.DISCUSSION AND CONCLUSION
Radiologic alterations induced by FUS were visible on multi-parametric MRI acquisitions for 3 days after sonication. Histology results revealed that some long-term biological effects remain until 1 month when applying high AP, even in the absence of hemorrhagic lesions. We have shown that until 2 weeks from the BBB opening, P-gP down-expression and microglial activations occured as a result of neuroinflammation. This inflammation appeared in the sonicated area within the first days and then spreads in both hemispheres after 1 week. After one month from the sonication only astrocytes activation has been observed. Such a long-term follow-up has not been reported so far and is of great importance for ensuring a safe use of this technology in clinical routine.Acknowledgements
No acknowledgement found.References
- Hynynen K., et al. Radiology. 2001 Sep; 220(3):640-6. 2.
- Baseri B., et al. Ultrasound Med Biol. 2010 Sep; 36(9): 1445–1459. 3.
- Aryal M., et al. PLoS One. 2017; 12(1): e0166061.
- Downs ME, et al. PLoS One. 2015; May 6;10(5):e0125911
- Magnin R., et al. J Ther Ultrasound. Dec 2015; 3: 22.
- Marty B., et al. Contrast Media Mol. Imaging,2013; 8(1): 12–9,
- Deichmann R., et al. Magn. Reson. Med., 1999 Jul;42 (1):206–9 .
Figures
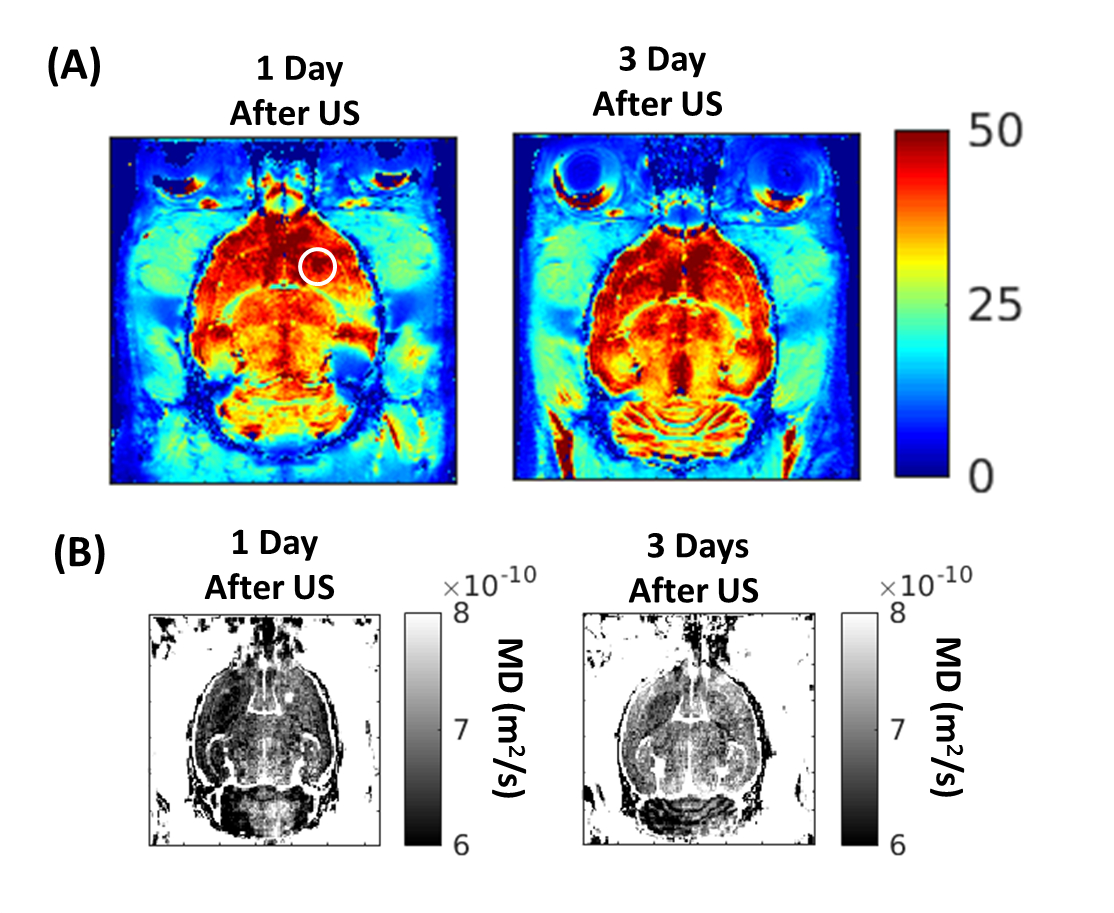
Figure 1: (A) T2*-maps
acquired at 1 and 3 days after the BBB opening.
In the sonicated region (white circle) T2* values increase at
day 1. No differences between the T2* values in the sonicated and in
the control tissue are observed from day 3. In Fig.1(B) it is shown that the
area where the T2* values increase correspond to the region where MD
also increases.
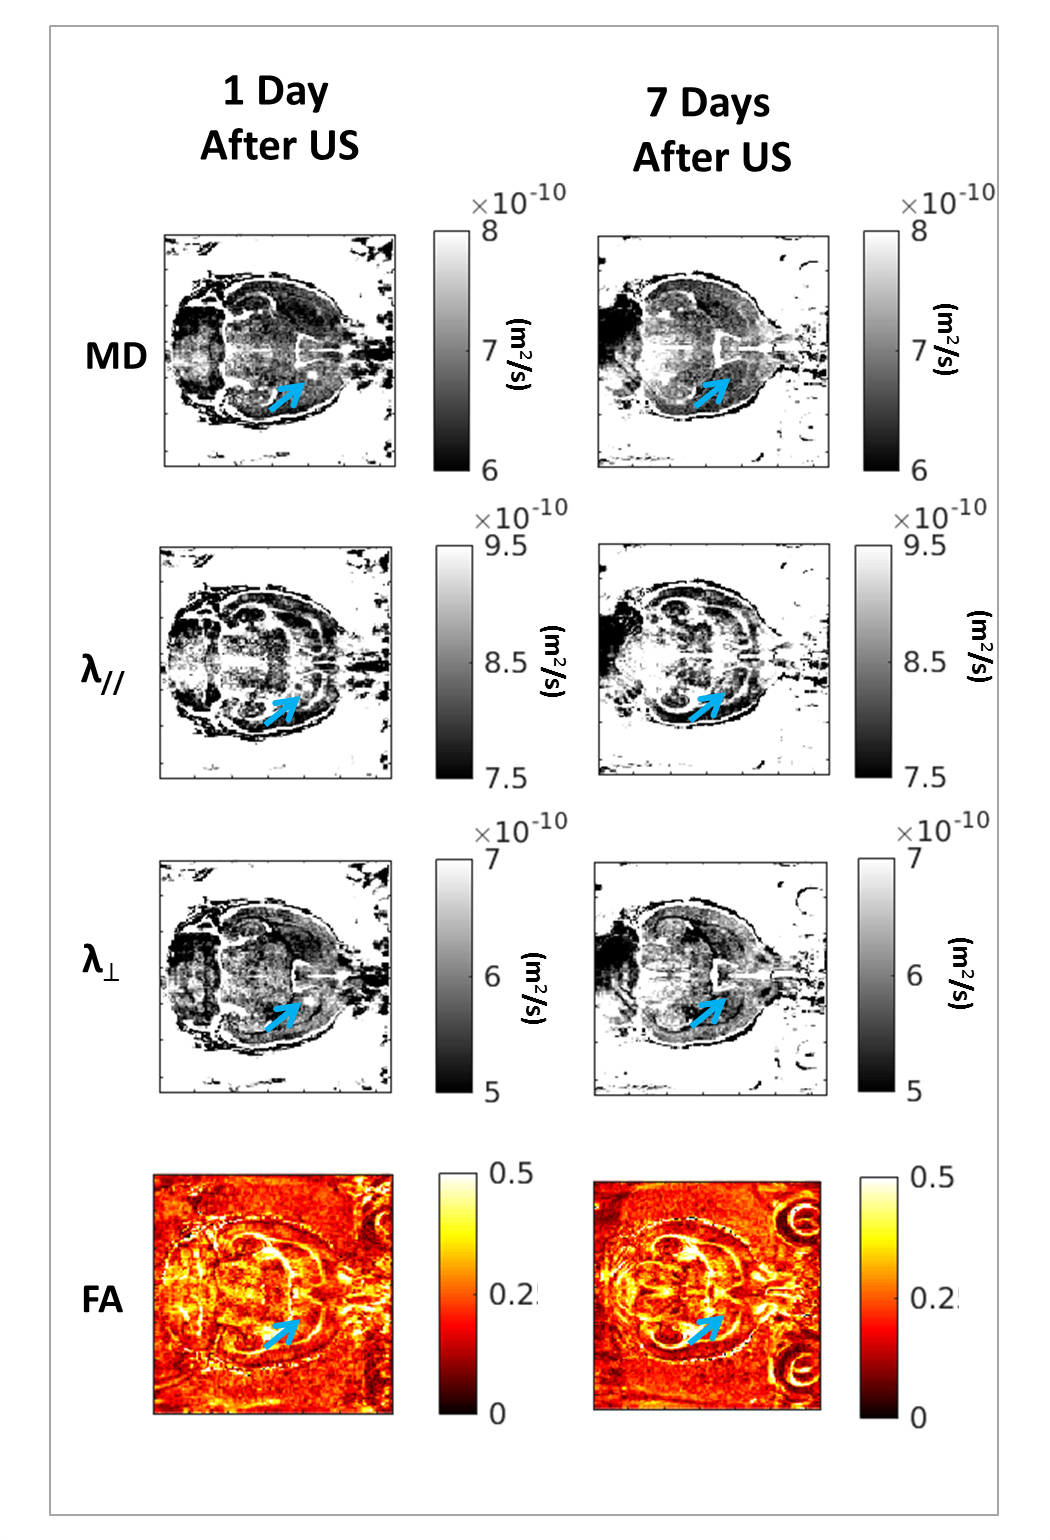
Figure 2: Examples of MD, λ//,
λ⊥ and FA maps acquired
at 1 day and 1 week after FUS. The blue arrow indicates where the BBB have been
opened. It is possible to notice that the local changes in diffusivities are
visible only until three days from the sonication.