4044
Shear wave elastography using multi-point acoustic radiation force imaging1Department of Radiology and Imaging Sciences, University of Utah, Salt Lake City, UT, United States, 2Siemens Medical Solutions USA, Inc., Salt Lake City, UT, United States, 3Department of Bioengineering, University of Utah, Salt Lake City, UT, United States, 4Department of Electrical and Computer Engineering, University of Utah, Salt Lake City, UT, United States
Synopsis
Characterizing the mechanical properties of tissue during focused ultrasound ablative therapies could provide useful information for pretreatment planning and treatment endpoint assessment. In this work we present a 3D MR acquisition capable of measuring propagating shear waves from a spatially distributed collection of focused ultrasound generated acoustic radiation force impulses. This new multi-point shear wave elastography technique is demonstrated and compared to conventional MR elastography.
INTRODUCTION:
MR elastography (MRE) uses mechanical excitation and precisely synchronized motion encoding gradients to non-invasively measure the mechanical properties of soft tissues.1 Mechanical excitation can be achieved using an external oscillating source2 or the acoustic radiation force (ARF) generated by a focused ultrasound (FUS) sonication.3,4 Here we present an efficient 3D MR acquisition capable of measuring the transient shear wavefront propagation from multiple, spatially distributed, ARF pulses. This new multi-point shear wave elastography (MPSWE) technique is demonstrated in phantom and ex-vivo experiments. The MPSWE method may be particularly useful at assessing mechanical changes in tissue due to MR-guided FUS therapies—the same transducer used to perform ablation can also be used as a mechanical excitation source for the elastography measurement.METHODS:
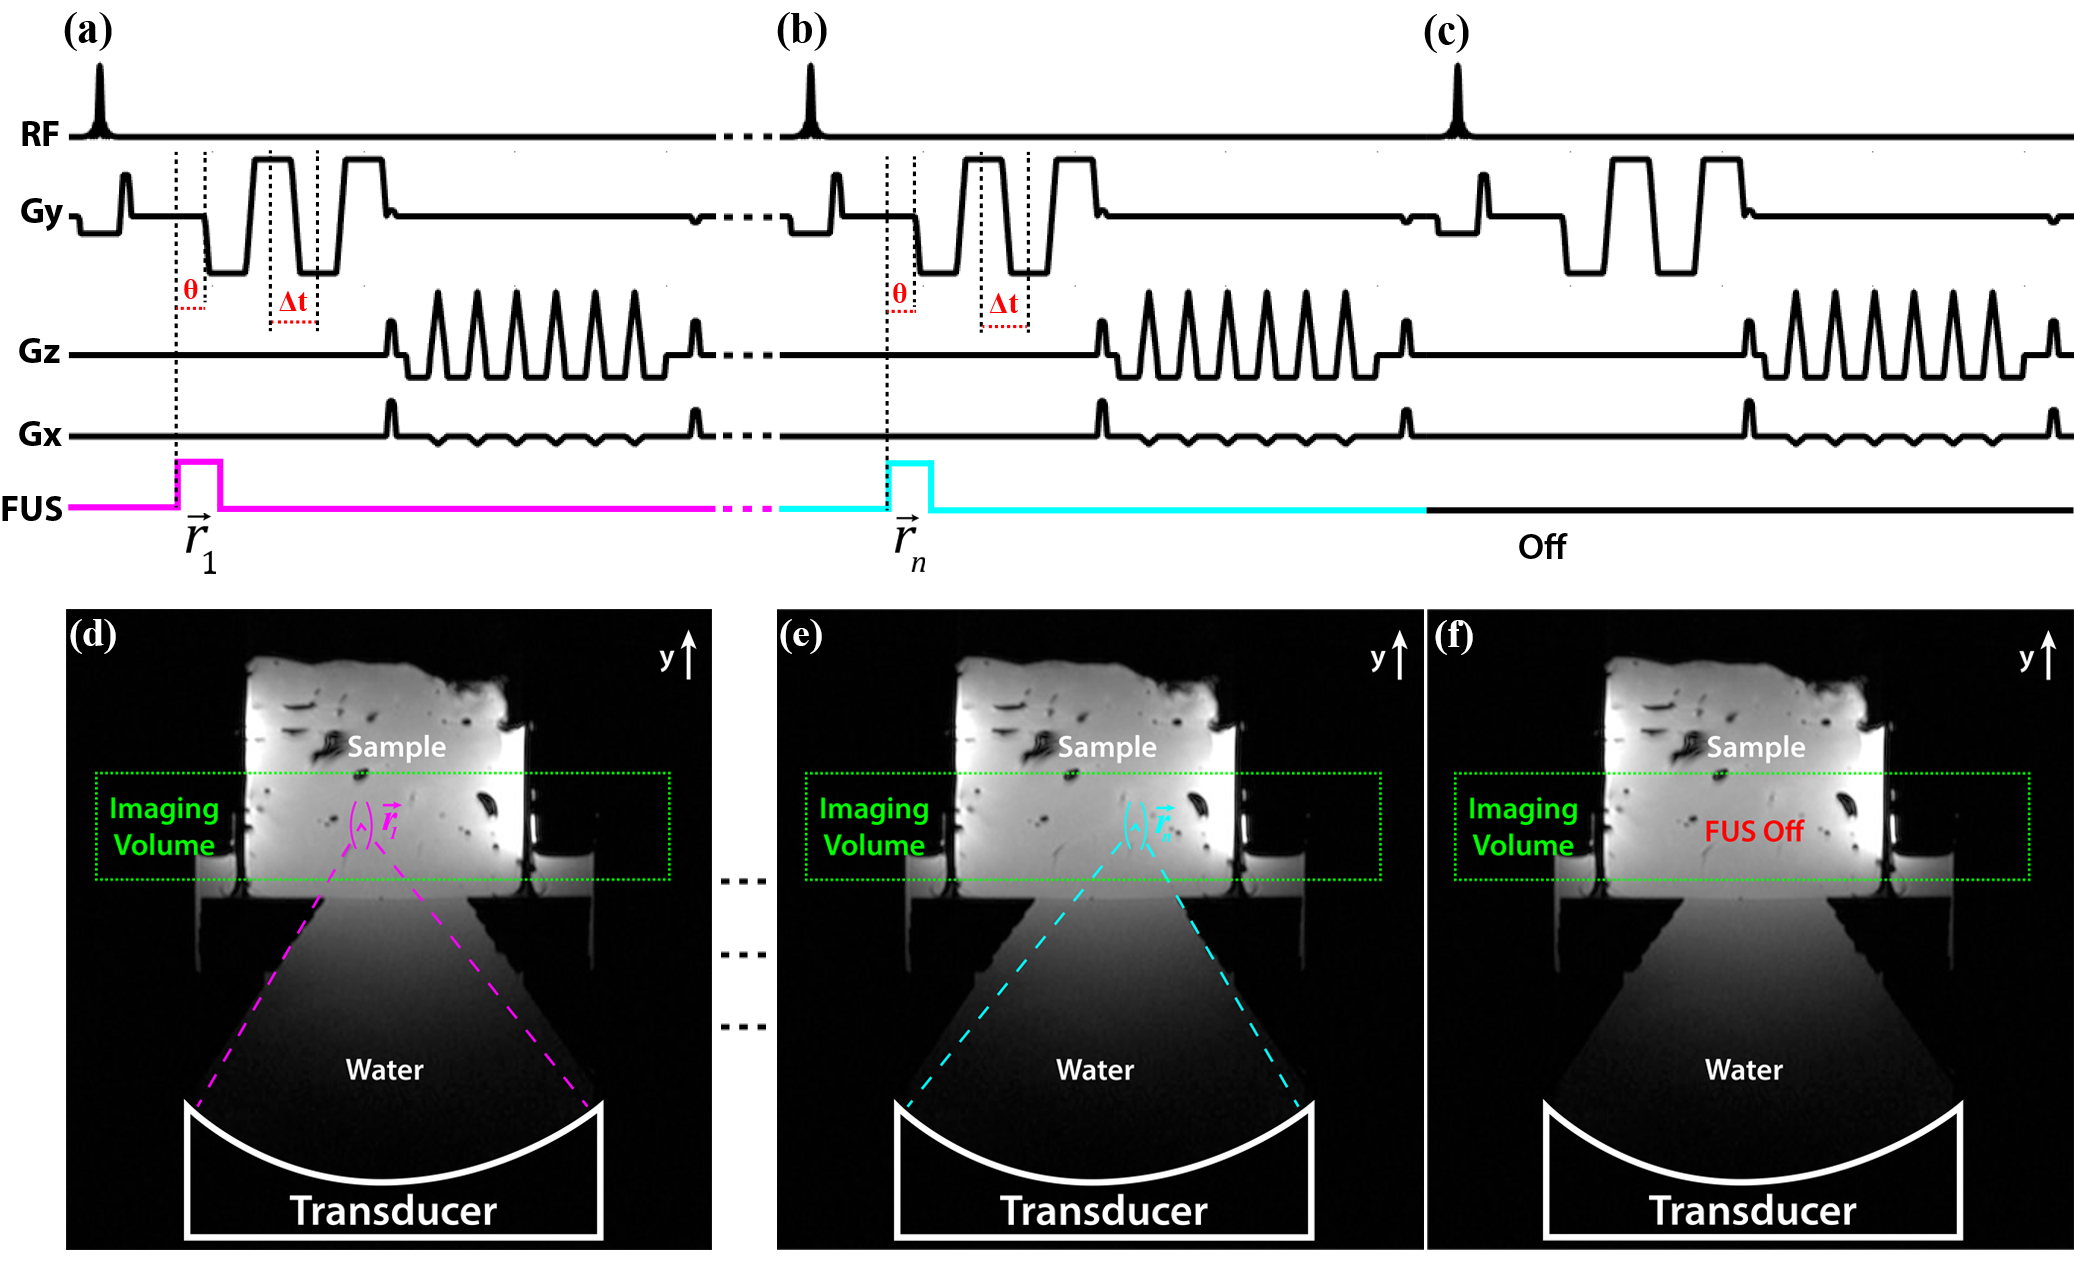
For the MPSWE acquisition (Figure 1), four motion encoding gradient (MEG) lobes along the FUS beam direction were added to a 3D gradient echo segmented EPI pulse sequence. Optical triggers synchronized the short ARF pulse to start a time θ before the start of the first MEG lobe. The first MEG lobe encodes the position of the initial ARF impulse. Lobes 2, 3, and 4 sample the propagating shear wavefront at times (θ+Δt/2, θ+3Δt/2, θ+5Δt/2) where Δt is the center-to-center spacing between MEG lobes. ARF impulses at different spatial locations were interleaved on a TR level using methods described previously.5,6 Phase difference images between each ARF image and the “off image” were generated.
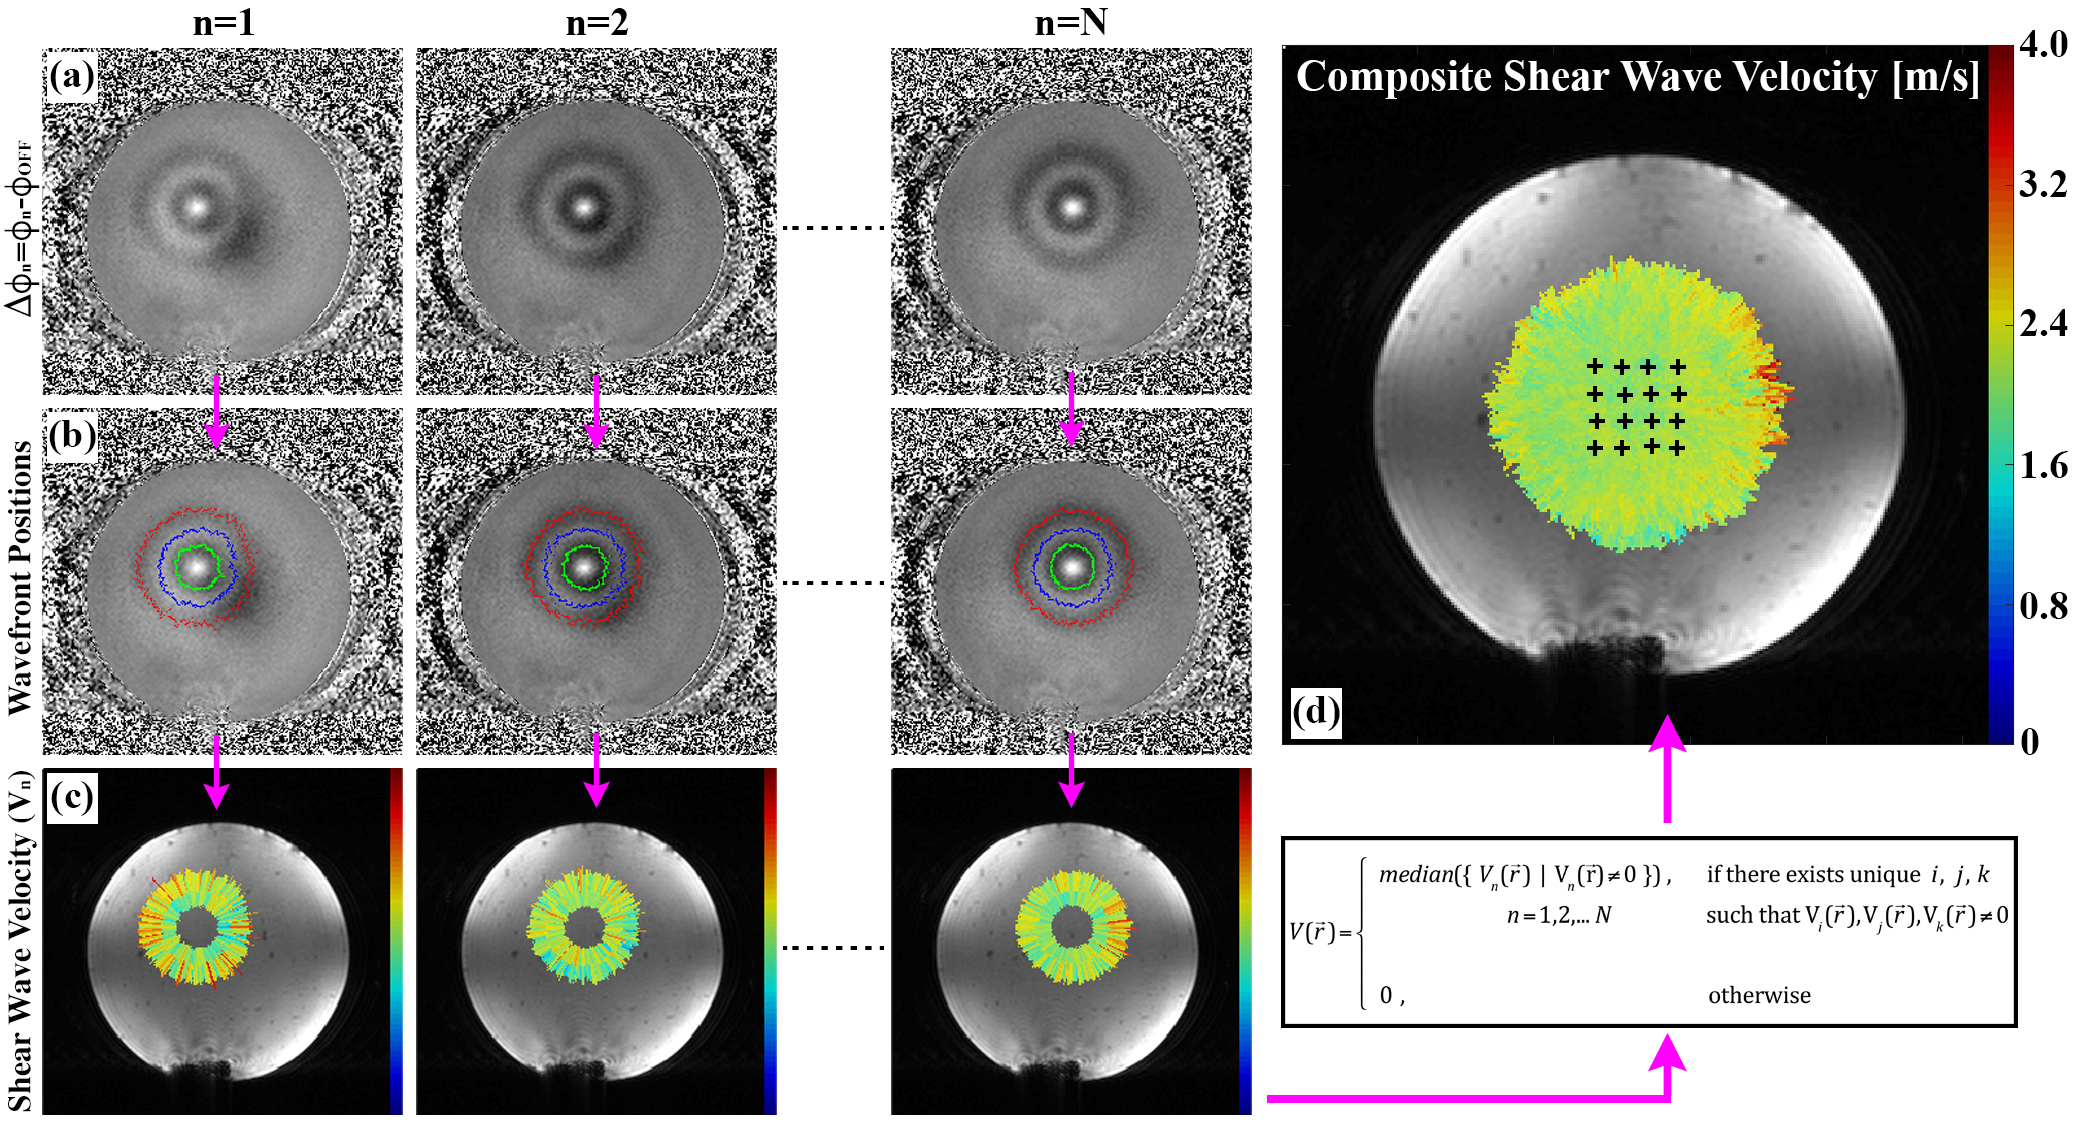
Figure 2 depicts how shear wave velocity is extracted from the multi-point data. The propagating shear wavefront is visible as alternating positive and negative rings in the phase difference images (Fig. 2a). Normalized 2D cross-correlation template matching was used to extract the initial ARF impulse location for each ARF point. Using this position as the source of the emanating wave, 1D template matching was used to automatically determine the position of each shear wavefront along each radial line (Fig. 2b). Shear wave velocity was calculated by dividing the distance between adjacent wavefronts by the MEG spacing (Δt). A composite shear wave velocity map was generated using the median combination outlined in Figure 2.
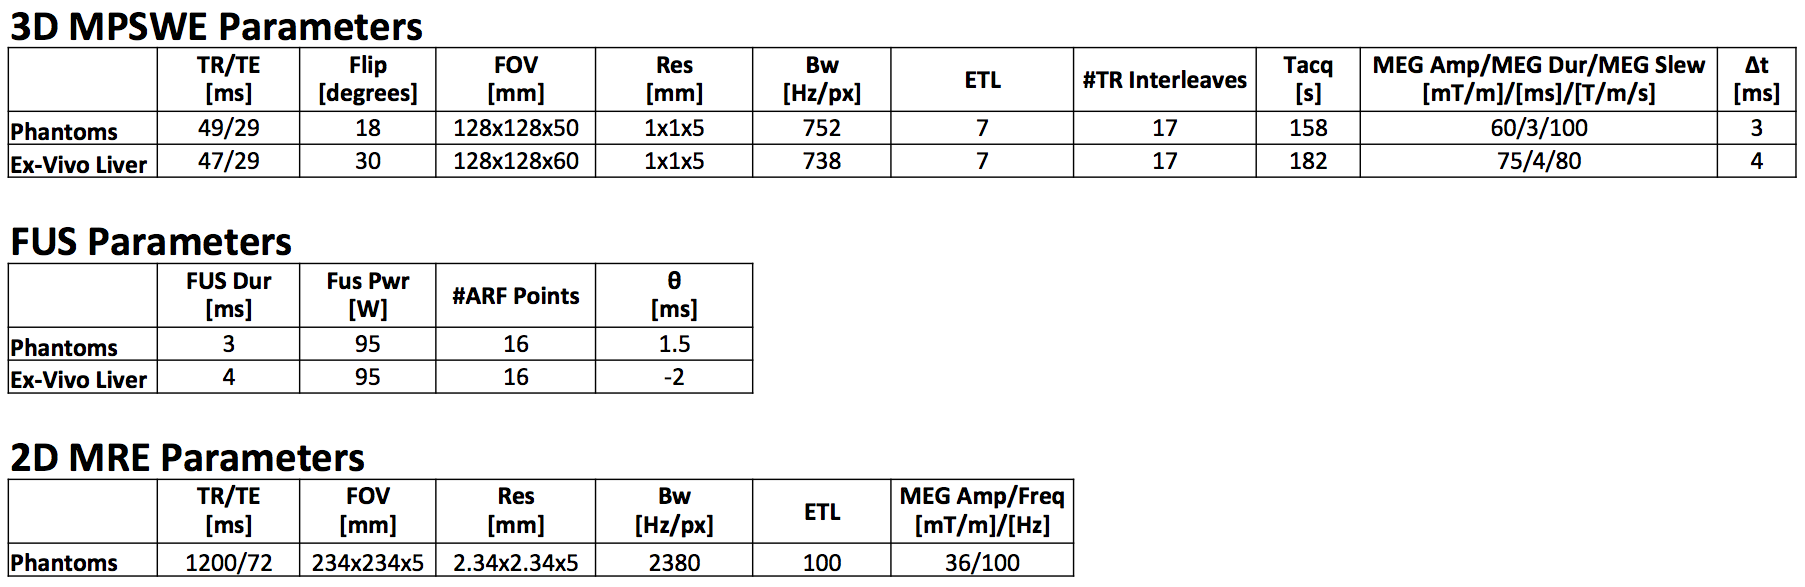
MPSWE experiments in gelatin phantoms7 (one homogenous and one dual-stiffness) and ex-vivo bovine liver were performed using a 256-element 13-cm focal length FUS transducer (Imasonic, Besançon, France). A single loop or a 5-channel custom-built receive RF-coil was used to acquire the MR signal. MR imaging was performed using a 3 Tesla scanner (Siemens MAGNETOM PrismaFIT, Erlangen, Germany). For each shear wave velocity acquisition, 16 uniformly spaced ARF points (4x4 grid covering a 15x15mm grid) were used. For comparison purposes conventional MRE using a prototype single-shot 2D spin echo EPI MRE sequence was also performed on the gelatin phantoms. The sequence was synchronized to a pneumatic mechanical driver (Resoundant, Rochester, MN) which produced a harmonic 100Hz wave excitation in the gelatin. Detailed MPSWE and MRE acquisition parameters are shown in Table 1.
RESULTS:
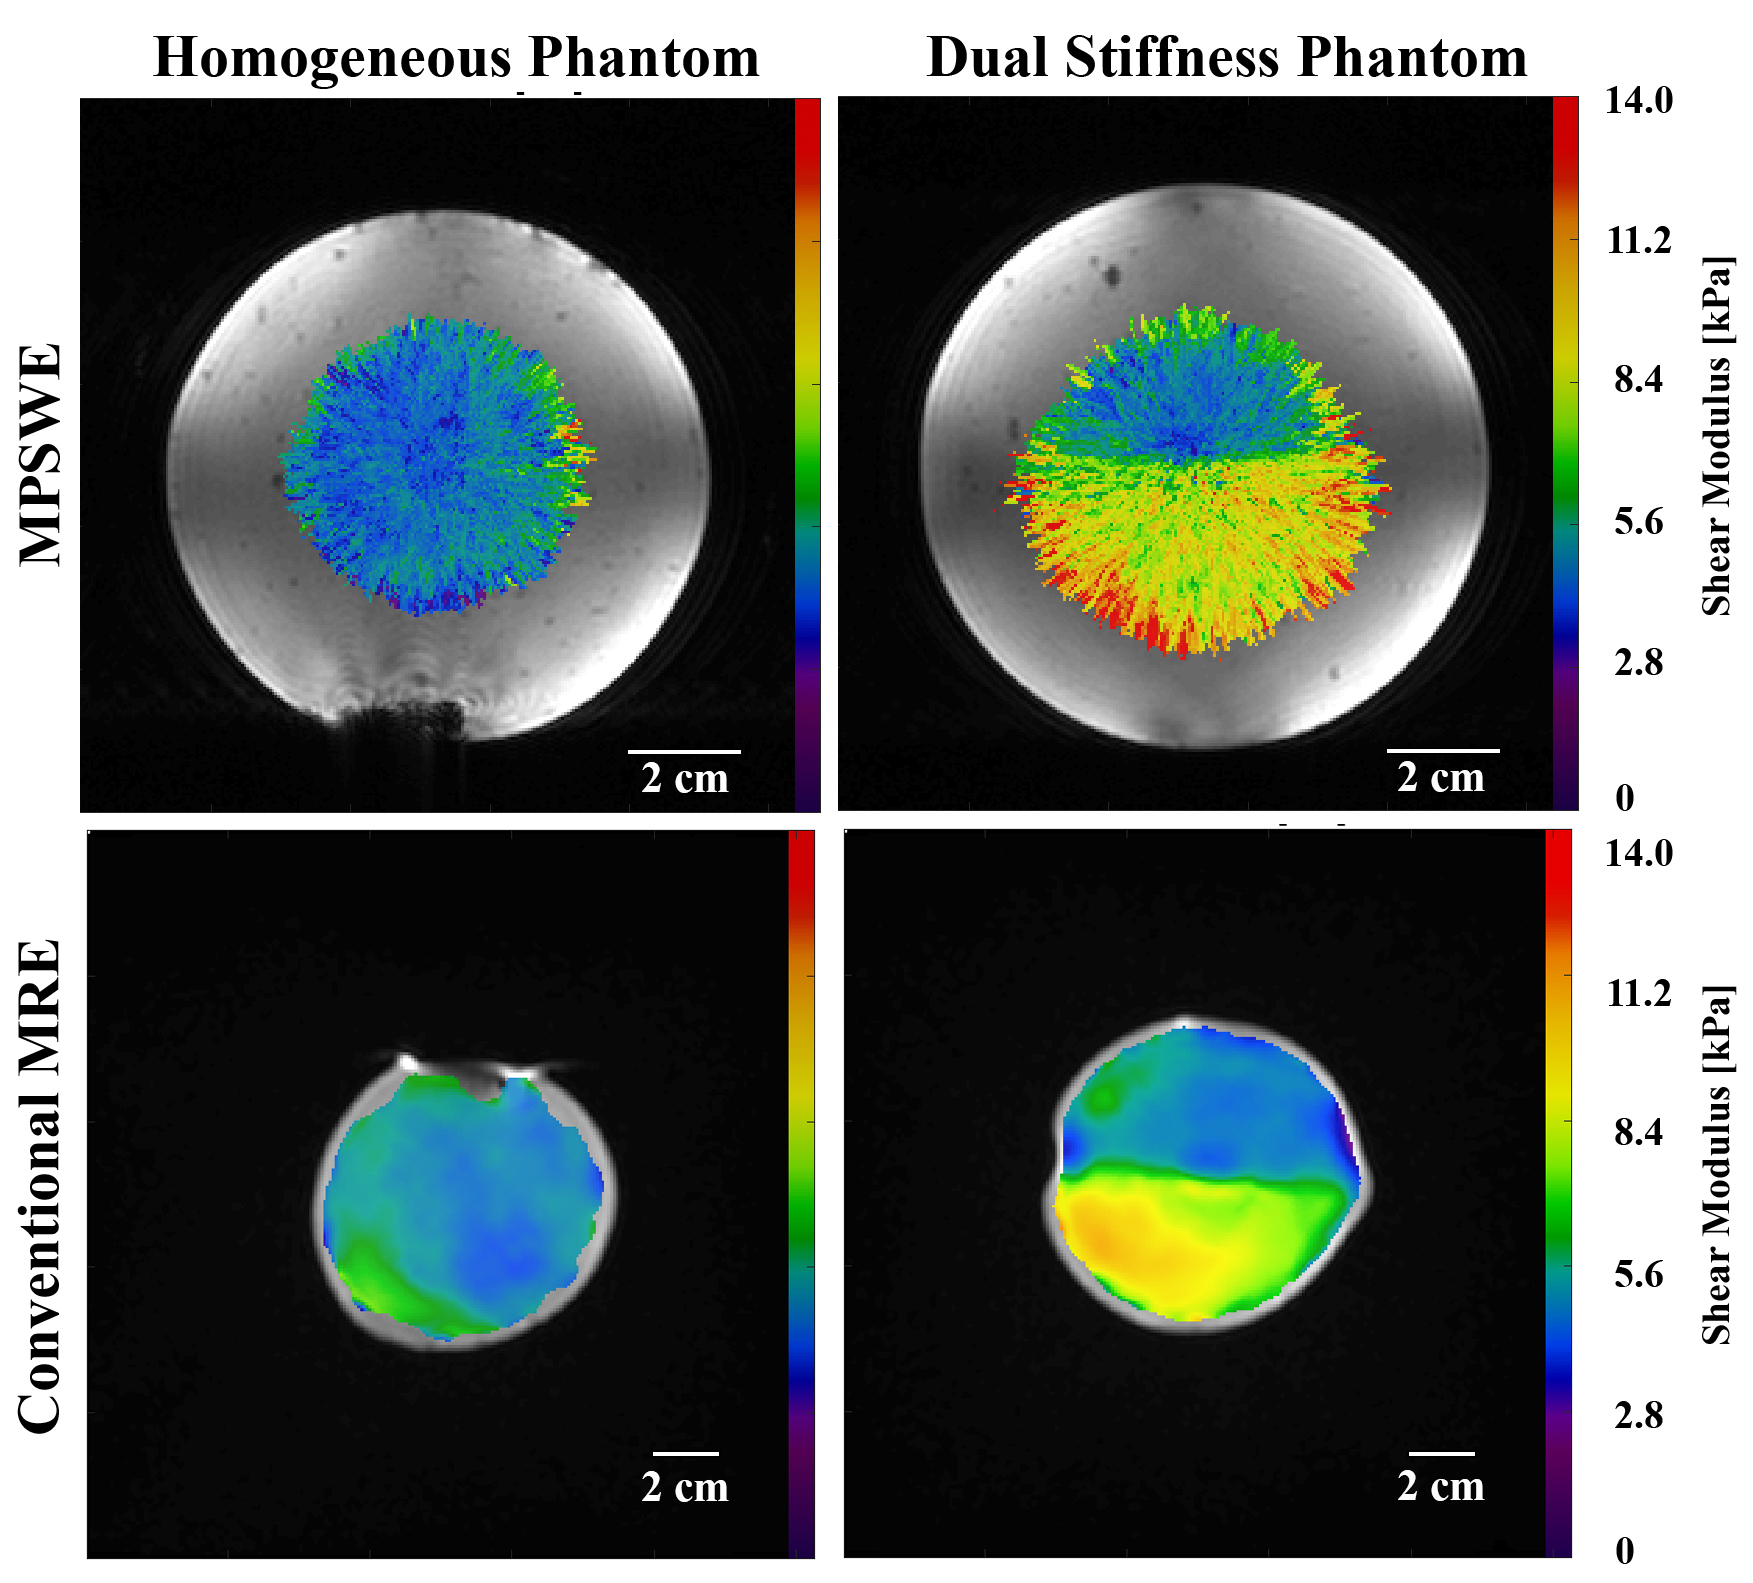
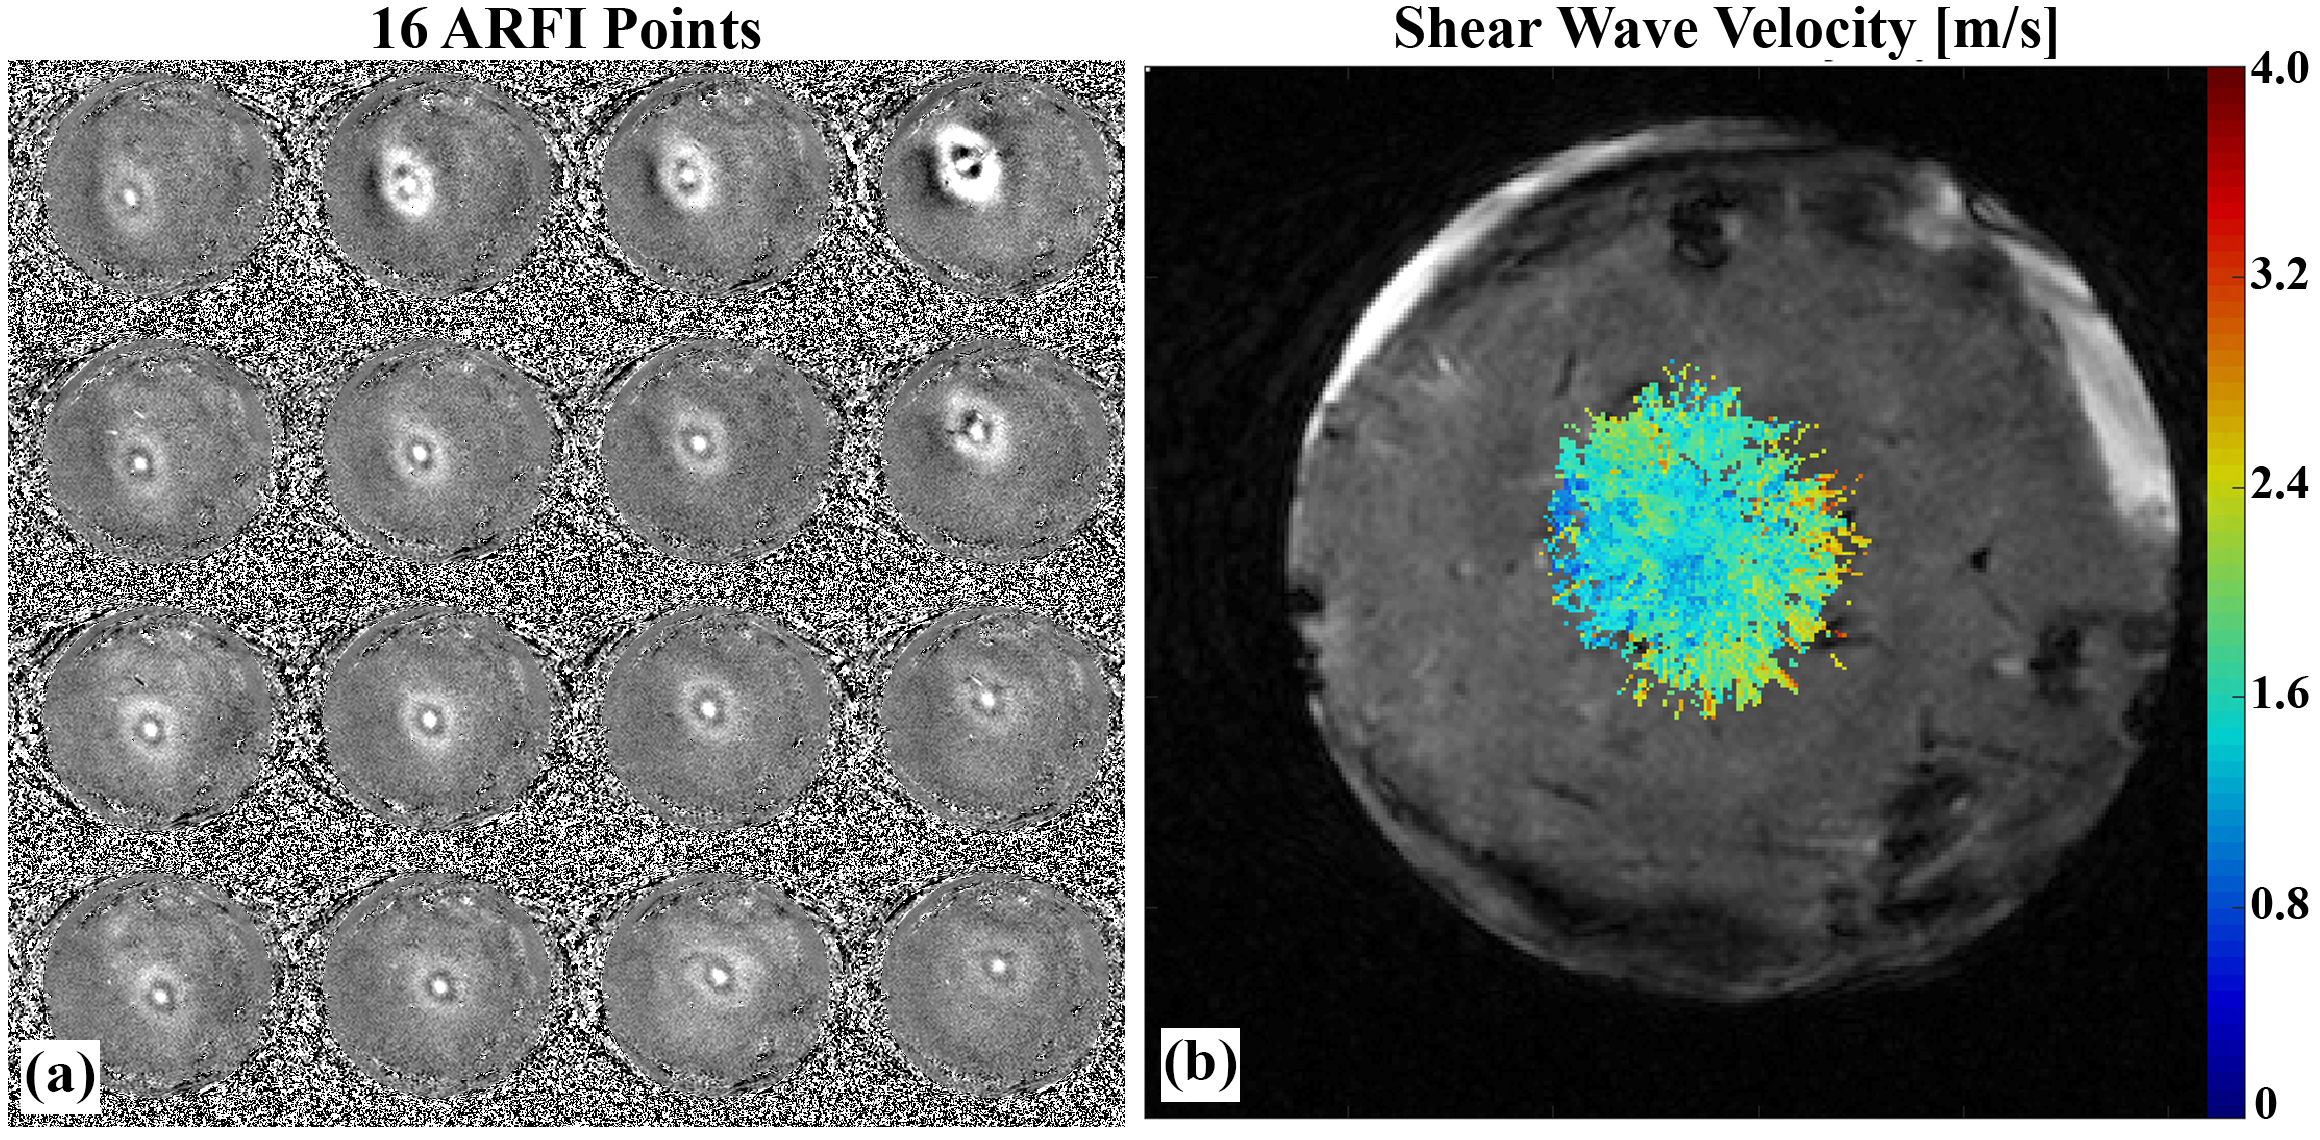
Phantom elastograms generated from MPSWE and MRE measurements are depicted in Figure 3. In the homogeneous phantom average shear stiffness was 4.95 and 5.24 kPa for MPSWE and MRE measurements, respectively. In the dual stiffness phantom average shear stiffness in the softer region was 5.01 and 4.85 kPa for MPSWE and MRE, respectively. Shear stiffness in stiffer region was 8.69 and 8.49 kPa, respectively. Figure 4 depicts MPSWE measurement in the ex-vivo bovine liver where the average shear wave velocity was 1.73 m/s (2.99 kPa shear stiffness).DISCUSSION & CONCLUSIONS:
We have developed a multiple-point shear wave elastography (MPSWE) technique that leverages the electronic steering capabilities of phased-array FUS systems. Phantom experiments demonstrate that MPSWE can delineate regions of differing stiffness. The average shear stiffness values agreed with conventional MRE measurements, to within 6%. Feasibility of MPSWE was also demonstrated in ex-vivo bovine liver and measured values are within the range of clinically reported shear wave velocities in human liver.8,9 Imaging time for the 3D volumetric acquisition was ~160 seconds. In 2D mode a 16-point measurements can be acquired in ~16 seconds. Single shot EPI could lead to further reductions in acquisition time. Since MPSWE uses the same hardware as MR-guided FUS therapies, is may be a promising tool to measure mechanical changes in tissue during FUS ablative therapies. Conventional MRE could also be used for this purpose; however, correctly positioning both the FUS system and the MRE driver simultaneously could complicate the setup.Acknowledgements
Funding by NIH R03EB023712, R01CA172787, and the Mark H. Huntsman Chair.References
1. Manduca A, Oliphant TE, Dresner MA, Mahowald JL, Kruse SA, Amromin E, Felmlee JP, Greenleaf JF, Ehman RL. Magnetic resonance elastography: Non-invasive mapping of tissue elasticity. Med Image Anal. 2001;5:237–254.
2. Mariappan YK, Glaser KJ, Ehman RL. Magnetic resonance elastography: a review. Clin Anat. 2010;23:497–511.
3. Sarvazyan AP, Rudenko O V, Swanson SD, Fowlkes JB, Emelianov SY. Shear wave elasticity imaging: a new ultrasonic technology of medical diagnostics. Ultrasound Med Biol. 1998;24:1419–35.
4. Wu T, Felmlee JP, Greenleaf JF, Riederer SJ, Ehman RL. MR imaging of shear waves generated by focused ultrasound. Magn Reson Med. 2000;43:111–115.
5. de Bever JT, Odéen H, Hofstetter LW, Parker DL. Simultaneous MR thermometry and acoustic radiation force imaging using interleaved acquisition. Magn Reson Med. 2017;00:00–00;
6. Odéen H, Bever J De, Hofstetter LW, Parker DL. Efficiency improvement in multi-point MR acoustic radiation force impulse imaging. In: Proceedings of International Society for Magnetic Resonance in Medicine. Honolulu; 2017. p. 1172.
7. Farrer AI, Odéen H, de Bever J, Coats B, Parker DL, Payne A, Christensen DA. Characterization and evaluation of tissue-mimicking gelatin phantoms for use with MRgFUS. J Ther Ultrasound. 2015;3:9.
8. Mueller S, Sandrin L. Liver stiffness: a novel parameter for the diagnosis of liver disease. Hepat Med. 2010;25;2:49–67.
9. Cassinotto C, Lapuyade B, Mouries A, Hiriart J-B, Vergniol J, Gaye D, Castain C, Le Bail B, Chermak F, Foucher J, Laurent F, Montaudon M, De Ledinghen V. Non-invasive assessment of liver fibrosis with impulse elastography: Comparison of Supersonic Shear Imaging with ARFI and FibroScan. J Hepatol. 2014;61:550–557.
Figures