4041
The effect of k-space weighted image contrast (KWIC) and ultrasound focus size on the accuracy of proton resonance frequency (PRF) thermometry1Utah Center for Advanced Imaging Research, Salt Lake City, UT, United States
Synopsis
Stack of stars acquisitions with k-space weighted image contrast (KWIC) reconstruction provide an effectively high temporal resolution with high spatial resolution. The effective temporal resolution of KWIC reconstructions depend on the size of the object of interest. This abstract investigates the relationship between ultrasound focus size, the size of the KWIC window, and the accuracy/precision of PRF temperature measurements.
Introduction
The benefits of using stack of stars acquisitions in MR thermometry have been recently demonstrated (1,2). Svedin et al (2) demonstrated that a sliding k-space weighted image contrast (KWIC) window can increase the temporal resolution of radial acquisitions while maintaining high frequency information for use in MR thermometry. This work investigates the effect of the KWIC window and the ultrasound focus size on the accuracy of proton resonance frequency (PRF) thermometry.Methods
Ultrasound Simulation
Sonications for a breast-dedicated focused ultrasound transducer (3) propagating into a gelatin phantom (4) were modeled with 0.33-mm isotropic resolution and 181x181x240 matrix size using the hybrid angular spectrum method (5). Three different ultrasound trajectories were simulated by electronically steering the focus to multiple locations where each location received an equal fraction of the total power (see Figure 1). Simulated heating (30 s) and cooling (30 s) temperatures were calculated for each trajectory using a finite-difference time-domain solver (dt = 100 ms) of the Pennes model (6). Simulated temperature data were then downsampled to 1-mm isotropic resolution by taking the Fourier transform, cropping the data, and inverse Fourier transform.
k-Space Simulation & Reconstruction
The image domain used to create the simulated k-space was a uniform box with value one and size 120x120x16 mm. A uniform box was chosen to reduce the effects of radial undersampling (streaking) in order to isolate the effects of KWIC window size and focus size. k-Space data for each ultrasound heating and cooling were simulated on a TR basis for a linearly rotated SOS sequence (7) with a pseudo-golden angle increment θ = (1-233/377)*180° ≈ 68.753°, (1 mm isotropic, TE/TR = 7.5/10 ms, FOV = 320x320x16 mm, Matrix Size = 320x320x16). The phase of the box was adjusted each TR in accordance to the amount of PRF temperature change. The image was then converted to a full SOS k-space using gpuNUFFT (8) and only the radial view corresponding to the TR was kept. This was repeated for a total of 6000 TRs to cover the entire simulated heating and cooling. Baseline (before heating) k-space were also simulated before the heating for 377*16*2=12064 TRs. Complex white gaussian noise was then added to the simulated k-space.
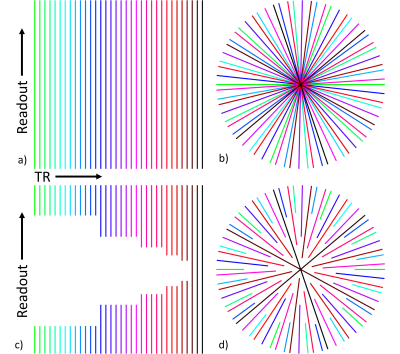
Images were reconstructed with and without noise using three different sizes of sliding KWIC windows and the method described in (2). All three KWIC windows had 13 projections through the center with 144, 233 or 377 total projections in each plane and the sliding window advanced 13 projections between reconstructed time points. An example of how the KWIC window works is shown in Figure 2. PRF temperature data were calculated using the trajectory-matched baseline method (2).
Results
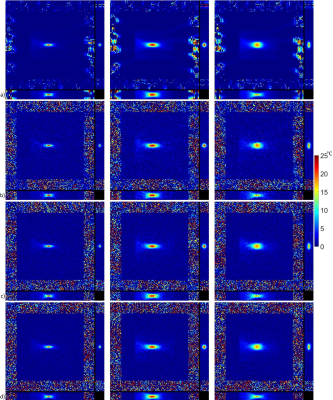
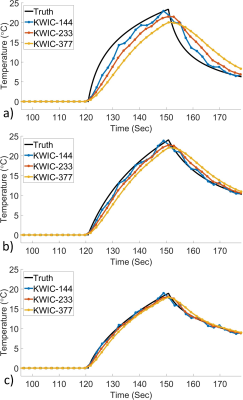
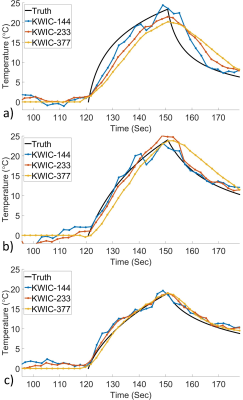
Temperature maps for the hottest time point for each KWIC window size is shown in Figure 3. Temperature versus time plots at the hottest voxel for each of the KWIC window and focus sizes are shown without noise in Figure 4 and with simulated noise in Figure 5.Discussion
Both the size of the ultrasound focus and size of the KWIC window had an effect on the accuracy of the measured temperature. A smaller KWIC window has a smaller temporal footprint and naturally would display less temporal blurring, but a smaller window will also display more undersampling artifacts, as seen in Figure 4, and would have a lower SNR due to averaging over fewer points as seen in Figure 5. Larger objects contain most of their information in the central regions of k-space, which is advantageous for a KWIC style reconstruction. The largest KWIC window and smallest focus size (Figure 4a) underestimated the maximum temperature and had a large response delay to a change in temperature. Both of the five focal point simulations were roughly the same size (by volume), but the five points in a line provided a better shape for the KWIC reconstruction (Figure 4c) because it created a larger size in the KWIC plane.Conclusion
The most accurate temperature estimates from a KWIC reconstruction will be when the KWIC window is as small as possible and the focus size is large in the KWIC plane. A smaller KWIC window will also result in more significant undersampling artifacts and lower SNR. Therefore, both the accuracy due to temporal blurring and precision due to undersampling and SNR must be taken into consideration when reconstructing the data using a KWIC sliding window.Acknowledgements
No acknowledgement found.References
1. Jonathan SV, Grissom WA. Volumetric MRI thermometry using a three-dimensional stack-of-stars echo-planar imaging pulse sequence. Magn Reson Med 2017.
2. Svedin BT, Payne A, Bolster BD, Jr., Parker DL. Multiecho pseudo-golden angle stack of stars thermometry with high spatial and temporal resolution using k-space weighted image contrast. Magn Reson Med 2017.
3. Farrer AI, Almquist S, Dillon CR, Neumayer LA, Parker DL, Christensen DA, Payne A. Phase aberration simulation study of MRgFUS breast treatments. Med Phys 2016;43(3):1374-1384.
4. Farrer AI, Odeen H, de Bever J, Coats B, Parker DL, Payne A, Christensen DA. Characterization and evaluation of tissue-mimicking gelatin phantoms for use with MRgFUS. J Ther Ultrasound 2015;3:9.
5. Vyas U, Christensen D. Ultrasound beam simulations in inhomogeneous tissue geometries using the hybrid angular spectrum method. IEEE Trans Ultrason Ferroelectr Freq Control 2012;59(6):1093-1100.
6. Pennes HH. Analysis of tissue and arterial blood temperatures in the resting human forearm. J Appl Physiol 1948;1(2):93-122.
7. Zhou Z, Han F, Yan L, Wang DJ, Hu P. Golden-ratio rotated stack-of-stars acquisition for improved volumetric MRI. Magn Reson Med 2017.
8. Knoll F, Scharzl A, Diwoky C, Sodickson D. gpuNUFFT - An Open-Source GPU Library for 3D Gridding with Direct Matlab Interface. Proc Intl Soc Mag Reson Med 2014:4297.
Figures


