4038
Bloch simulation-based correction for 2D VFA T1 mapping for fat MR thermometry1Imaging Division, University Medical Center Utrecht, Utrecht, Netherlands
Synopsis
For MR-HIFU thermal therapies, specifically in the breast, MR temperature mapping both in aqueous and fatty tissues is desired, as it would improve treatment monitoring compared to MR thermometry in aqueous tissues only. Fat thermometry based on T1-mapping with 2D variable flip angle method offers high temporal resolution; however, 2D T1 mapping suffers from systematic errors caused by non-rectangular 2D slice profile. We propose a Bloch simulation-based 2D T1 correction technique to improve the accuracy of 2D T1 measurements. We demonstrate the proposed correction on simulated and experimental data.
Introduction
A dedicated breast MRI-guided High Intensity Focused Ultrasound (MR-HIFU) system holds promise for thermal ablation of breast tumors.1 Currently, the temperature is monitored during treatment by proton resonance frequency shift-based (PRFS) thermometry in aqueous tissue. However, fatty tissue is often found near the tumor and in some cases the tumor may be totally embedded in fat. MR temperature mapping both in the tumor and in fat is desired, as it would allow adequate ablation of tumor margins and improve treatment monitoring. Several approaches for simultaneous water and fat thermometry have been proposed.2,3
Since fat resonance frequency does not depend on temperature, relaxation parameters can be used for fat thermometry.4 One choice is T1-based fat thermometry using 2D variable flip angle (VFA) method;2,3 it is fast and easily combined with PRFS method. However, T1 cannot be accurately calculated from 2D VFA measurements, because 2D slice excitation results in varying flip angle along the slice-select direction. Therefore, 2D VFA T1 measurements are not only tissue and temperature dependent but also depend on the applied RF pulse, flip angles and repetition time.
One method for correcting 2D VFA T1 values is to substitute a nominal flip angle for an apparent flip angle in T1 calculation.2,3 However, since the signal dependence on flip angle throughout the slice is not linear errors arise when the flip angle variation throughout the slice is large.5
We propose another 2D VFA T1 correction mechanism based on Bloch simulations. First, 2D MR signals are simulated for a range of actual T1 values and for a selected pair of flip angles. These signals are used to calculate simulated 2D VFA T1. The relationship between actual T1 and simulated 2D VFA T1 is used for correcting experimentally acquired 2D VFA T1.
Methods
Simulations were performed based on Bloch’s equations (similar to the work by Svedin et al.5) with a modeled sinc-gaus rf pulse and TR/TE=22/3.1 ms. Signal slice profiles were simulated for flip angles $$$1^\circ$$$ to $$$90^\circ$$$ with $$$1^\circ$$$ increment and for T1 values 100 to 1100 ms with 50 ms increment.
To validate the simulations, we acquired 2D SPGR scans (sinc-gauss rf pulse, TR/TE=22/3.1 ms, voxel size 2.5x2.5x7 mm3). A phantom (TO5, Eurospin II test system, Scotland) with 12 gel tubes with calibrated T1 values was scanned on a 1.5T MR scanner (Philips Achieva, Best, The Netherlands). Scans were acquired for flip angles $$$1^\circ$$$ to $$$90^\circ$$$ deg with $$$1^\circ$$$ increment. In-plane flip angle variations were corrected using a 3D B1 map acquired using variable TR method (TR1,2=30,150 ms).
Optimal flip angles for T1 mapping were calculated 6 and set to $$$11^\circ$$$ and $$$65^\circ$$$.
2D T1 values were calculated at two flip angles:6 $$$T1=-\frac{TR}{\log(k)}$$$, where $$$k =(\frac{S_2}{\sin\theta_2} –\frac{S_1}{\sin\theta_1} )/(\frac{S_2}{\tan\theta_2} –\frac{S_1}{\tan\theta_1} ) $$$ and $$$S_{1,2}$$$ are the simulated 2D signals. The relationship between actual T1 and 2D T1 was modeled as a quadratic function.
The corrected 2D T1 values were obtained by substituting 2D T1 values into the quadratic function. 2D T1 values were acquired experimentally and from simulated data with noise added. A separate quadratic function was calculated for every gel tube in experimental data because of in-slice B1 variations.
For comparison, flip angle correction for 2D T1 calculation, similar to the correction proposed by Todd et al.3 was performed.
Results
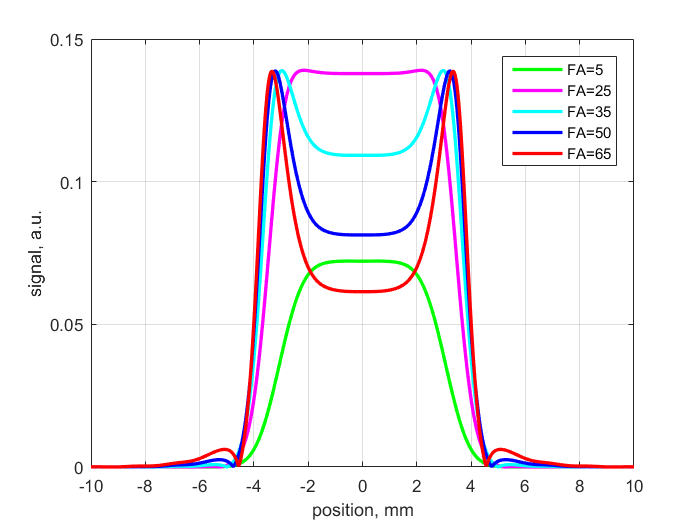
Examples of simulated signal slice profiles are shown in Figure 1. The degree of accuracy of the simulation is shown in Figure 2, where simulated and experimental signals at flip angles from $$$1^\circ$$$ to $$$90^\circ$$$ are compared for four different T1 values; theoretical steady-state signal is shown for comparison.
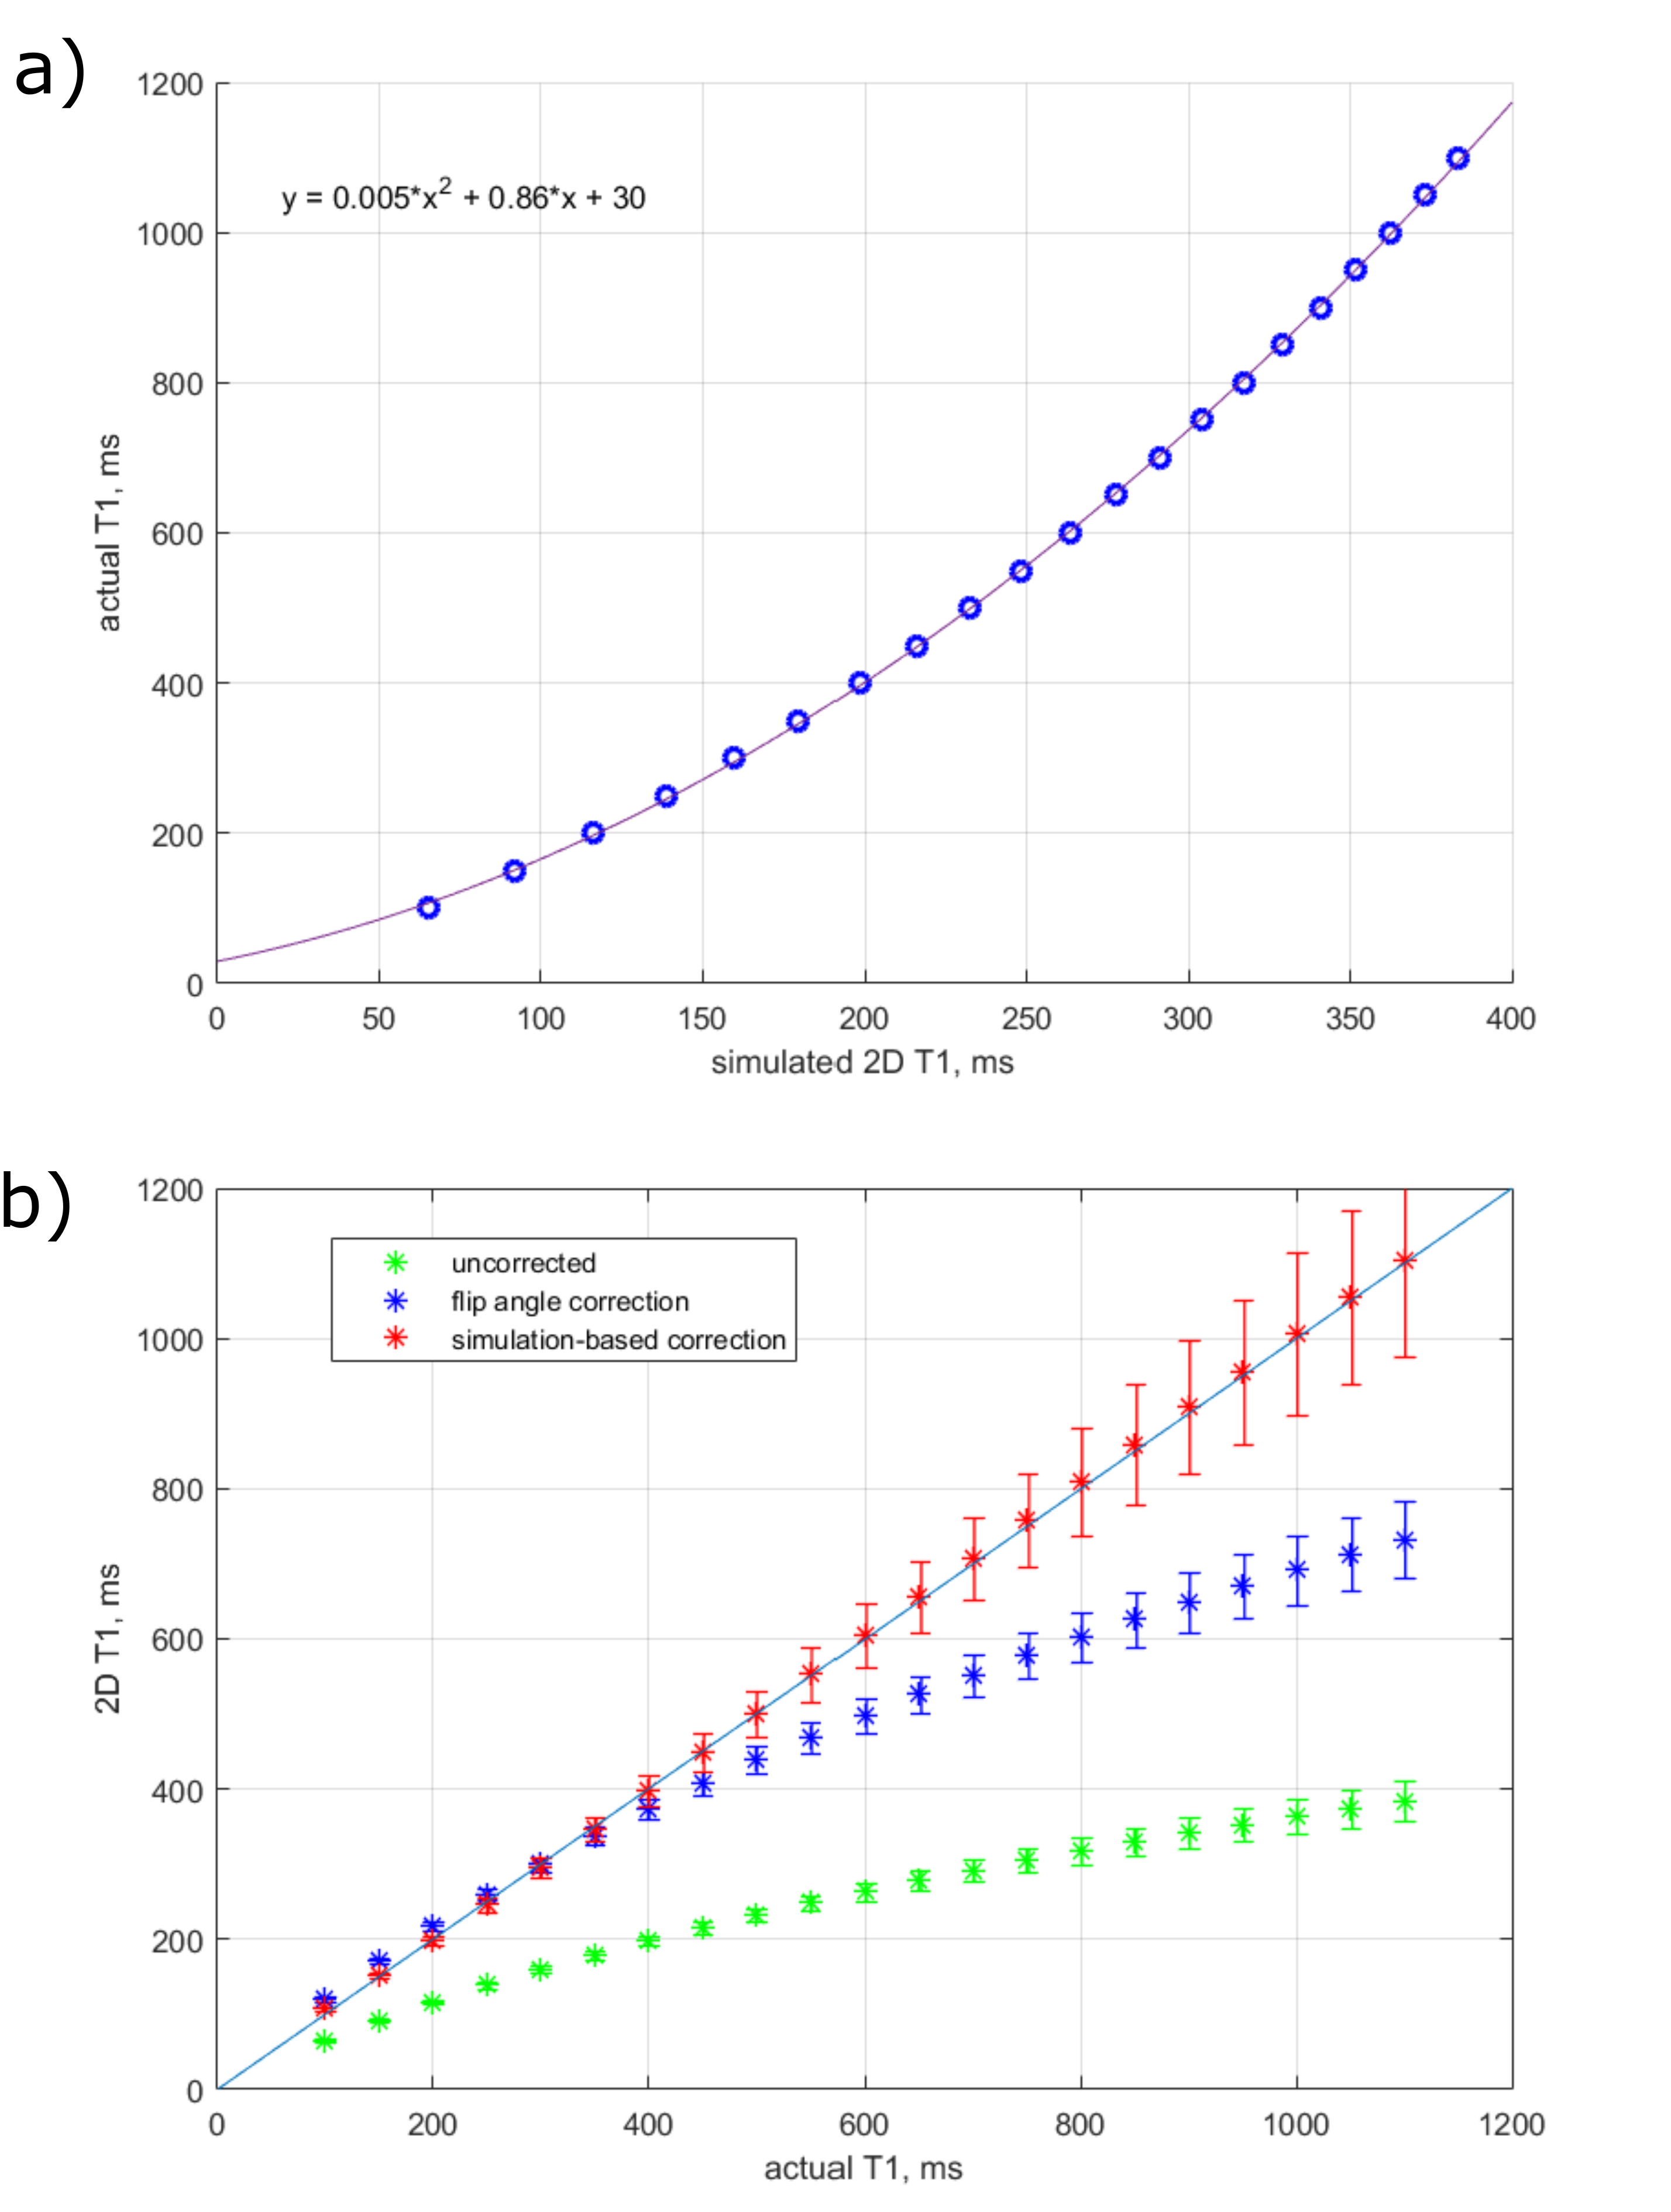
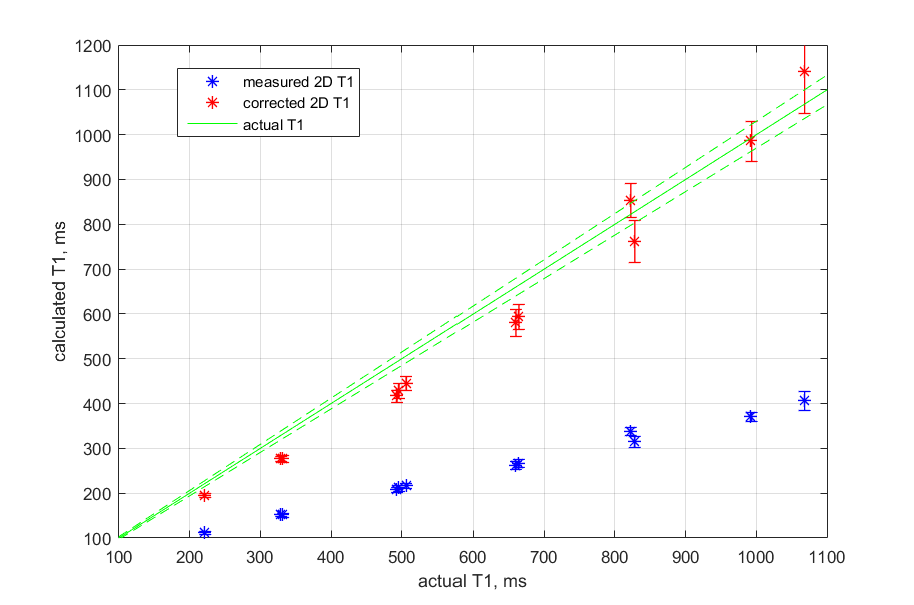
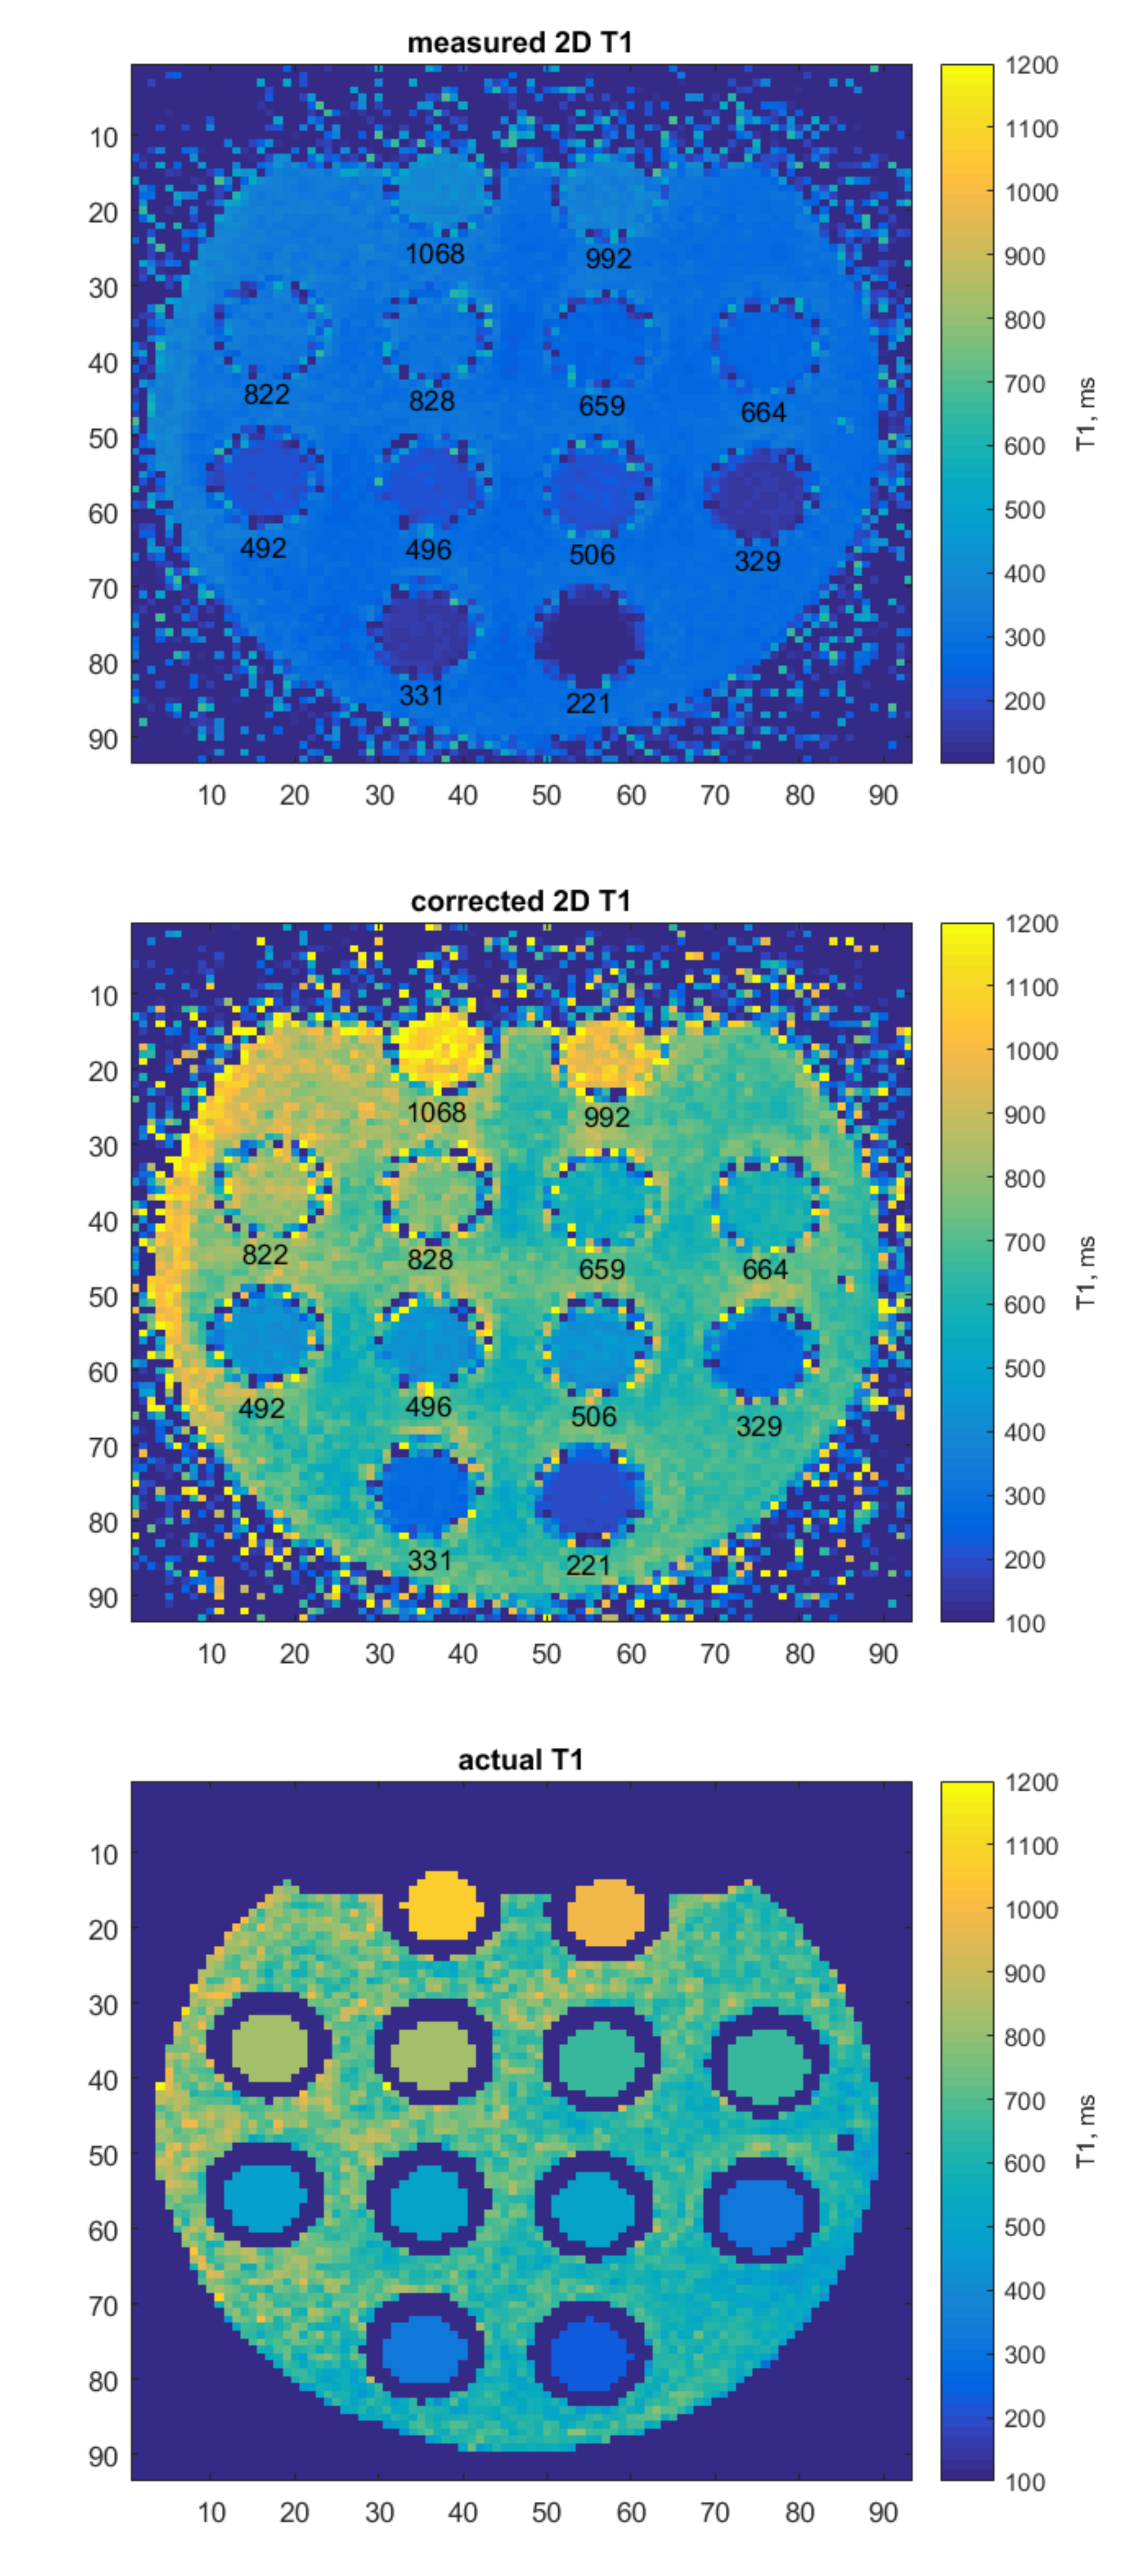
Figure 3a shows an actual T1 relationship with simulated 2D T1. Figure 3b shows corrections of 2D T1 values, calculated from noisy simulated data. Correction for experimental 2D T1 values of 12 gel tubes is shown in Figure 4. Measured and corrected 2D T1 maps from the experimental data are shown in Figure 5.
Discussion
We have demonstrated that our simulation-based correction method gives accurate corrected 2D T1 values for noisy simulated data for actual T1 values in the range of 100 to 1100 ms, while flip angle correction is accurate in smaller (100-400 ms) interval (Figure 3b). However, with increasing actual T1 values, the precision in corrected 2D T1 values goes down. For fat MR thermometry expected T1 values are below 600 ms,4 where T1 errors would correspond to about $$$\pm5^\circ C$$$.
For experimental 2D T1 correction, errors might also come from the (small) differences between experimental and simulated signals (Figure 2), and from errors in estimating in-plane B1 variations.
Acknowledgements
No acknowledgement found.References
1. Merckel LG, Bartels, LW, Kohler MO et al. MR-guided high-intensity focused ultrasound ablation of breast cancer with a dedicated breast platform. CardioVascular and Interventional Radiology, 2013;36(2), 292–301.
2. Hey S, De Smet M, Stehning C, et al. Simultaneous T1 measurements and proton resonance frequency shift based thermometry using variable flip angles. Magnetic Resonance in Medicine, 2012;67(2),457–463.
3. Todd N, Diakite M, Payne A, et al. Hybrid proton resonance frequency/T1 technique for simultaneous temperature monitoring in adipose and aqueous tissues. Magnetic Resonance in Medicine, 2013;69(1),62–70.
4. Baron P, Deckers R, Knuttel FM, et al. T1 and T2 temperature dependence of female human breast adipose tissue at 1.5 T: Groundwork for monitoring thermal therapies in the breast. NMR in Biomedicine, 2015;28(11),1463–1470.
5. Svedin BT and Parker DL. Technical Note: The effect of 2D excitation profile on T1 measurement accuracy using the variable flip angle method with an average flip angle assumption. Medical Physics. 2017
6. Deoni SCL, Rutt BK and Peters TM. Rapid combined T1 and T2 mapping using gradient recalled acquisition in the steady state. Magnetic Resonance in Medicine, 2003;49(3),515–526.
Figures