4036
Measurement of Focal Laser Ablation Zones in Prostate Cancer using High Resolution Spectroscopic Imaging of the Water Resonance1Radiology, University of Chicago, Chicago, IL, United States, 2Urology, University of Chicago, Chicago, IL, United States
Synopsis
MRI-guided Focal laser ablation (FLA) is used to treat prostate cancer. Contrast enhanced imaging can assess the ablated region, but cannot be used during ablation due to effects of high energy ultrasound on MRI contrast agent stability. Our results show that high resolution MR spectroscopic imaging of the water resonance detects changes in T2* and water resonance peak amplitude that clearly delineate the ablation zone without contrast agent injection. Ablation zones measured by MR spectroscopic imaging are consistent with contrast enhanced images. This suggests that MR spectroscopic imaging can guide FLA during ablation to dynamically optimize treatment and improve outcomes.
Introduction
MRI-guided focal laser ablation (FLA) allows minimally invasive treatment of low-risk prostate cancer1-2. Contrast enhanced imaging is used to assess the ablation zone after the completion of ablation. However, contrast enhanced imaging cannot be used during the ablation procedure because high energy ultrasound may de-stabilize MRI contrast agents. Use of MRI without contrast media injection to measure the ablation zone during treatment would enable the physicians to better plan the location of subsequent ablations and improve outcomes for patients. In this study, we evaluated the feasibility of high resolution MRI spectroscopic imaging of the water resonance with EPSI3 (echo-planar spectroscopic imaging) to identify the ablation zone after FLA of prostate cancer.Methods
Fourteen patients (mean age=61 years, range 51-71 years) with biopsy-confirmed low-intermediate risk, localized prostate cancers were recruited in this Institutional Review Board approved study. The inclusion criteria were: prostate specific antigen (PSA) <15 ng/ml; clinical stage T1c-T2a. The mean PSA was 4.2 ng/mL (range 0.9–8.9 ng/mL). Prostate cancer was diagnosed about three months before FLA. The MR imaging and ablation were performed under monitored conscious sedation on a 1.5 T scanner. High resolution T2-weighted images were acquired for fiducial localization and laser fiber placement. For spectroscopic images, axial multi-gradient echo (MEGE) images with free breathing were acquired (TR=1721 ms, first TE=3.4 ms, subsequent echo spacing=3.2 ms, number of echoes=20, flip angle=25o, FOV=304×380×92 mm3, in-plane resolution=2.3×2.3×3.8 mm3, number of slices=23, NA=1, scan time=115 s) before and after the last ablation, and before the contrast agent injection. After ablation, T1-weighted (T1W) images were acquired before and after contrast injection. T2* relaxation time was calculated from MEGE images using a mono-exponential signal decay model. After Fourier transform of the complex datasets from MEGE data, the water peak height (WPH) was calculated from each spectrum in each pixel. The ablation area was calculated using a region based active contour method4-5 on T2*, WPH and post-contrast T1W images. The ablation area for each slice was calculated by the number of pixels multiplied by the pixel resolution. The ablation volume for each slice was determined by multiplying the slice thickness by ablation area. Then all the slice volumes were added together to estimate the final ablation volume. Pair-wise Wilcoxon rank-sum tests were performed on pre- and post- ablation T2* values in tumor ROIs. Kruskal-Wallis (K-W) tests were performed to determine whether there was a significant difference in calculated ablation regions between T2*, WPH, and post-contrast T1W images. Pearson correlation and Bland-Altman analysis6 was performed to evaluate correlation and agreement between ablation volume calculated from T2* vs. post-contrast T1W and WPH vs. post-contrast T1W images. A p-value less than 0.05 was considered significant.Results
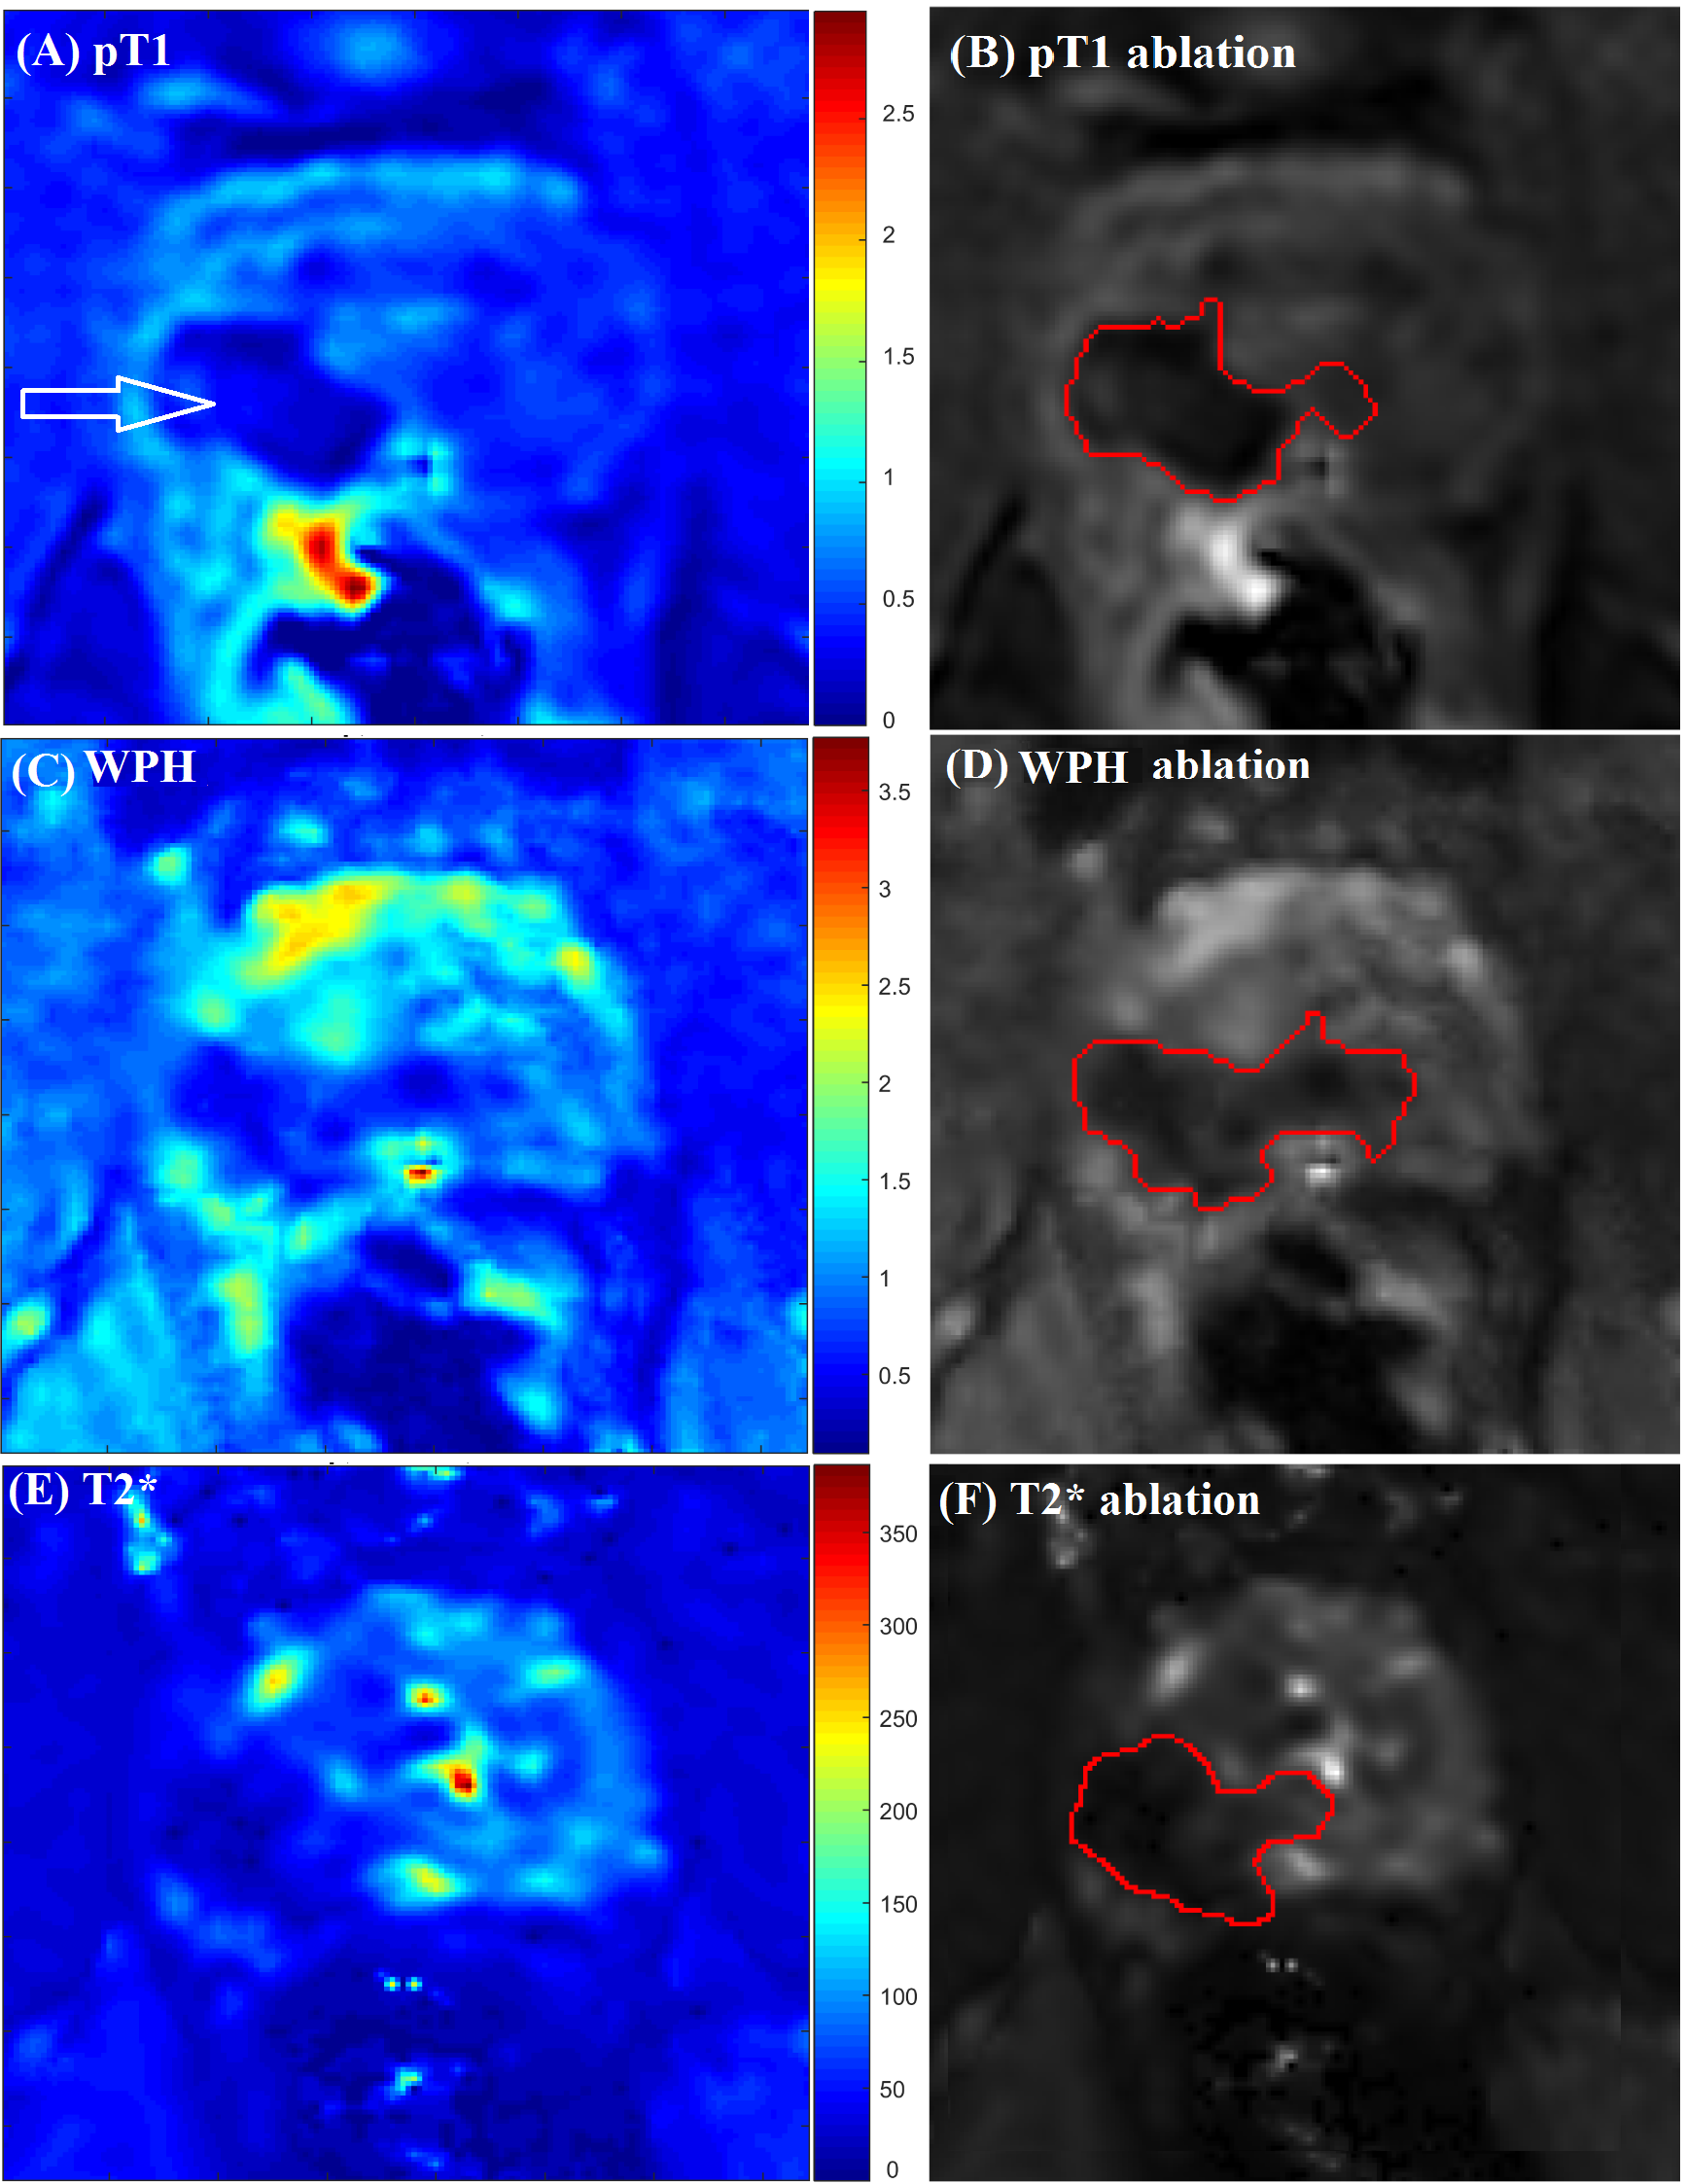
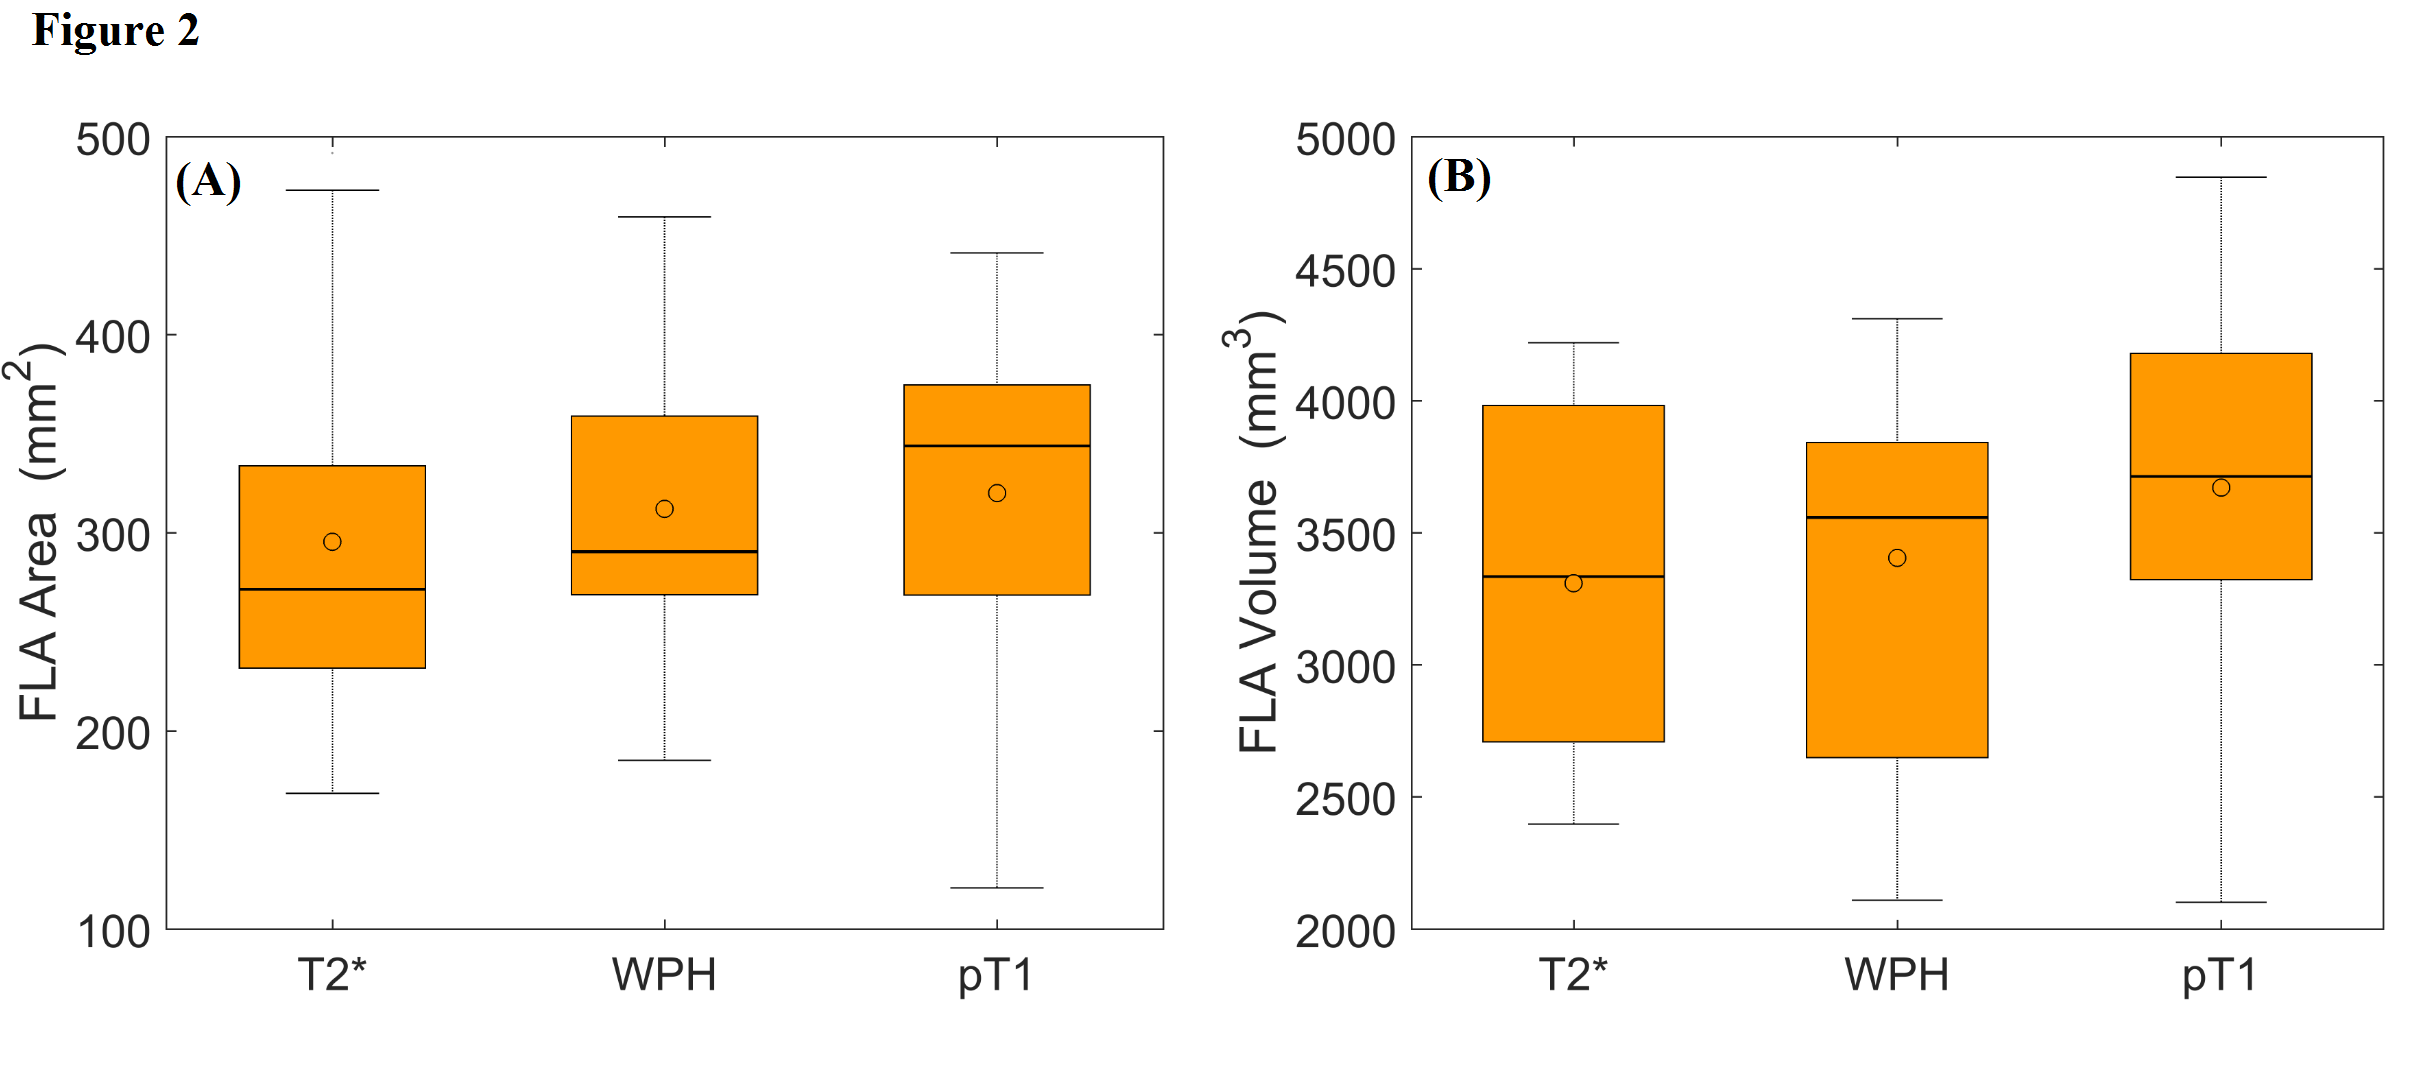
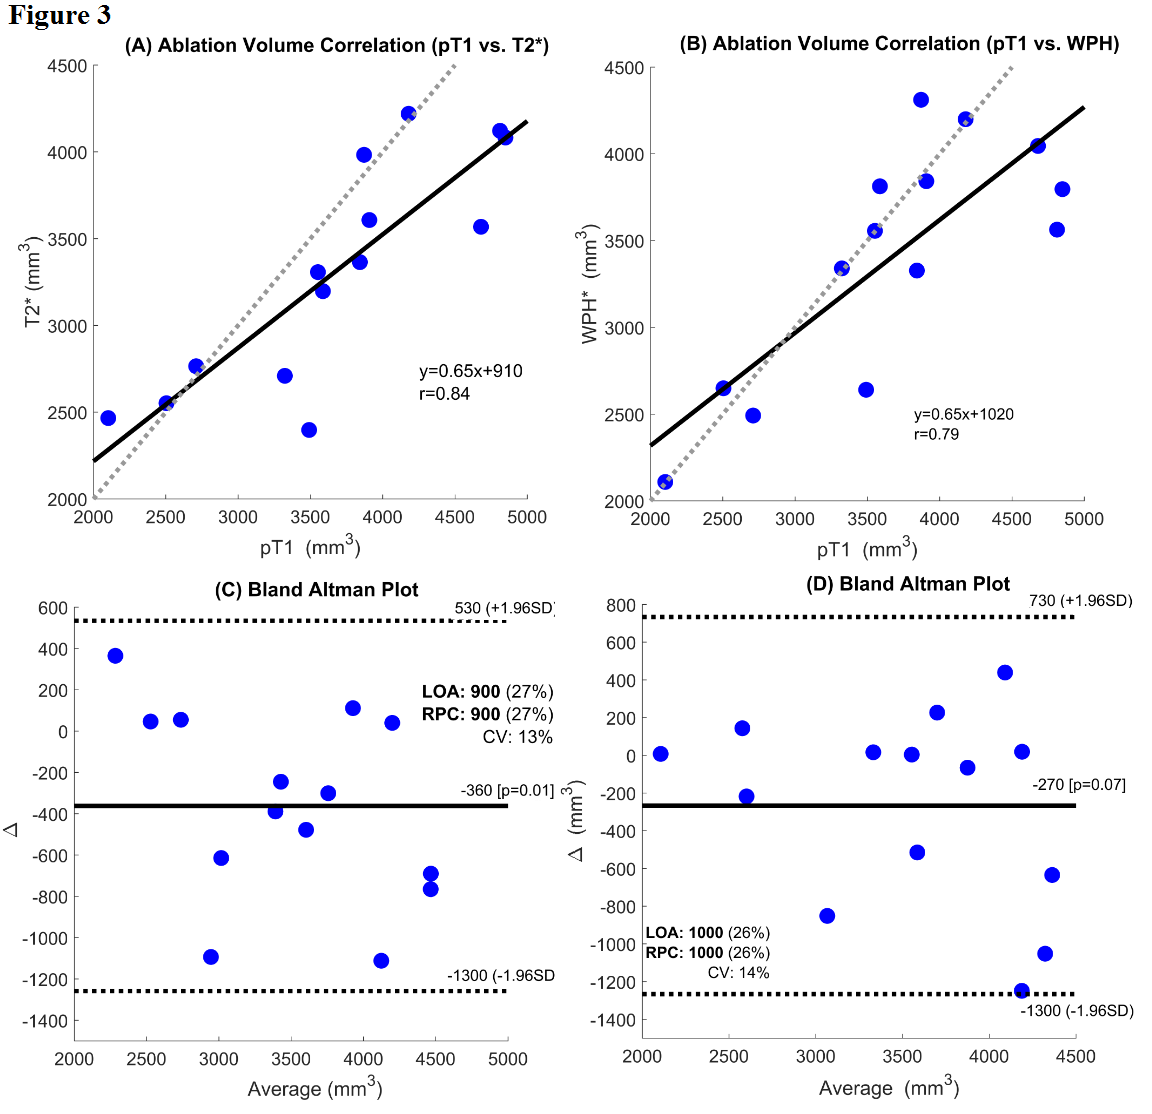
Figures 1 (A), (C), and (E) show examples of post-ablation, post-contrast T1W, WPH, and T2* images. Figures 1 (B), (D) and (F) show segmentation of the ablation regions using active contour methods on corresponding images. The average T2* in the ablation area (38.9±14.1 ms) was significantly shorter (19 ms; p=0.03) than T2* pre-ablation (57.8±25.3 ms). The normalized WPH value over the ablation area (1.3±0.6) was significantly decreased (35%; p=0.02) compared to the pre-ablation area (2.0±0.9). Figure 2 (A) shows boxplots of maximum ablation areas measured in T2* (295.7±96.4 mm2), WPH (312.2±63.0 mm2) and post-contrast T1W (320.3±82.9 mm2) images. Average volume of ablation zones were 3310.5±649.5, 3406.4±684.9, and 3672.5±832.4 mm3 in T2*, WPH, and post-contrast T1W images, respectively (see box plots in Figure 2 B). Kruskal-Wallis tests showed no significant difference (p=0.52 and p=0.31 for area and volume, respectively) between the three types of images. Figure 3 shows scatter plots of total ablation volumes: (A) T2* vs. post-contrast T1W images, and (B) WPH vs. post-contrast T1W images. There were strong positive linear correlations between the ablation volumes measured between T2* vs. post-contrast T1W (r=0.83) and WPH vs. post-contrast T1W (r=0.79) images. The corresponding Bland-Altman plots (C) and (D) show good agreement between ablation volumes measured from T2* vs. post-contrast T1W and WPH vs. post-contrast T1W images.Conclusions
The results demonstrate that ablation volumes measured from MEGE images were very close to those measured in post-contrast T1W images. This suggests that T2* and WPH images can be used to evaluate ablation zones during the FLA procedure without contrast agent injection. This allows repeated assessment following each heating period so that subsequent ablations can be optimized to improve outcomes for patients.Acknowledgements
This research is supported by NIH R21CA173751-01 and NIH R01 CA172801-01.References
1. Lee T, Mendhiratta N, Sperling D, Lepor H. Focal laser ablation for localized prostate cancer: principles, clinical trials, and our initial experience. Rev Urol. 2014;16(2):55-66. PMCID: 4080850.
2. Oto A, Sethi I, Karczmar G, McNichols R, Ivancevic MK, Stadler WM, et al. MR imaging-guided focal laser ablation for prostate cancer: phase I trial. Radiology. 2013;267(3):932-40.
3. Medved M, Li H, Abe H, Sheth D, Newstead GM, Olopade OI, et al. Fast bilateral breast coverage with high spectral and spatial resolution (HiSS) MRI at 3T. J Magn Reson Imaging. 2017;46(5):1341-8.
4. Chan TF, Vese LA. Active contours without edges. IEEE Trans Image Process. 2001;10(2):266-77.
5. Lankton S, Tannenbaum A. Localizing region-based active contours. IEEE Trans Image Process. 2008;17(11):2029-39. PMCID: 2796112.
6. Bland JM, Altman DG.
Statistical methods for assessing agreement between two methods of clinical
measurement. Lancet. 1986;1(8476):307-10.
Figures