4035
Improved MR thermometry during Microwave ablation by correcting for sporadic electromagnetic interference1Radiology, Mayo Clinic, Rochester, MN, United States
Synopsis
Image-guided microwave ablation (MWA) is a minimally invasive treatment for localized diseases. MRI is advantageous for localizing the lesions, guiding microwave antennae placement, and assessing the extent of ablation. Monitoring of MWA in real-time using MR thermometry has also been demonstrated to be feasible, but can suffer from the image quality degradation due to electromagnetic interference (EMI) from the microwave generator (MWG). A novel approach to correct for EMI-contaminated images is presented here by utilizing the uncontaminated k-space data from neighboring frames. Significantly improved temperature and thermal dose maps have been obtained in our clinical patient studies.
Introduction
Microwave ablation (MWA) is a minimally invasive treatment for localized diseases.1-3 Image guidance is critical in MWA due to rapid heating rates and high temperatures generated. MRI is advantageous for localizing the diseased tissues and guiding microwave antennae placement, as well as assessing the extent of ablation. The feasibility of real-time monitoring of MWA using proton resonance frequency shift (PRFS) thermometry has also been demonstrated.2-4 However, in our practice, wide adoption of PRFS techniques in clinical MWA is hindered by the image quality degradation due to electromagnetic interference (EMI) from the microwave generator (MWG). During the ablations, as tissue conditions change, MWG automatically adjusts its output frequency and duty cycle, which can lead to variable EMI patterns. In this work, we present an automated approach to correct for EMI-contaminated images by utilizing the uncontaminated k-space data from neighboring frames. Significantly improved temperature and thermal dose maps have been obtained in our clinical patient studies.Materials and methods
MR-guided MWA in the liver were performed with the patient under anesthesia with a MRI-configured AveCure system (MedWaves Inc., San Diego, CA) on a 1.5T scanner (Espree, Siemens Healthineers, Erlangen, Germany). IRB approval was obtained for all patient studies. A 2D FLASH sequence (TR/TE/FA/matrix/FOV/slice thickness = 20ms/12ms/15º/256×154/ 34cm/10mm) was used for MR thermometry. To minimize respiratory motion artifacts, scanning was manually synchronized with the patient’s respiratory cycle. With a 3s acquisition time, one frame was acquired in each cycle (6-8s) during expiration (4-5s). Real-time thermometry was obtained using a Visualase workstation (Medtronic, Minneapolis, MN) with a reference-based PRFS method.5 EMI-uncontaminated baseline frames were acquired before the microwave generator was turned on.
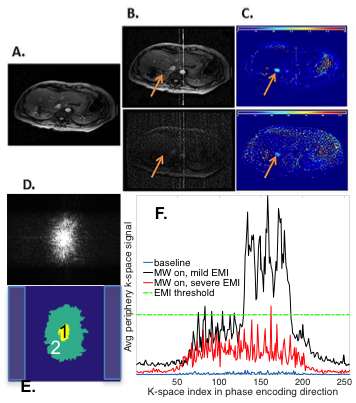
Typical EMI contamination is shown in Fig. 1B-C. To correct this, k-space data were regenerated from the magnitude and phase images using Matlab (Mathworks, Natick, MA). In the first baseline frame (Fig. 1D-E), the maximal signal, Smax, was found and two k-space regions, surrounding the k-space center, were established: region 1, containing points with signal greater than 10% of Smax, and region 2, containing points with signal greater than 1% of Smax. In the subsequent frames, k-space data were analyzed per phase-encoding line based on the average signal, Spe_avg, from 20 or so points outside region 2 (shaded regions in Fig. 1E). Data were considered as contaminated and requiring correction if the difference of Spe_avg between the current and the baseline frames exceeded an empirically determined threshold (e.g. 1% of Smax, Fig. 1F), or the value of at least one point outside region 2 exceeded 3% of Smax. The contaminated k-space lines were either completely or partially replaced using the most recent uncontaminated data at the same k-space locations from the previous frames. When the Spe_avg of a corrupted line was lower than a threshold (e.g, 1.5% of Smax), central k-space data within region 1 were retained. EMI-corrected images were then reconstructed from the resultant k-space data. The reference-based PRFS method was applied to corrected images to obtain temperature maps and thermal dose maps.6
Results and discussion
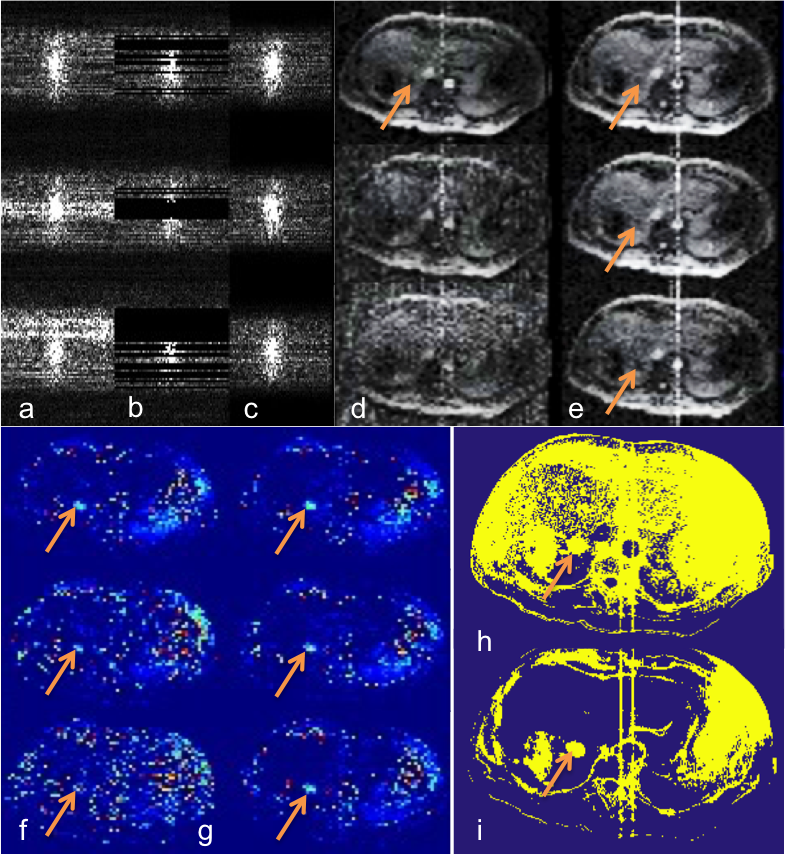
Fig. 2a shows the original k-space data from three consecutive frames during a liver MWA procedure with various degrees of EMI contamination. Figures 2b and 2c show the corresponding k-space data after removal of contaminated data and after correction, respectively. The effectiveness of the algorithm is shown in magnitude images (Fig. 2d-e) and thermal maps (Fig. 2f-g). The corrected thermal dose map (Fig. 2i) shows the treatment zone with greatly improved definition and higher clarity. The treatment zone is indicated by the arrows.
Replacing EMI corrupted k-space data could potentially alter the temporal resolution of the thermal maps. The nearest available uncorrupted data were mostly 1-2 frames (6-16s) away from the current frame in our experience. The expected signal change due to MWA-introduced temperature elevation is thus expected to be small. Consequently the error in MR thermometry introduced by the correction method is expected to be acceptable. This assumption was confirmed qualitatively in the ex vivo tissue experiment (results not shown). Further qualitative evaluation is underway. The use of proposed method was demonstrated using the reconstructed complex images. Use of the original k-space data is expected to be advantageous as advanced image reconstruction methods such as parallel imaging or compressed sensing can potentially be utilized to synthesize the removed data using uncorrupted data from the same frame.
Conclusion
Significantly improved MR thermometry has been demonstrated with the proposed method for EMI correction. This method can potentially be implemented to obtain real-time thermometry for monitoring clinical microwave ablation procedure and consequently improve patient outcome.Acknowledgements
No acknowledgement found.References
1. Brace CL. Microwave Tissue Ablation: Biophysics, Technology and Applications. Crit Rev Biomed Eng . 2010 ; 38(1): 65–78.
2. Chen JC,Moriarty JA, Peters RD, et al. Prostate Cancer: MR Imaging and Thermometry during Microwave Thermal Ablation-Initial Experience. Radiology 2000; 214:290-297.
3. Morikawa S, Inubushi T, Kurumi Y, et al. MR-Guided Microwave Thermocoagulation Therapy of Liver Tumors: Initial Clinical Experiences Using a 0.5T Open MR System. J. Magn. Reson. Imaging 2002;16:576–583.
4. Hindman JC. Proton Resonance Shift of Water in the Gas and Liquid States.J Chem Phys 1966; 44:4582-4592.
5. Rieke V, Butts Pauly K. MR thermometry. J Magn Reson Imaging 2008; 27:376-90.
6. Perez CA, Sapareto SA. Thermal Dose Expression in Clinical Hyperthermia and Correlation with Tumor Response/Control., Cancer Research (suppl.) 1984;44:4818-4825.
Figures