4034
Three-dimensional assessment of MRI-guided percutaneous liver ablation1Memorial Sloan Kettering Cancer Center, New York, NY, United States, 2Hunter College, New York, NY, United States
Synopsis
Here we present a 3D registration-based technique for assessment of ablative margins following MRI-guided thermal ablation. The method was developed and evaluated in a retrospective study of 26 MRI-guided cryo, laser or microwave ablations of various liver metastases.
Introduction
The wide adoption of image-guided thermal ablation (TA) of liver metastases (LM) has been impeded by the local tumor progression (LTP) rate ranging up to 42%1, 2. Because the tumor is obscured by the ablation zone (AZ), to evaluate whether the AZ encompasses the tumor with an ablative margin (AM), visual side-by-side comparison of pre- and post-TA images is usually performed. Although magnetic resonance imaging (MRI) offers superior intra-procedural visualization of the LM without contrast injection, respiratory motion of the liver (even when performed under a breath hold) results in a mismatch in the imaging slice’s position between pre- and post-TA images. This leads to inaccuracies in visual assessment of the AM and requires image registration capabilities currently not supported by the manufacturers of the TA equipment. The goal of this work was to develop and validate a three-dimensional (3D) registration-based technique that could improve the accuracy of AM assessment during MRI-guided liver TA.Methods
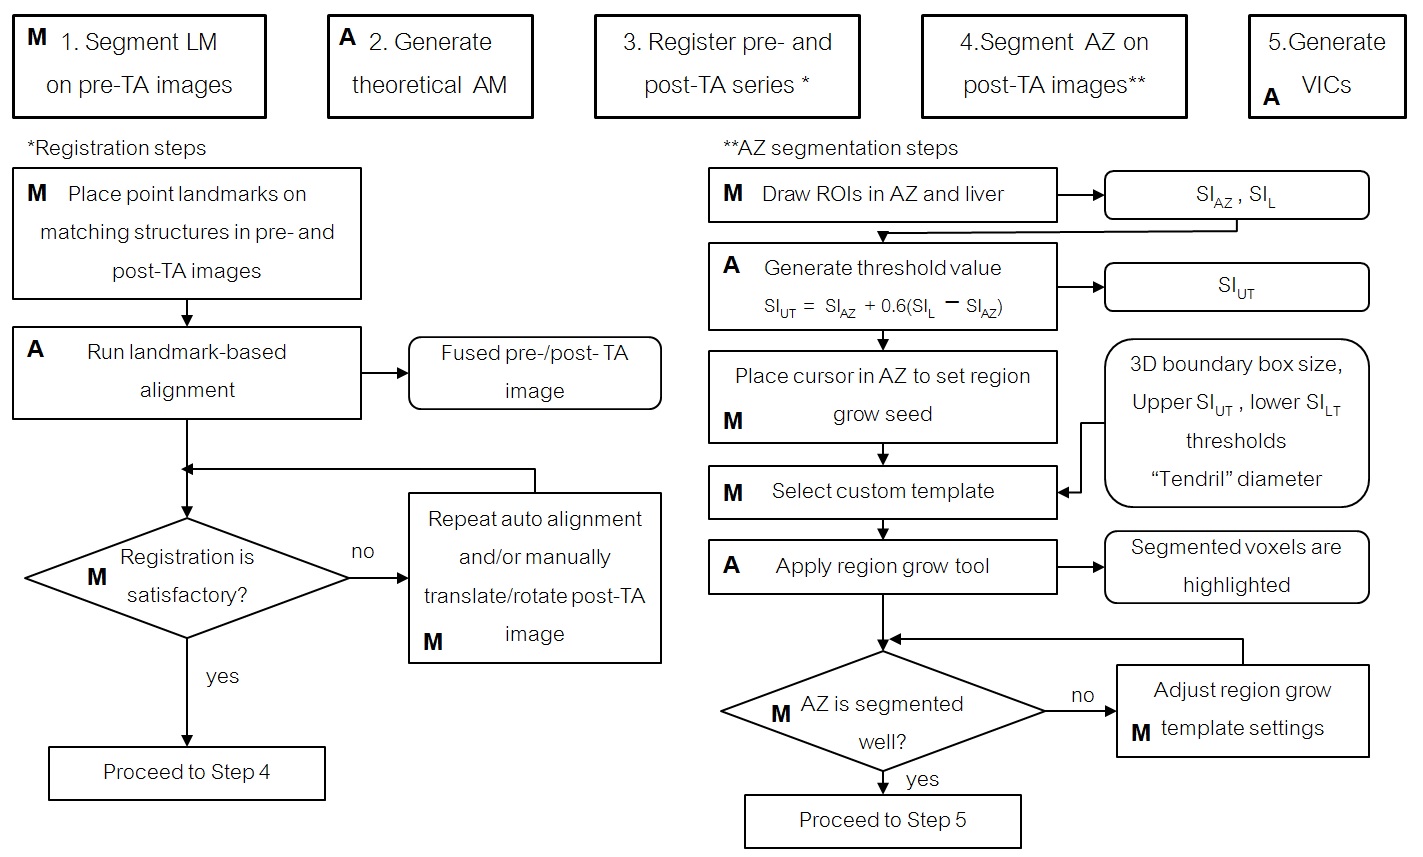
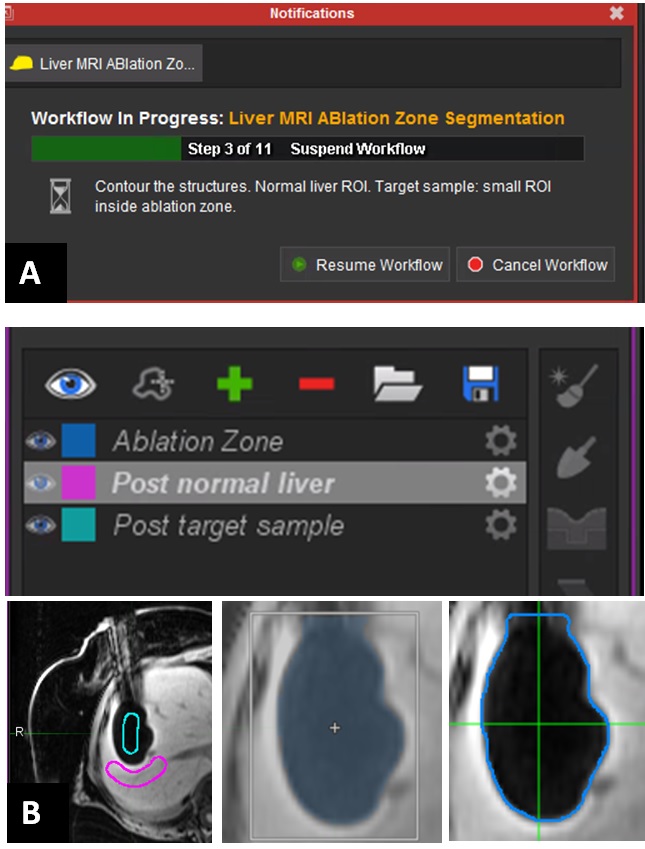
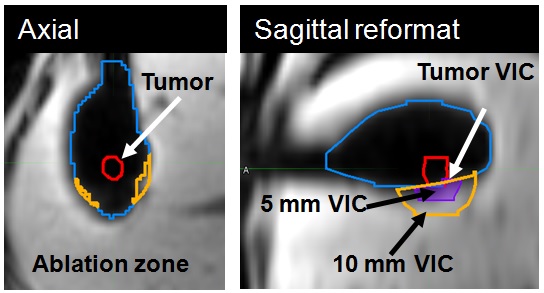
A dedicated 3D AM assessment technique was developed using a multi-modality image processing software package (Maestro, MIM Software, Inc.), commonly applied in our institution to aid in radiation treatment planning. Using the customization functionality of the software, the technique was programmed as an interactive workflow to automate and standardize the assessment process (Figure 1). Automated prompts were created to guide the user and request user input (Figure 2a). User input was needed to manually segment the tumor, place the contours for semi-automated region-grow segmentation of the AZ (Figure 2b), place the landmarks for automated rigid registration, and verify segmentation and registration. The output of the assessment were the volumes of insufficient coverage (VICs), indicating the 3D regions of insufficient coverage of the tumor, 5 mm and 10 mm margins. The technique was validated by an interventional radiologist with 20 years of experience and retrospectively evaluated in a study approved by our institutional review board. Seventeen MRI-guided sessions of TA for LM performed in 18 patients (11/2010 – 12/2016) were reviewed. The treated lesions (n=26) included LMs from colorectal, ovarian, uveal melanoma, bladder, testicular, carcinoid, gastric leiomyosarcoma, squamous cell carcinoma, cholangiocarcinoma cancer and hepatocellular carcinomas. Cryo (n = 13), laser (n = 11) and microwave (n = 2) ablations were performed in a closed-bore 1.5 T MRI scanner. Contrast injection was used to evaluate the AZ after laser and microwave ablations; the volume of the ice ball acted as the AZ for the cryoablation cases. The radiological reports were reviewed for description of AZ coverage. The 3D AM assessment was applied to 24 cases (two were excluded due to overlapping AZs). Tumor volume and the calculated VICs (tumor, 5 mm, 10 mm) were recorded. VICs values grater than 0 ml were considered indicative of residual tumor (Figure 4). Discrimination power of these metrics to predict LTP within the first year after ablation was studied using ROC curve analysis.Results
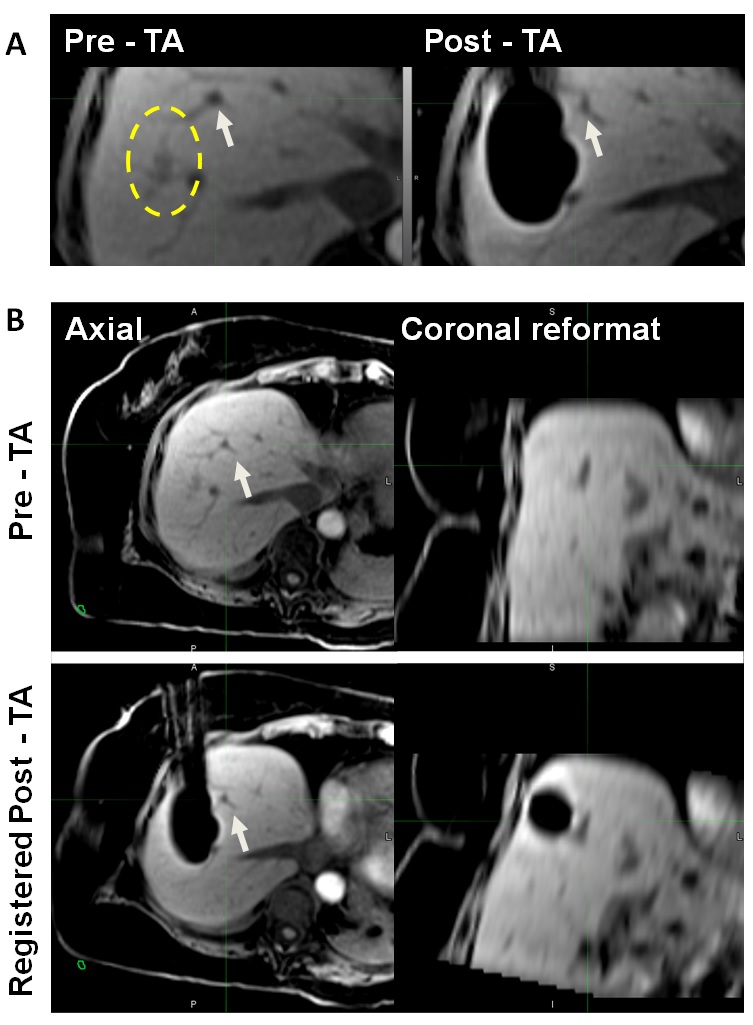
The results of the evaluation showed that accurate landmark-based rigid registration was possible in all cases. Pre and post-TA images acquired with the same or different sequences were registered equally successfully. The image containing the AZ often needed to be translated and rotated in order to align the landmarks locally (near the tumor and the AZ) (Figure 3). Semi-automated region-grow segmentation of the ice ball was successful in 100% of the cases, while segmentation of AZ on contrast-enhanced images required manual contouring in 2 out of 11 cases. Compared to the visual assessment of the AM, which did not identify those cases where AM were not sufficiently covered, 3D assessment found 7 cases with non-zero tumor VIC. Six out of seven cases developed LTP within the first 12 months. In the remaining case with non-zero tumor VIC and no LTP, a large hematoma, which developed at the site of TA, may have obscured the imaging. The ROC analysis showed that tumor VIC had significant discrimination power in predicting one-year LTP with AUC of 0.849 (95% CI: 0.643-1.0). The sensitivity of tumor VIC metrics with a threshold of 0 ml was 83.3% and specificity was 87.5%.Discussion and Conclusion
Previously, the feasibility of the 3D AM assessment was demonstrated using diagnostic MR images obtained day(s) after MR-guided cryo-ablation[3] or CT-guided radiofrequency ablation[4]. Our work shows the feasibility of performing intra-procedural assessment of MR-guided ablation. The proposed approach was found technically successful, and it identified the cases that could have benefited from immediate additional ablation in order to cover the residual tumor volume. Compared to previous work, this technique leverages a clinical image processing platform already used in our institution to aid radiation treatment planning thus making it readily adaptable for prospective clinical use in MRI-guided TA.
Acknowledgements
We thank Jim Keller and Nadia Petre for their assistance in abstract preparation.References
1. Gillams A, Lees W. Five-year survival in 309 patients with colorectal liver metastases treated with radiofrequency ablation. European radiology. 2009;19(5):1206-13.
2. Hamada A, Yamakado K, Nakatsuka A, et al. Radiofrequency ablation for colorectal liver metastases: prognostic factors in non-surgical candidates. Japanese journal of radiology. 2012;30(7):567-74.
3. Ahmed M, Solbiati L, Brace CL, et al. Image-guided tumor ablation: standardization of terminology and reporting criteria—a 10-year update. Journal of Vascular and Interventional Radiology. 2014;25(11):1691-705. e4.
4. Silverman SG, Sun MR, Tuncali K, et al. Three-dimensional assessment of MRI-guided percutaneous cryotherapy of liver metastases. American Journal of Roentgenology. 2004;183(3):707-12.
5. Hocquelet A, Trillaud H, Frulio N, et al. Three-Dimensional Measurement of Hepatocellular Carcinoma Ablation Zones and Margins for Predicting Local Tumor Progression. Journal of Vascular and Interventional Radiology. 2016.
Figures