4033
In vivo feasibility of PRF thermometry in the swine pancreas during laser ablationCéline Giraudeau1, Paola Saccomandi1, Federico Davrieux1, Giuseppe Quero1, Emiliano Schena2, Michele Diana1, Francesco Maria Di Matteo3, Guido Costamagna4, and Jacques Marescaux1
1IHU Strasbourg, Institute of image-guided surgery, Strasbourg, France, 2Unit of Measurements and Biomedical Instrumentation, Università Campus Bio-Medico di Roma, Rome, Italy, 3Unit of Endoscopy, Università Campus Bio-Medico di Roma, Rome, Italy, 4Unit of Digestive Endoscopy, Università Cattolica del Sacro Cuore, Policlinico Gemelli, Rome, Italy
Synopsis
The purpose of this preliminary work was to investigate the feasibility to get accurate PRF thermometryimages in the in vivo swine pancreas during laser ablation. We show that PRF thermometry images and consistent temperatures curves can be obtained during the procedure, and these results are confirmed by temperature sensor measurements and histological examination. The presence of a susceptibility artifact (presence of gas bubbles) is discussed.
Introduction & Purpose
Pancreatic cancer has a very poor prognosis. Currently, its treatment is complex and invasive as it often requires an open surgery. Laser ablation (LA) is a minimally invasive procedure already used in clinical practice for the treatment of tumors in deep-lying organs like the prostate, and thus could be an appropriate treatment procedure for pancreatic tumors. In order to ensure the safety and efficacy of the procedure, it is highly desirable to monitor the temperature increase in real-time, which can be performed with MR-based thermometry. Tests have already been carried out ex vivo with T1-weighted sequences1, but this method requires calibration. Proton resonance frequency (PRF)-based phase shift MRI is more widely used to guide local thermal ablation treatment2. The purpose of this preliminary work was to investigate the feasibility to get accurate PRF thermometry images in the in vivo swine pancreas during LA.Methods
The experiments were approved by the
local ethics committee. Three
pigs (weight 47-58 kg) were intubated and placed in a 1.5T clinical MRI scanner
(Magnetom Aera, Siemens, Germany) in lateral decubitus position. During all the
procedure, anesthesia and uniform ventilation were maintained with 2%
isoflurane and intermittent administration of curare. The abdomen was surrounded by a
four-element flexible phased-array coil. Two custom-made carbon fiber MRI
compatible needles were inserted inside the pancreas under MRI guidance and were
~5mm apart. An optical fiber guiding Nd:YAG laser light (2 to 3.5 W power) was
inserted in the first needle, and a fiber Bragg grating sensor providing
real-time temperature increase was inserted in second needle3. The
guidance sequence was a T1-weighted sequence acquired during apnea, providing
anatomical images at the same time (VIBE sequence, TE/TR=1.98/4.69ms, pixel
resolution 1.17*1.17*2mm3, TA=50s). Two LA were performed for each
pig in the head of the pancreas: after the first ablation, both needles were moved
a few centimeters away and a second ablation was performed without overlapping
with the former one. PRF-thermometry images were acquired with a dedicated respiratory-gated
GRE-EPI sequence providing magnitude, phase subtraction and motion images. The
ablation began 30s after the beginning of the acquisition and stopped ~2
minutes before the end of the acquisition, and lasted 10 (for the first
two pigs) or 15 min (for the last pig). The following parameters were used:
TE/TR=13/43ms, FoV 320*320cm², in-plane resolution 128*128 pixels, three
3.5mm-thick axial slices, fat suppression, total number of scans 240/300 (80 or 100
for each slice).
Pigs were euthanized at the end of the
procedure and the pancreas was removed for histological assessment. Temperature maps were
reconstructed from the phase subtraction images with a homemade Matlab routine.
Phase unwrapping was performed in case of aliasing and B0 drift was corrected
by considering the phase at each time step in a ROI chosen in the pig dorsal
muscle where no heat effect occurred.
Results & Discussion
An example of temperature map superimposed on
the magnitude image is shown in Fig1. This figure shows a small area where consistent
temperature increases were found as compared with the sensor (Fig. 2A and 2B). In this area, as
the distance from the tip of the laser increases, lower temperatures and greater
thermal inertia were found as expected (Fig. 2C and 2D). Macroscopical and histological examination
confirmed the small size of the lesion for all the animals (~1cm diameter , see Fig. 3). More surprisingly, a large adjacent
area was found with negative ΔT. This effect was seen for all the ablations and
was attributed to the presence of gas bubbles (water steam due to very high temperatures),
leading to cavitation-induced phase shift in our images. Such apparent decrease
in the temperature map has already been reported during radiofrequency ablation,
and it has been demonstrated that this effect did not occur at low power4. A
first order correction has been proposed by the same authors to minimize the
measurement errors4. This result emphasizes the importance of the chosen
therapeutic power for the reliable monitoring of LA.Conclusions & Future Work
PRF thermometry images and consistent temperatures curves were obtained during LA in the in vivo swine pancreas, despite the presence of a susceptibility artifact that could hamper the monitoring of the procedure. We intend to perform new experiments to investigate the effect of the laser power on our thermometry images.Acknowledgements
We thank Thibaut Eisele and Khalid Ambarki from Siemens for their kind support about the MRI protocol and the IHU team of technicians for the management of animal anesthesia.References
1. Allegretti G et al. Med Eng Phys 2015; 37:631-641
2. Rieke V et al. J Magn Reson Imaging 2008; 27:376-390
3. Saccomandi P et al. IEEE Eng Med BiolSoc 2017; 873-876
4. Viallon M et al. Med Phys 2010; 37: 1491-1506
Figures
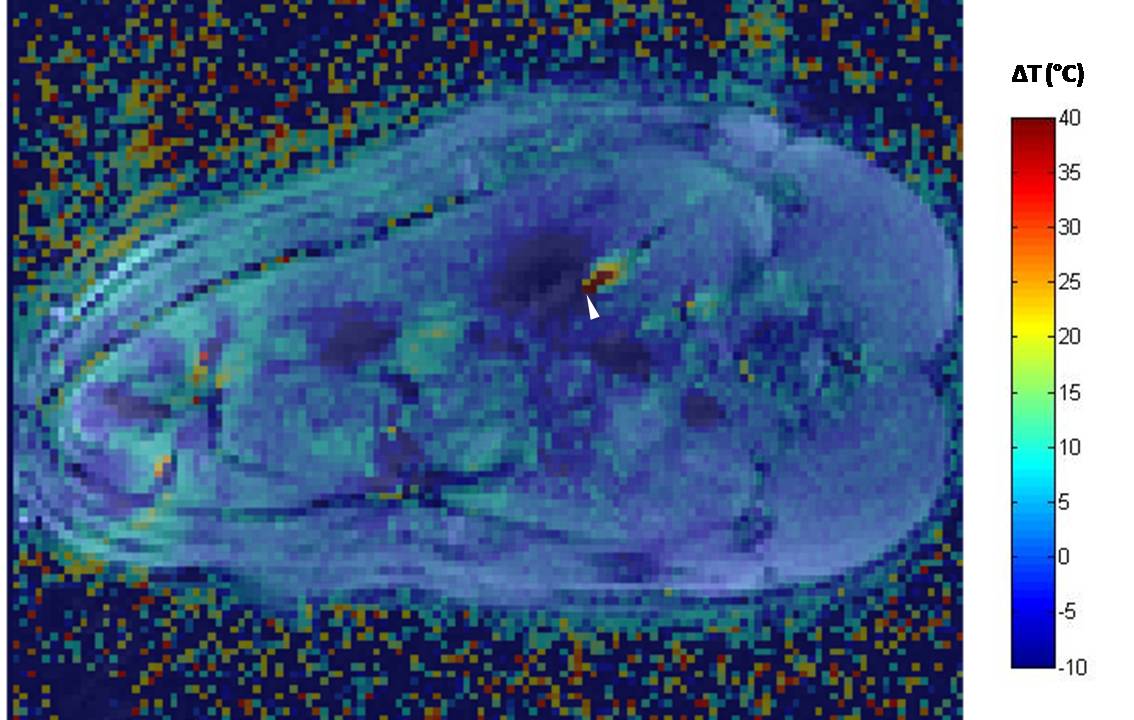
Example of overlay of the
temperature map and magnitude image. The tip of the laser is indicated by the
white arrow head.

Temperature
curve found close to the sensor (A)
and corresponding trend measured with the sensor (B). The temperature found with our
images close to the tip of the laser was very high (C) explaining the
susceptibility effect seen on our images owing to the presence of gas bubbles. The
temperature decreases as the distance from the laser increases (D: temperatures measured 5mm, 7.5mm
and 10mm away from the tip of the laser for the red, blue and yellow curves respectively).
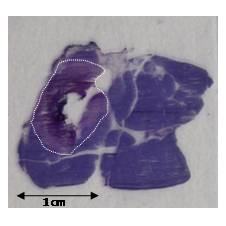
Histological
sample showing the burnt pancreatic tissue bounded by the white dotted line.