4030
High resolution localized 2D JPRESS spectroscopy with absorption-mode lineshape1Department of Electronic Science, Xiamen University, Xiamen, China, 2Xiamen University, Xiamen, China
Synopsis
Localized two-dimensional J-resolved spectroscopy (JPRESS) has been employed in the study of a number of diseases. However, phase-twisted lineshape and broad dispersion tails of magnitude peaks limit its usefulness. Here, a method based on the combination of JPRESS and anti-JPRESS alike spectra is proposed to remove the dispersive parts of the phase-twisted and to give absorption-mode JPRESS spectroscopy. This can double the resolution of JPRESS spectra at the cost of greatly reduced sensitivity. The method was performed with a phantom on a 7T animal scanner.
Introduction
Localized two-dimensional J-resolved spectroscopy (JPRESS) is one of the simplest 2D sequences and well suited for in vivo applications. It encodes a second frequency dimension and separates all uncoupled and scalar spin-spin (J)-coupled metabolite resonances across a 2D spectral surface. It circumvents the issue of severe metabolite peak overlap available in the 1D PRESS spectroscopy. However, conventional JPRESS spectroscopy suffers from phase-twisted lineshape and broad dispersion tails of magnitude peaks and thus which limit its usefulness. Here, a method based on the combination of JPRESS and anti-JPRESS alike spectra1 is proposed to remove the dispersive parts of the phase-twisted lineshapes and to give absorption-mode JPRESS spectra.Methods and Materials
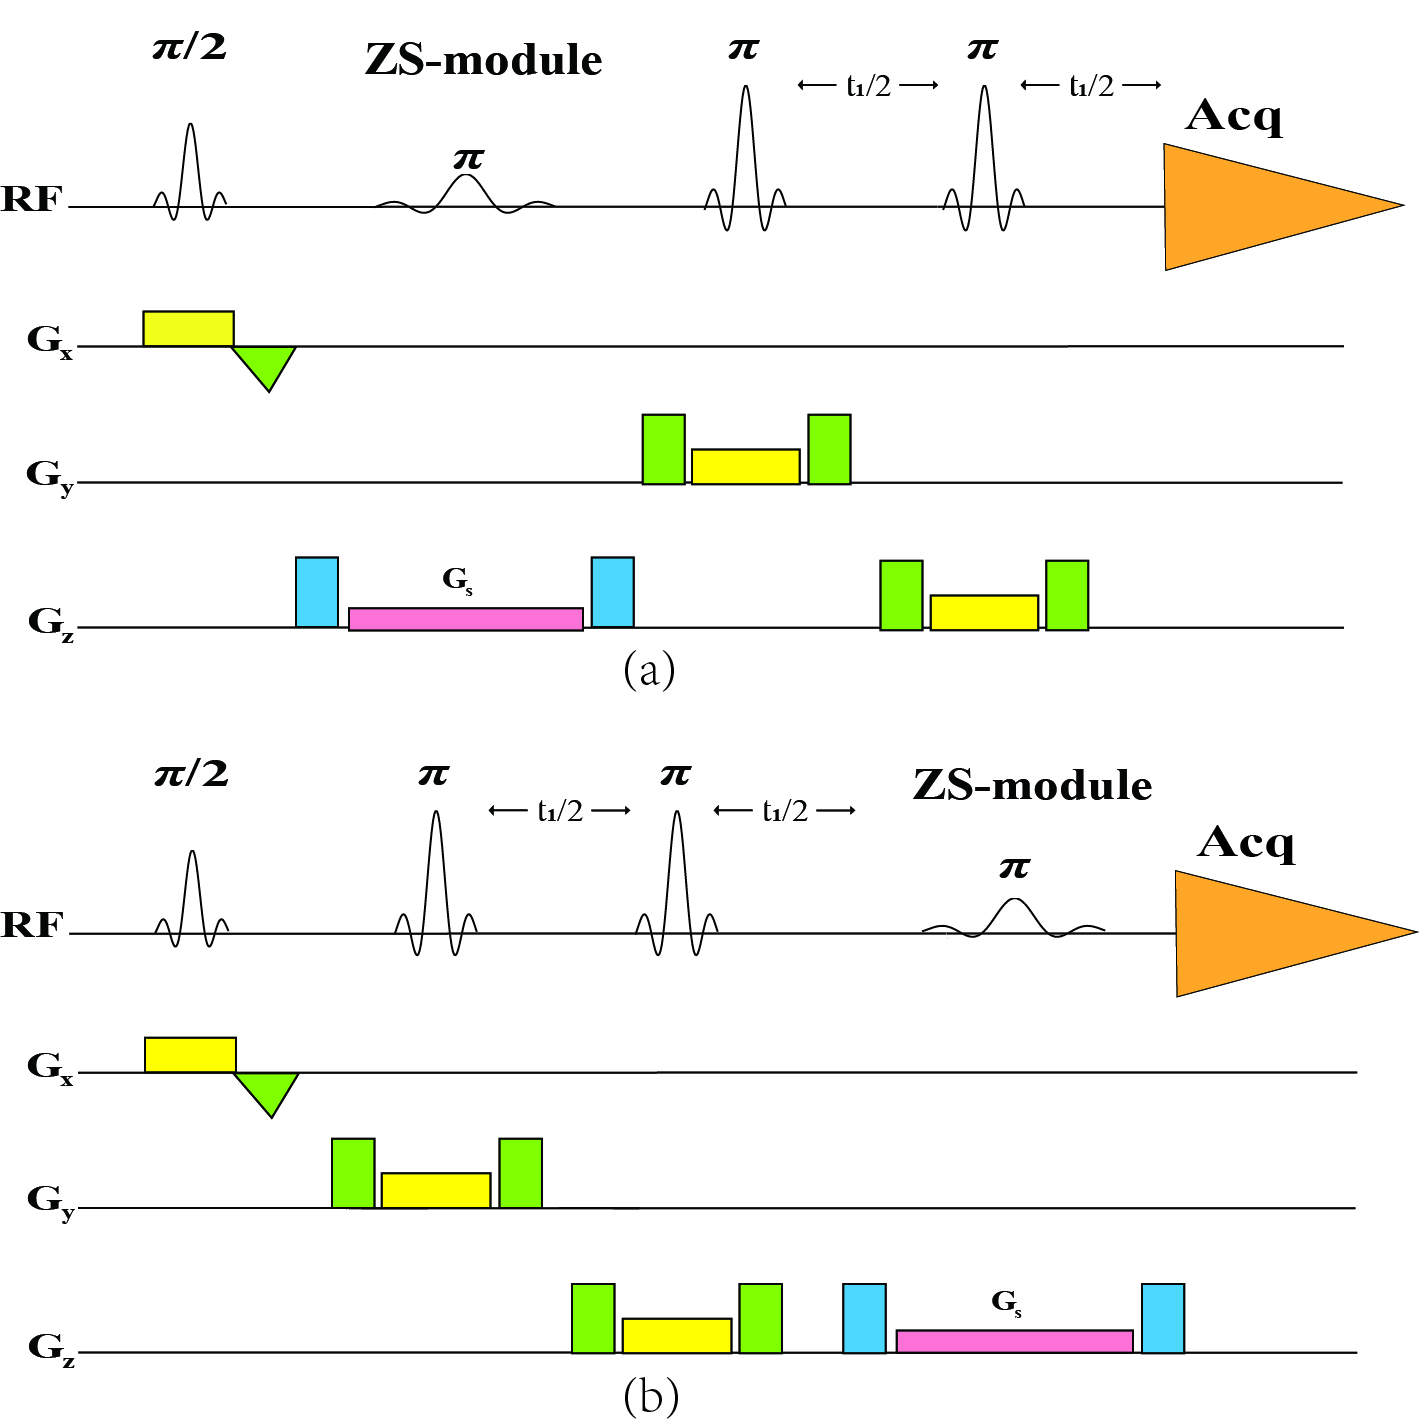
The proposed pulse
sequence for high resolution localized 2D JPRESS spectroscopy with
absorption-mode lineshapes is shown in Fig. 1. Fig. 1a is employed to acquire JPRESS spectra, and Fig. 1b to acquire anti-JPRESS
spectra. ZS-module, which is a combination of a selective 180°pulse with
a simultaneous weak gradient—a pulse sequence element introduced by Zangger and
Sterk2, has the effect of separately inverting each spin while
leaving all its coupled partners unaffected.
Experiments were
carried out on a Varian 7.0T/160 mm animal scanner with a 63/95 mm quadrature
birdcage coil. The variable power and optimized relaxation delays (VAPOR)
module provided by vendor was used to suppress the strong water signal. A
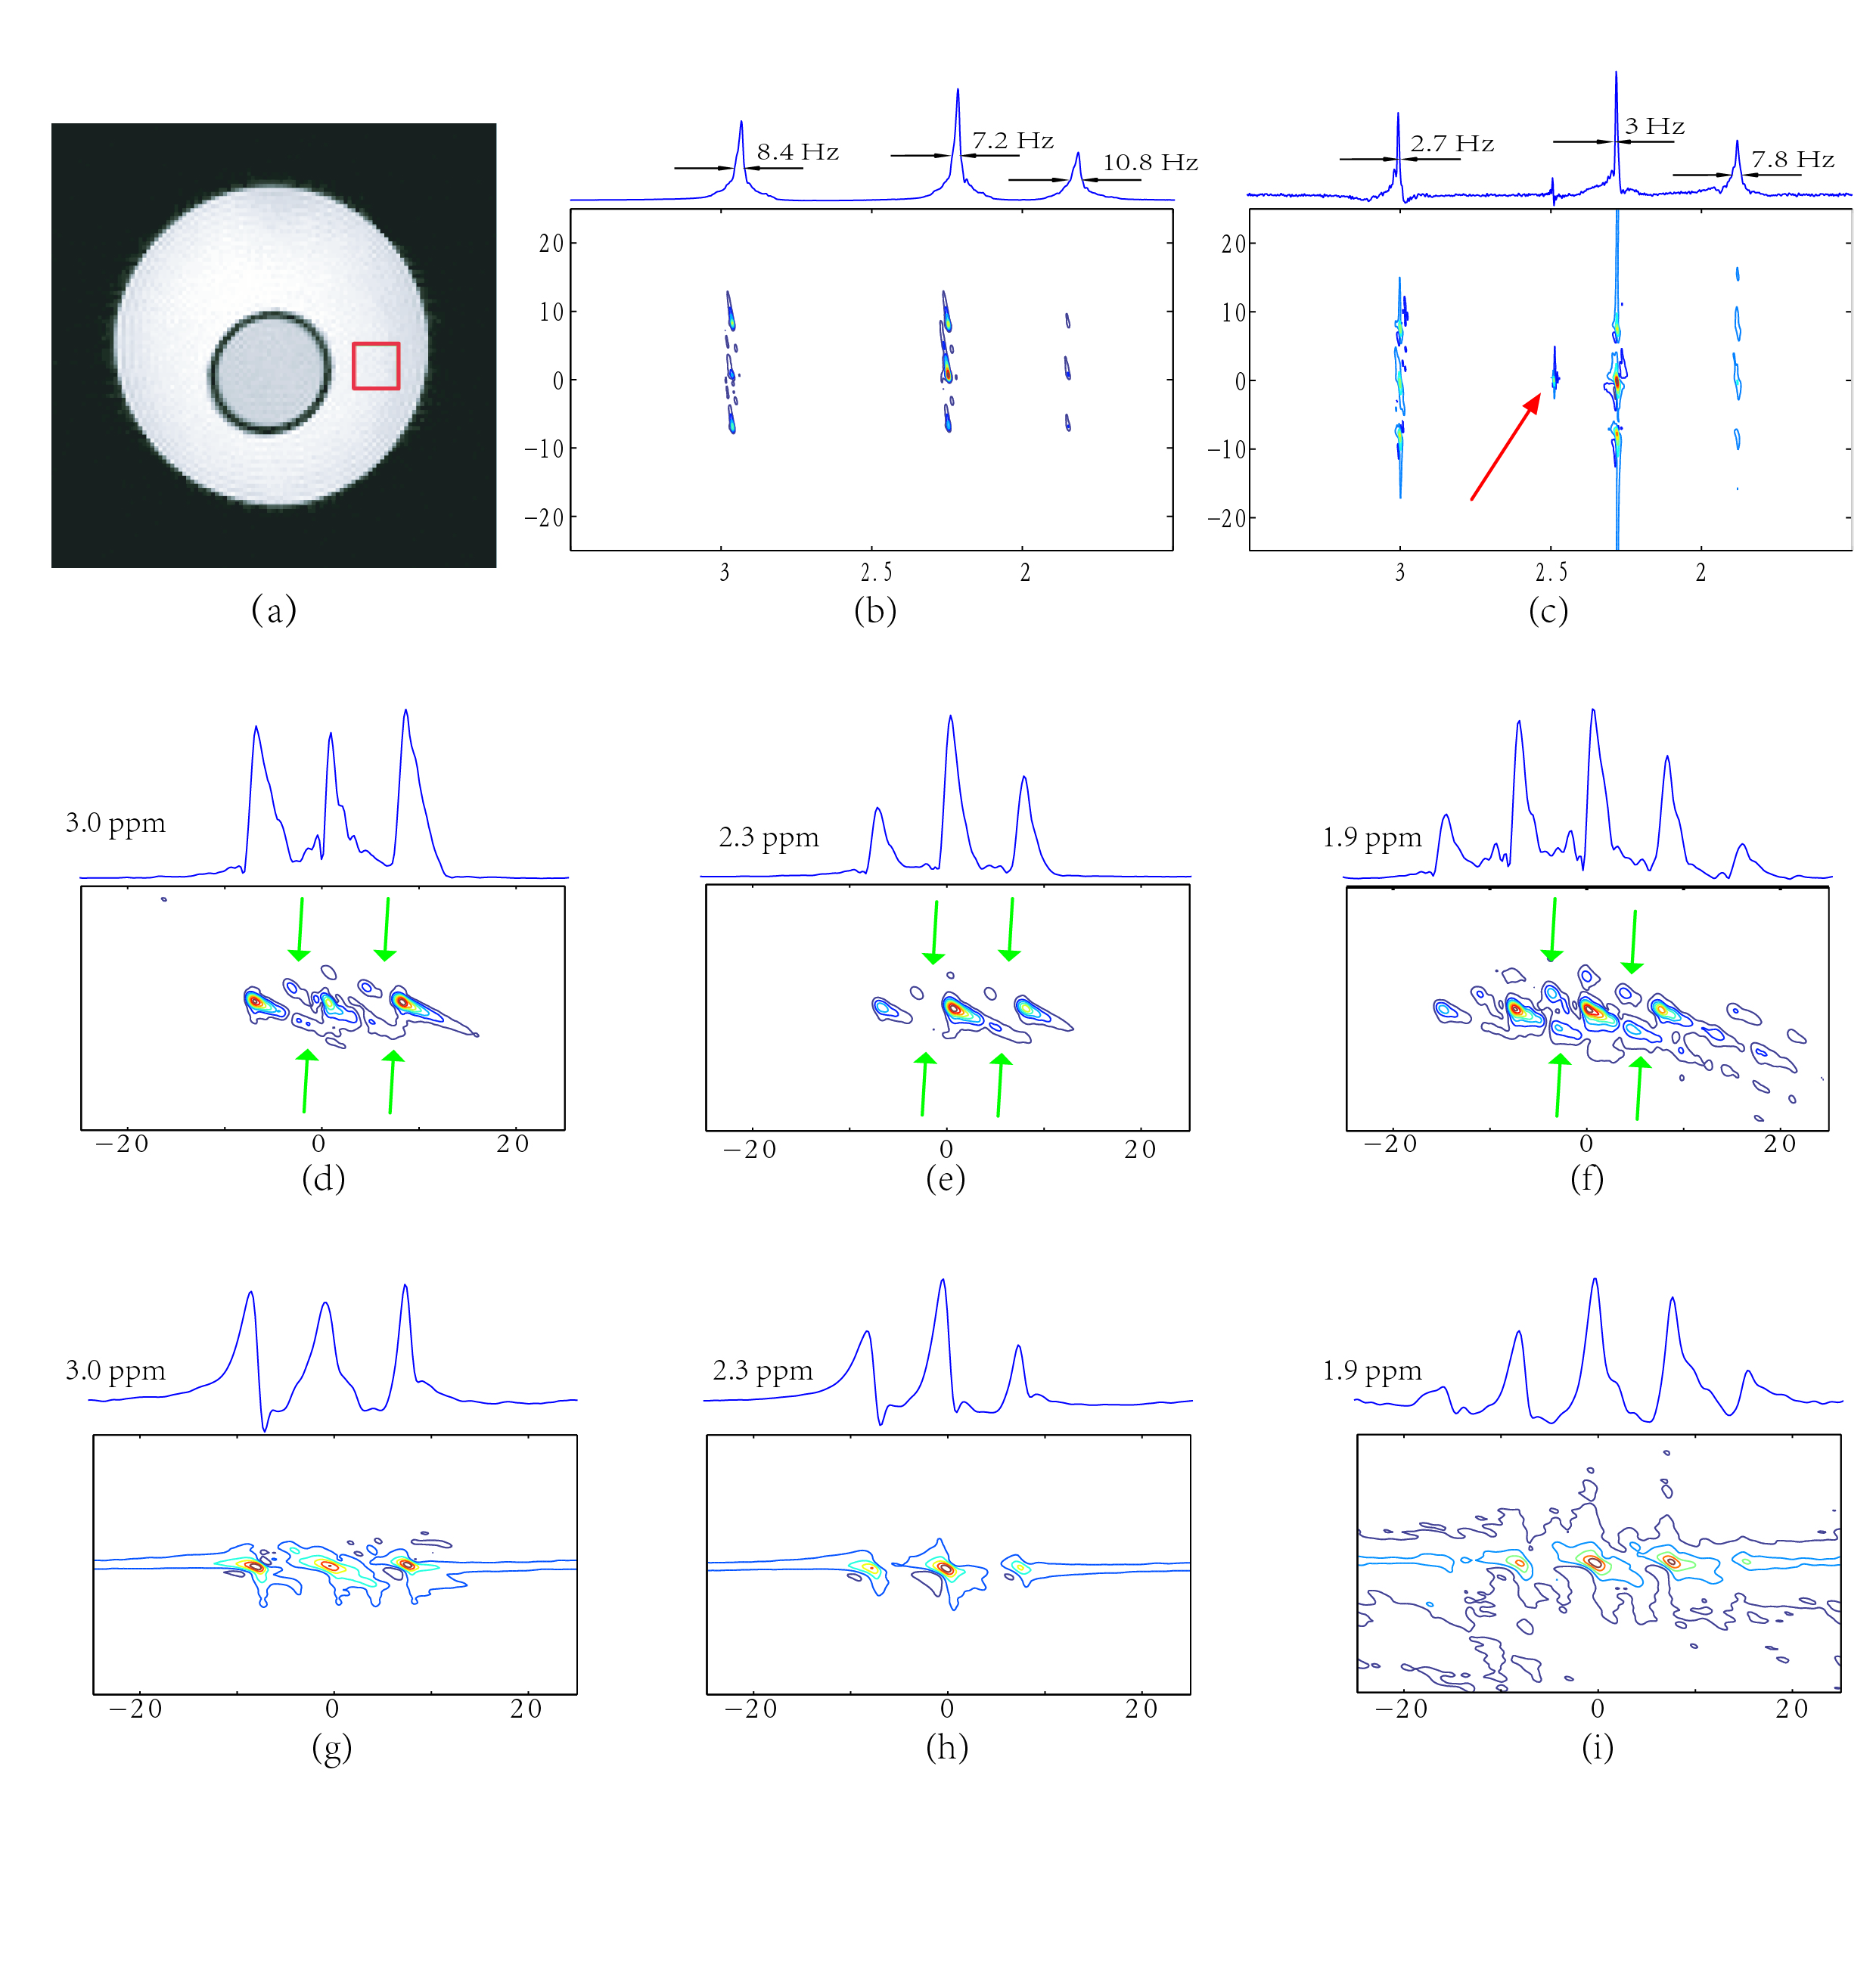
phantom built of two concentric glass cylinders was used to demonstrate the feasibility
of this new sequence. The inner 12-mm-diameter tube is filled with 1 M threonine
solution and the outer 32-mm-diameter tube with 1 M γ-aminobutyric
acid (GABA) solution. A voxel of 5 × 5 × 6 mm3 (see Fig. 2a) were prescribed
to cover only the outer tube. The raw data were saved and processed using
home-made software.
Results
The conventional JPRESS spectrum is shown in Fig. 2b. The combination spectrum obtained from the combination of JPRESS and anti-JPRESS spectra acquired by sequences in Fig. 1 is present in Fig. 2c. Its projection spectrum on the F2 dimension demonstrates a homonuclear decoupled spectrum. The resolution of projection spectrum in Fig. 2c is doubled in comparison with that in Fig. 2b. The expansions and their F1 projections are shown in Fig. 2d-i. The peaks indicated by green arrows in Fig. 2d-f arise due to incomplete refocusing3. The artefact indicated by the red arrow appears at the spectral center, caused by an unknown reason.Discussion
The resolution improvement brought by the JPRSS spectrum in Fig. 2b will facilitate direct spectral assignment and quantification. However, this enhancement is obtained at the expense of sensitivity. Delicate design for increasing SNR is needed in the further study.Acknowledgements
This work was partially supported by the National Natural Science Foundation of China under Grants U1732158, and Fundamental Research Funds for the Central Universities under Grant 20720170036.References
(1) A.J. Pell, J. Keeler. J. Magn. Reson. 189 (2007) 293-299. (2) K. Zangger, H. Sterk. J. Magn. Reson. 71 (2014) 911-920. (3) M. Lin, A. Kumar, S. Lin. Magn. Reson. Med. 124 (1997) 486-489.Figures